0 ITEMS

Dynamic Financial Charts for Pitch Decks: Link Excel to Slides

Paste each Excel chart into PowerPoint as a linked chart, or insert it into Google Slides from Sheets with “Link to spreadsheet” checked, and refresh it with one click whenever the model changes. This guide covers both routes, a worked example and a repeatable workflow that keeps every pitch deck chart tied to a single source model.
Key Takeaways
- A linked chart stays connected to its Excel workbook, so a refresh updates chart data; typed slide text still needs a manual check.
- PowerPoint refreshes a linked chart through Chart Design and Refresh Data; Google Slides uses an Update button on the chart.
- Moving or deleting the source workbook breaks the link, so repoint it with Change Source before an investor meeting.
- Keep inputs, calculations and results on separate sheets, and let charts read from the results rather than from pasted values.
- Export a final PDF for investors, and keep the linked file for internal use.
Linking an Excel Chart to PowerPoint Takes One Paste Option and One Refresh Button
The reliable route is to copy the chart in Excel, paste it into PowerPoint, and pick the paste option that keeps the link. Microsoft’s guidance on copying from Excel to another Office program describes the Keep Source Formatting & Link Data option, which keeps the chart formatting exactly as is and keeps the chart linked to the original worksheet.
Follow these steps:
- Build the chart in Excel from a clean table, and save the workbook in a stable folder.
- Copy the chart, switch to the slide and paste it.
- Open the Paste Options button that appears beside the chart and choose Keep Source Formatting & Link Data.
- After the workbook changes, select the chart on the slide, open the Chart Design tab and select Refresh Data, as Microsoft’s page on refreshing linked chart data from Excel describes.
The link depends on the file location. Microsoft explains that a link error appears when the external file is moved or deleted, and its page on updating or removing a broken link points to File, Info, Related Documents and Edit Links to Files. From that list, Change Source repoints the chart to the new file. Break Link leaves the content on the slide but embeds it instead of linking it, which means the chart no longer updates from the workbook.
Google Slides Refreshes a Linked Sheets Chart Through an Update Button
Google Slides handles the same job when the chart lives in Google Sheets. Choose Insert, then Chart, then From Sheets, pick the spreadsheet, select the chart and leave “Link to spreadsheet” checked before importing. Google’s help page on adding charts from Sheets to Slides and Docs tells readers to click Update in the top right corner of the chart to bring in the latest data.
An Excel-first team can still use this route. Google documents that Excel data can be imported into Sheets, after which a chart can be inserted into Slides with the link on; check that charts and formulas survive the import, because the page covers the data import only. The trade-off is that the Sheets copy becomes the working source, so decide which file holds the real model before the first investor meeting and keep a single owner for it. Test the Update button on the presenting computer before the meeting.
Manual Chart Updates Put a Pitch Deck at Risk
In this guide’s view, numbers that disagree from one slide to the next are a common source of doubt for investors. A 2024 study in Frontiers of Computer Science, reported by Phys.org without a stated sample size and based on a review of decades of earlier research, found that 94% of spreadsheets used in business decision-making contain errors. That signals general risk rather than a prediction for any single workbook; check the model before linking charts, because a link carries whatever the workbook holds into the deck.
Manual handling also worries finance leaders. A BlackLine survey of more than 1,300 senior finance and accounting professionals in seven countries, reported by the Journal of Accountancy in January 2024, found that 68% said manual work leaves their organization vulnerable to errors that could undermine business decision-making. BlackLine sells finance software, so the survey shows concern among finance professionals rather than measuring errors in pitch decks. In this guide’s view, a revenue chart that disagrees with the next slide’s summary costs more credibility than it earns.

Worked Example: One Source Table Feeds Every Chart in the Deck
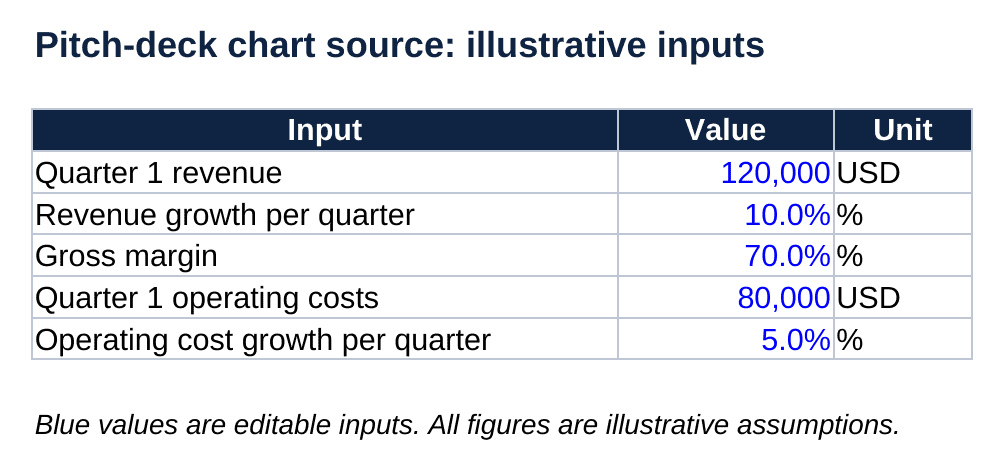
The example below is illustrative, not a forecast. Assume a young company with quarter 1 revenue of USD 120,000, revenue growth of 10% per quarter, a gross margin of 70% (the share of revenue left after the direct cost of delivering the product), quarter 1 operating costs of USD 80,000 and operating cost growth of 5% per quarter.
The calculation sheet turns those inputs into four lines, shown below in USD. Gross profit is revenue multiplied by the 70% margin, and operating profit is gross profit minus operating costs.
| Line (USD) | Q1 | Q2 | Q3 | Q4 | Full year |
|---|---|---|---|---|---|
| Revenue | 120,000 | 132,000 | 145,200 | 159,720 | 556,920 |
| Gross profit | 84,000 | 92,400 | 101,640 | 111,804 | 389,844 |
| Operating costs | 80,000 | 84,000 | 88,200 | 92,610 | 344,810 |
| Operating profit | 4,000 | 8,400 | 13,440 | 19,194 | 45,034 |
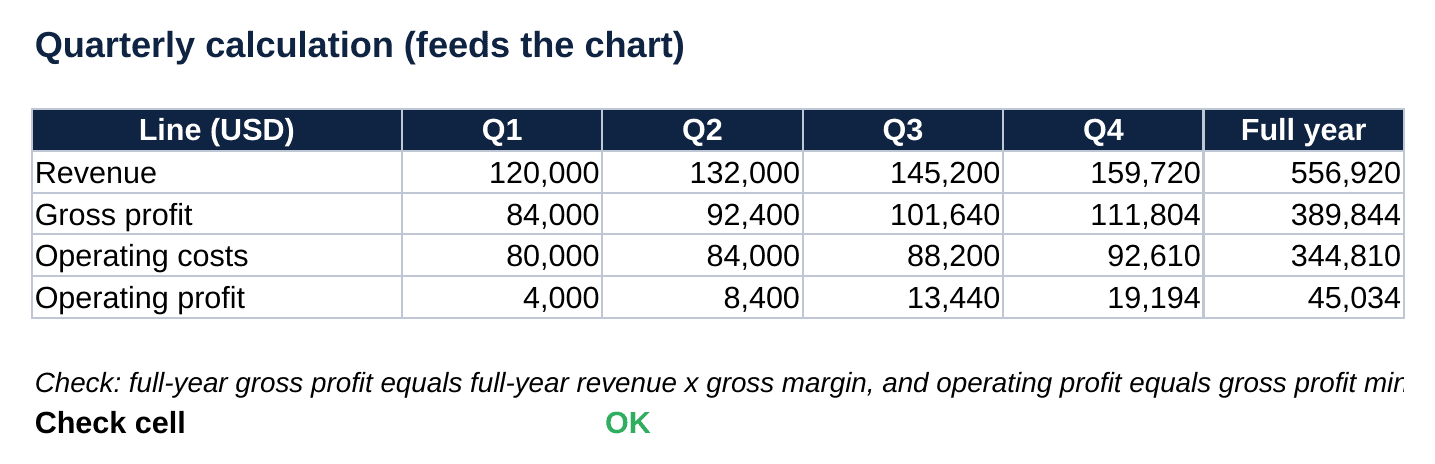
The full-year operating profit of USD 45,034 equals the four quarterly figures added together, and also equals USD 389,844 of gross profit less USD 344,810 of operating costs. A check cell reads OK when full-year gross profit equals full-year revenue times the margin and the full-year operating profit equals the sum of its four quarters.
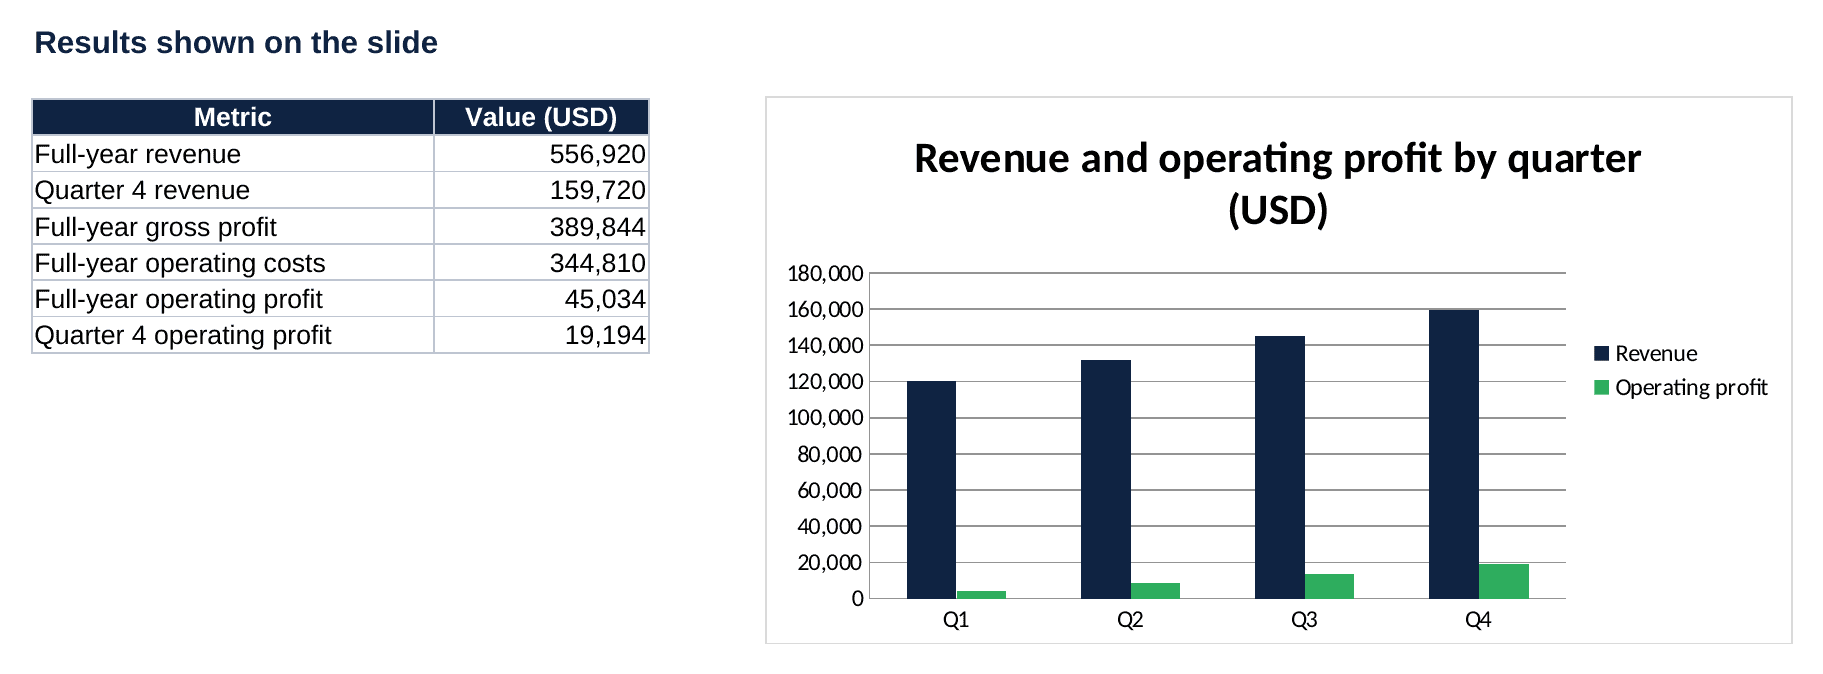
Paste the results chart into the deck as a linked chart. When an assumption changes, the calculation sheet and the chart update in Excel, and a single refresh on the slide brings the new bars into the deck. A headline typed on the slide can quote the same USD 556,920, but typed text is not linked to the workbook, so update it by hand and compare it with the Results sheet after each refresh.
A Repeatable Workflow Keeps Charts and Numbers in Sync
A small routine prevents most last-minute fixes. The table below shows the order that works for a deck with several charts.
| Step | Action | Why it matters |
|---|---|---|
| 1 | Keep all assumptions on one inputs sheet | Every chart traces back to a single edit point |
| 2 | Feed charts from a calculation sheet, never from typed values | A changed input reaches every chart |
| 3 | Add a check cell that reads OK when totals reconcile | Errors surface before the deck leaves the building |
| 4 | Store the workbook in a stable folder and note its path | Moving or deleting the file triggers a link error, and Change Source is the repair |
| 5 | Refresh every linked chart, then compare slide numbers with the results sheet | Charts and text agree on the final version |
Charts that already sit in a purchased model follow the same routes: copy them from the model’s output sheet and paste them with the link option. Protected output sheets, or a model saved under a new file name, can leave links pointing at the old file, so model-specific issues belong with the model’s publisher. Menus follow the Microsoft and Google pages cited and may differ in other versions. Teams that start from a ready structure save setup time. The startup financial models collection, the fundraising tag and the dashboard tag on eFinancialModels group Excel-based models by topic.
Conclusion
Linked charts turn a pitch deck from a pile of pasted pictures into a view of one model. Link each chart to its source, refresh before every meeting, and let a check cell prove the totals first. Founders who want an investment case behind the deck can start from the Simple Fundraising Model on eFinancialModels, a free Excel template that its page describes as calculating the internal rate of return (IRR) and expected profits by investor.
Frequently Asked Questions
Can a chart pasted as a picture still be updated later?
A picture holds only pixels, so it carries no connection to the workbook and no refresh option. When the numbers move, the picture has to be deleted and replaced by a new paste. Pictures suit a final investor copy that must never change, but any working version should use a linked chart, because a linked chart reads from the workbook while an embedded one no longer updates from it.
Is it safe to email a deck that contains linked charts?
Linked charts point to a file path on the sender’s computer, and a recipient without that file sees stale data or a link prompt. The cleaner habit is to refresh everything, save a PDF for investors and keep the linked deck internal. A PDF also prevents accidental edits and keeps fonts and chart colors identical on every device, which matters when the deck is forwarded to partners the founder never meets.
How often should chart data be refreshed before a fundraising round?
Refresh at three moments: after every change to the model, the day before a scheduled meeting, and again an hour before presenting. Each refresh should be followed by a quick comparison of slide headlines against the results sheet. A short routine like this catches the mismatch that appears when a late assumption changes but only some slides are updated, and it is a rough estimate of a few minutes once the charts are linked.
Should a founder build deck charts in Excel or directly in the slides?
Build them in Excel when the numbers come from a model, because the formulas, checks and scenarios live there and the chart inherits them. Draw charts directly in the slides only for simple illustrations that no model supports. The first approach takes slightly longer on day one and avoids considerable rework every time an investor asks for a revised case, because only the inputs change and every chart follows.