0 ITEMS

How Long Until You Break Even? Break-Even Time Calculator

Break-even time is the number of months until a new venture’s cumulative cash turns positive, and in the hypothetical example below that happens in month 27 once the ramp-up period and a 150,000 USD launch investment are counted, with profit treated as cash and before tax. The four calculator steps in this guide let a growth-stage owner replace the example inputs with their own.
Key Takeaways
- Break-even time is the month when cumulative cash, including the launch investment, turns positive; it never arrives before the first profitable month.
- Break-even units equal monthly fixed costs divided by contribution margin per unit, so every pricing or cost change moves the target immediately.
- In the hypothetical example, operating break-even comes in month 10 but cumulative break-even only in month 27.
- The peak funding need, not the break-even month alone, decides whether the venture survives the ramp.
- In the illustrative lever test, a 10 percent price rise shortened the wait most, ahead of 10 percent cost or investment cuts.
Break-Even Time Is the Month When Cumulative Cash Turns Positive
Two clocks run in a new venture. The first stops in the operating break-even month, the first month in which sales revenue covers that month’s costs. The second stops in the cumulative break-even month, the first month in which the total cash earned since launch has repaid the launch investment as well, which is the payback of the whole launch. This guide answers the question of how long until break-even with the second clock, because it is the one that tells an owner when the funding can stop, and it never stops before the first.
Three terms drive the arithmetic. Fixed costs are costs that stay the same whatever the sales volume, such as salaries, rent and software subscriptions. Variable costs are costs that rise with each unit sold, such as materials and delivery. Contribution margin is, in the words of the open textbook Principles of Accounting, the amount by which a product’s selling price exceeds its total variable cost per unit, and it is the amount each sale contributes toward fixed costs.
The U.S. Small Business Administration (SBA) defines the break-even point, which is the operating clock described above, as the point where total cost and total revenue are equal, and it gives the unit formula as fixed costs divided by the difference between price and variable costs. The same guide notes that a new business is often losing money in the first few months or years before breaking even, which is why a time estimate matters as much as the unit target.
The risk is real for new ventures. The U.S. Bureau of Labor Statistics (BLS) reported in January 2024 that 34.7 percent of private-sector establishments born in March 2013 were still in operation in March 2023, and that the survival rate fell by 20.4 percentage points between 2013 and 2014. These figures describe all U.S. private-sector establishments, so they show the general scale of early risk, not the odds for any single industry.
The Calculator: Four Steps from Inputs to Break-Even Month
The calculator in this guide is a four-step method that runs in any spreadsheet with one row per month, and it needs seven inputs: the launch investment, the selling price per unit, the variable cost per unit, the monthly fixed costs, the first-month unit sales, the monthly growth in unit sales and the capacity limit. Four steps turn them into a break-even month.
| Step | Calculation | What it returns |
|---|---|---|
| 1 | Price per unit minus variable cost per unit | Contribution margin per unit |
| 2 | Monthly fixed costs divided by contribution margin per unit | Break-even units per month |
| 3 | First month in which forecast units reach the step 2 figure | Operating break-even month |
| 4 | Start from minus the launch investment and add each month’s profit (contribution margin times units, minus fixed costs) until the running total turns positive | Cumulative break-even month and peak funding need |
Peak funding need is the launch investment plus the deepest cumulative operating loss. Break-even units alone do not answer the owner’s question of how long until break-even, because step 3 and step 4 depend on how fast sales ramp up, and a spreadsheet with one row per month handles that better than a single formula. Owners who prefer ready-made structures can browse the break-even models at eFinancialModels.
Worked Example: A Hypothetical New Product Line in Three Ramp Scenarios
All amounts are U.S. dollars, and every input is an illustrative assumption. For a new line inside an existing business, fixed costs and the investment should include only the extra amounts the new line adds. Assume a launch investment of 150,000, a selling price of 80 per unit, a variable cost of 32 per unit and monthly fixed costs of 24,000. Assume sales of 150 units in month one, growing by 25, 40 or 60 units a month in the slow, base and fast scenarios, up to a capacity limit of 900 units a month.
Step 1 gives a contribution margin of 80 minus 32, which is 48 per unit. Step 2 gives 24,000 divided by 48, which is 500 units a month, equal to 40,000 in monthly revenue.
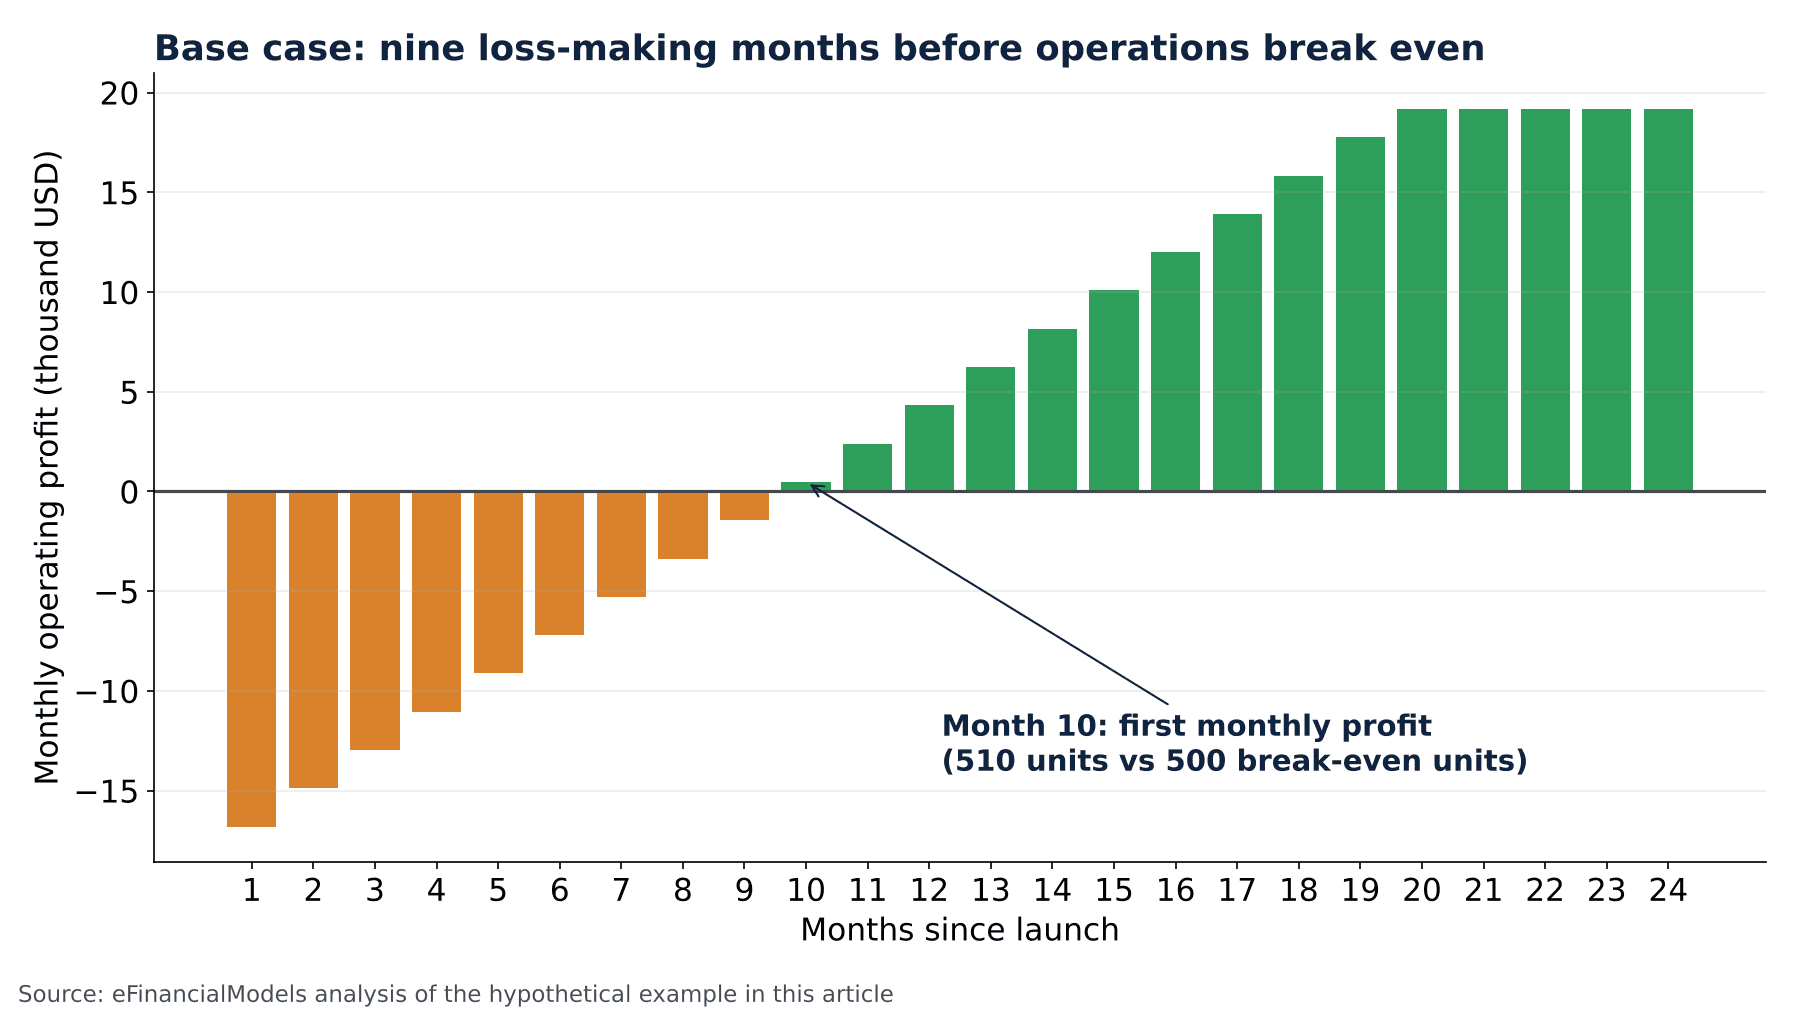
In the base scenario, sales are 150 plus 8 times 40, or 470 units, in month 9 and 510 units in month 10. Month 9 earns 470 times 48, which is 22,560, so after 24,000 of fixed costs it shows a loss of 1,440. Month 10 earns 510 times 48, which is 24,480, so it shows a profit of 480. Operating break-even arrives in month 10.
The monthly losses in months 1 to 9 are 16,800, 14,880, 12,960, 11,040, 9,120, 7,200, 5,280, 3,360 and 1,440, which add up to 82,080. The peak funding need is therefore 150,000 plus 82,080, which is 232,080. Sales reach the 900-unit limit in month 20, where monthly profit is 900 times 48 minus 24,000, or 19,200. Months 10 to 19 add 480, 2,400, 4,320, 6,240, 8,160, 10,080, 12,000, 13,920, 15,840 and 17,760, which total 91,200, and month 20 adds 19,200. Operating profit from months 10 to 20 is 91,200 plus 19,200, which is 110,400. Cumulative cash at the end of month 20 is therefore 110,400 minus the 232,080 peak funding already spent, which is negative 121,680. It then rises by 19,200 a month, so it is still negative by 6,480 at the end of month 26. The 19,200 earned in month 27 closes the gap, so cumulative break-even arrives in month 27.
| Scenario | Unit growth per month | Operating break-even month | Cumulative break-even month | Peak funding need |
|---|---|---|---|---|
| Slow | 25 | 15 | 37 | 276,000 |
| Base | 40 | 10 | 27 | 232,080 |
| Fast | 60 | 7 | 21 | 207,600 |
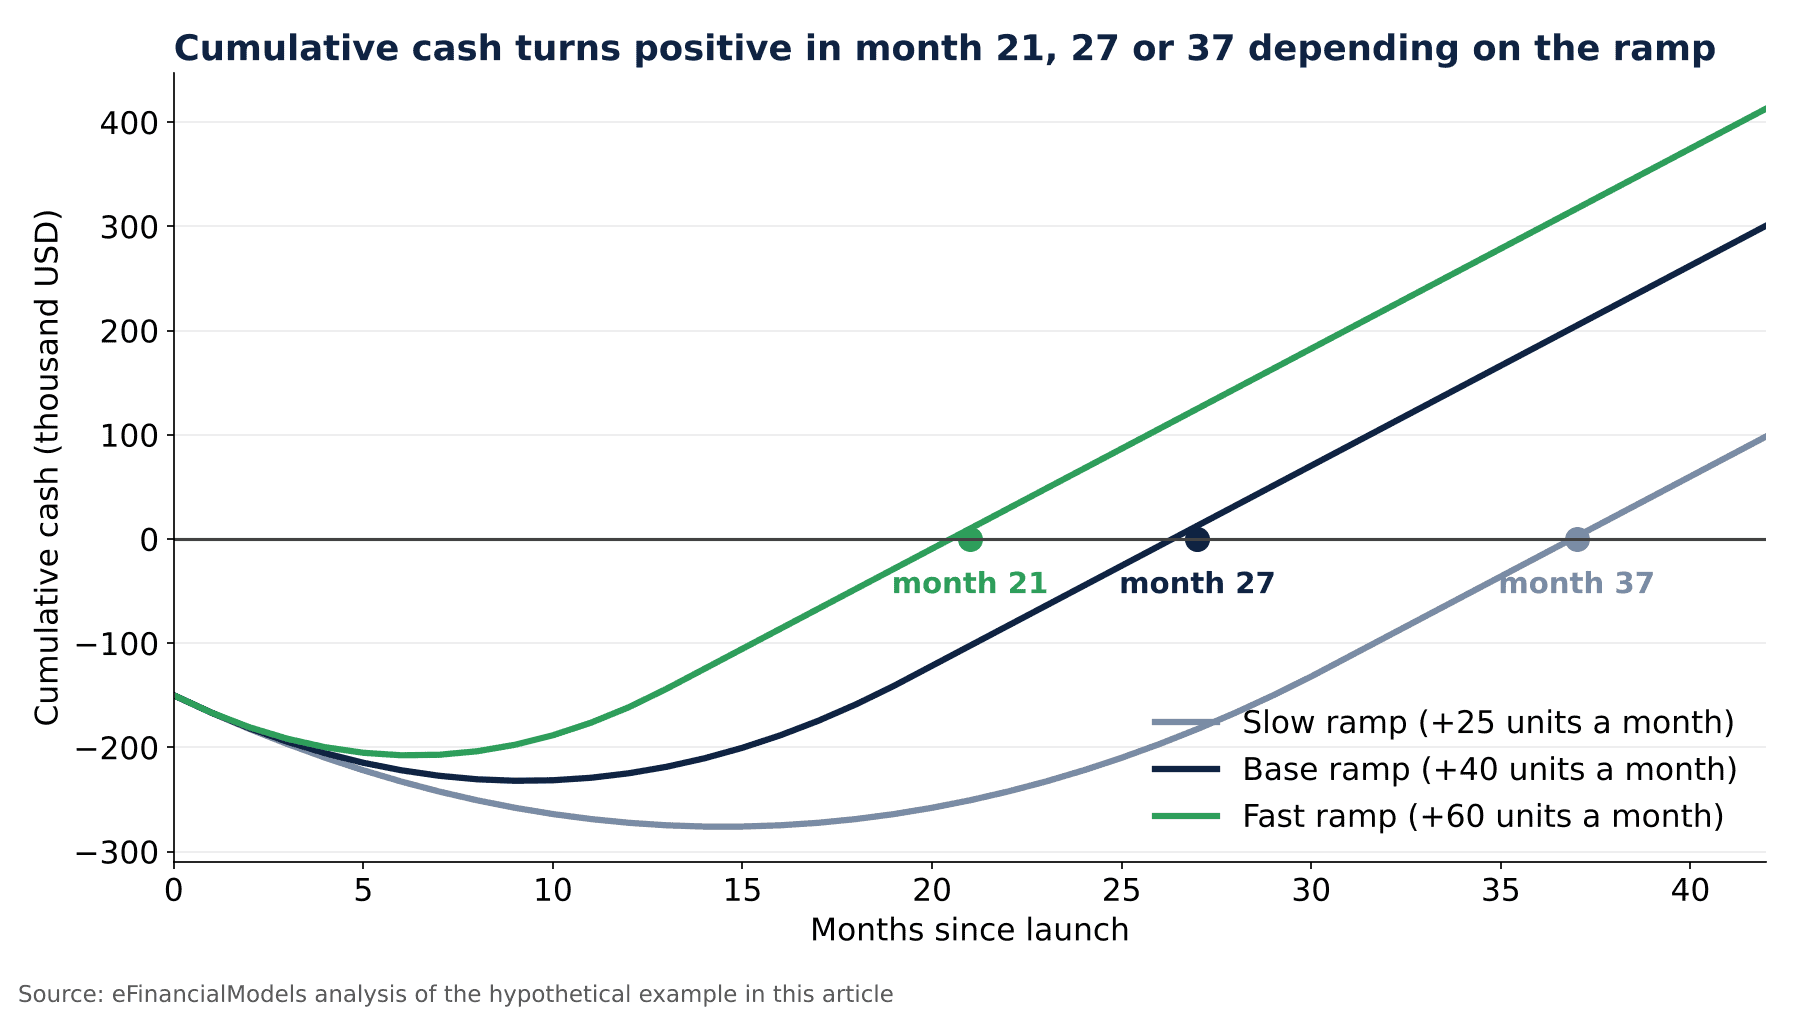
The spread between 21 and 37 months comes from one input, the speed of the ramp. The owner who needs a decision should therefore ask which funding the venture can secure, since the three scenarios need between 207,600 and 276,000 before cash starts to return.
Worked Example: Which Lever Shortens the Wait Most
Changing one input at a time by the same 10 percent in the base scenario shows where management attention pays off. Assume each change below is achieved without altering the unit ramp, which is an illustrative simplification, and note that the ranking holds only for this example.
| Change to the base scenario | Break-even units per month | Cumulative break-even month |
|---|---|---|
| None (base) | 500 | 27 |
| Price up 10 percent, from 80 to 88 | 429 | 22 |
| Monthly fixed costs down 10 percent, to 21,600 | 450 | 24 |
| Variable cost down 10 percent, from 32 to 28.80 | 469 | 24 |
| Launch investment down 10 percent, to 135,000 | 500 | 26 |
The price rise lifts the contribution margin from 48 to 56, so break-even units fall to 24,000 divided by 56, which is 428.6 and rounds up to 429. A price rise saves five months, fixed-cost and variable-cost cuts save three each, and the smaller investment saves one. In practice a higher price can slow the ramp, so the table marks a ceiling for the benefit, not a promise.
Worked Example: The Same Formula in Three Industries
The steps hold across sectors, but the contribution margin ratio, which is the contribution margin divided by the price, changes the shape of the problem. Assume the following hypothetical businesses, each with a different cost structure.
| Business | Price | Variable cost | Fixed costs per month | Break-even units per month | Break-even revenue per month | Operating break-even month |
|---|---|---|---|---|---|---|
| Subscription software | 100 | 15 | 42,500 | 500 | 50,000 | 9 |
| Neighbourhood café | 12 | 4.20 | 19,500 | 2,500 | 30,000 | 10 |
| Light manufacturer | 25 | 15 | 30,000 | 3,000 | 75,000 | 9 |
Software has a contribution margin ratio of 85 percent, the café 65 percent and the manufacturer 40 percent, so the manufacturer needs far more units for each dollar of fixed cost. The software case treats subscriptions as monthly paying units and ignores churn, which is the share of subscribers who cancel. The months assume first-month sales and monthly growth of 100 and 50 subscriptions, 1,200 and 150 orders, and 1,000 and 250 units respectively. Each result is an operating break-even month, so the launch investment would push the cumulative break-even month later in every case.
What the Calculation Leaves Out
The method treats profit as cash. Customers who pay late, stock bought ahead of sales and loan repayments all change the real cash position, and income tax is ignored. Costs also rise in steps, as when a second shift or a larger site is needed, which makes the fixed-cost line less flat than the example assumes. Owners should therefore build monthly cash flow projections next to the break-even table and review them against actual sales every month. The sources cited are U.S. statistics and guidance, so owners elsewhere should check local data, and an accountant should review any plan that relies on borrowed money.
Frequently Asked Questions
What is a good break-even time for a new venture?
No single number fits every business, because a software subscription and a manufacturing plant carry very different cost structures. A more useful test compares the cumulative break-even month with the number of months the venture can fund itself. If the forecast break-even falls beyond the funded period, the owner has to raise more money, cut costs or slow the spending before launch, not after the cash has run out.
How does break-even time differ from the payback period?
The payback period measures how long cash flows take to repay an investment, and the cumulative break-even month in this guide is a payback calculation on cumulative cash, with operating profit treated as cash. The distinction matters for what is counted. Break-even time, as used here, starts from launch and includes the early losses, whereas a simple payback figure can start from a steady yearly cash flow and hide the ramp-up months.
Should the calculation use units or revenue?
Units suit businesses with one clear product, since the formula divides fixed costs by a per-unit margin. Businesses with many products can use revenue instead by dividing fixed costs by the contribution margin ratio, which gives the revenue needed per month. The two answers agree when the product mix stays constant, so an owner who changes the mix should recalculate the ratio from the new weighted average.
How often should the forecast be updated?
Monthly is the sensible rhythm for a venture still inside its ramp. Each month the owner replaces the forecast units with actual sales, recalculates fixed and variable costs from the accounts and reruns the cumulative cash row. A forecast that drifts several months from the real break-even date is the earliest warning that the growth assumption is wrong, and it leaves time to react.
Conclusion
Break-even time depends on the cost structure and on how fast sales ramp, and the peak funding need that comes with it matters as much as the month itself. Owners who want to test their own launch inputs can start from the eFinancialModels Payback Period Calculator, a template for estimating how long it takes to recover an investment, before committing capital.