
0 ITEMS

Agricultural Bank Financial Model Excel Template
The Agricultural Bank Financial Model is a ready-to-use financial model template built to help founders, business owners, consultants, analysts, and planning teams evaluate the financial feasibility of launching or expanding an agricultural banking institution. It gives users a structured way to forecast loan-driven revenue, interest income, non-interest income, startup costs, operating expenses, payroll, cash flow, profitability, and capital needs in one organized workbook. Instead of building a complex banking forecast from scratch, users can begin with a pre-built framework designed around the financial drivers that matter most for an agricultural bank, including loan portfolio growth, interest spreads, funding sources, staffing, infrastructure, and long-term financial performance. This template is especially useful for entrepreneurs preparing a business plan, financial analysts building projections, consultants supporting client engagements, and founders preparing funding documents for lenders, investors, regulators, or internal stakeholders. The model helps translate strategic assumptions into clear financial outputs, including profit and loss forecasts, cash flow projections, balance sheet planning, and performance metrics. Users can edit the assumptions to reflect their own market, target rural customer base, agricultural lending strategy, deposit mix, pricing, cost structure, and growth expectations. The Agricultural Bank Financial Model supports practical financial planning by connecting revenue assumptions with the costs required to operate a professional financial institution. It helps estimate initial capital requirements, core banking system setup, branch build-out, IT infrastructure, staffing costs, compliance functions, and recurring operating expenses. The template also supports payroll planning, helping users evaluate the team needed to manage lending, credit risk, operations, customer service, compliance, and leadership responsibilities as the loan portfolio grows. Beyond basic forecasting, the model helps users evaluate cash flow, profitability, break-even timing, repayment outlook, and decision-making under different scenarios. It includes structured outputs that can support investor discussions, lender reviews, management planning, and board presentations. By organizing assumptions, financial statements, charts, KPIs, and bank-ready reports in one editable file, this agricultural bank financial model template gives users a more confident way to test viability, compare scenarios, refine funding needs, and prepare a professional financial plan.
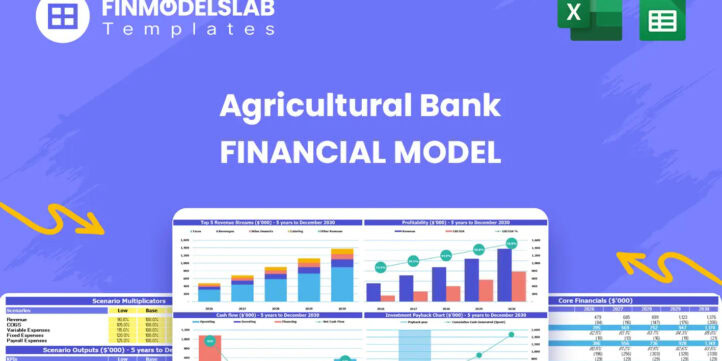


Agricultural Bank Financial Model Overview
The Agricultural Bank Financial Model is a practical financial model template designed for planning, launching, funding, or expanding an agricultural banking institution. It helps users convert a rural finance strategy into a structured forecast by linking loan portfolio growth, interest income, funding costs, operating expenses, payroll, startup investment, cash flow, profitability, and banking performance metrics.
For an agricultural bank, financial planning is more complex than a standard business forecast because revenue depends heavily on the mix of farm real estate loans, equipment financing, crop input loans, operating lines, deposits, investment securities, service fees, credit quality, and interest rate spreads.
This template gives entrepreneurs, consultants, analysts, founders, and business planning teams a ready-made framework for organizing those assumptions and reviewing the outputs that lenders, investors, boards, and stakeholders expect to see. The model is editable, structured, and built to support up to five years of projections, making it useful for feasibility analysis, funding preparation, regulatory discussions, internal planning, and ongoing decision-making.
All-in-One Dashboard
The all-in-one dashboard brings the most important inputs and outputs into one central view so users can quickly understand the overall financial position of the agricultural bank. This section typically consolidates core assumptions such as loan growth, interest yields, deposit funding, operating expense levels, staffing costs, capital investment, and timing assumptions, then connects them to key outputs such as revenue, EBITDA, net income, cash position, profitability, return measures, and funding requirements.
For a banking model, this is especially useful because decision-makers need to see how loan portfolio growth, net interest income, and operating costs work together rather than reviewing each item separately. The dashboard helps users avoid disconnected planning by showing whether the assumptions produce a viable financial result. It is valuable for management reviews, investor conversations, lender discussions, and founder decision-making because it provides a clear snapshot of the bank’s projected performance without requiring users to search through every worksheet in the model.
Low, Base, and High Scenario Analysis
The low, base, and high scenario analysis section helps users evaluate how the Agricultural Bank Financial Model performs under different operating conditions. Instead of relying on one fixed forecast, users can compare conservative, expected, and optimistic cases by adjusting assumptions such as loan origination volume, interest yield, deposit growth, funding cost, fee income, operating expenses, staffing expansion, and credit-related risk factors.
This is important for an agricultural bank because market conditions can change based on crop cycles, commodity pricing, rural economic activity, regulatory expectations, and interest rate movements. The scenario structure helps users understand the potential upside and downside of the business plan before committing capital or presenting projections to stakeholders.
It also supports more credible funding discussions because investors and lenders often want to know how the business performs if growth is slower, margins are tighter, or costs are higher than expected. By comparing scenarios, users can refine strategy, stress test assumptions, and prepare more realistic plans for capital, liquidity, hiring, and profitability.
Professional Charts
The professional charts section translates the financial model’s outputs into clean visual reports that are easier to interpret and present. These charts may show trends in revenue, net interest income, cash flow, loan portfolio growth, EBITDA, profitability, expenses, capital requirements, and other banking metrics over the forecast period. For an agricultural bank, visuals are useful because many important trends develop gradually over time, such as the scaling of the loan book, improvement in operating leverage, changes in cash reserves, and movement toward profitability.
Rather than presenting only rows of numbers, the charts help users communicate the financial story clearly to investors, lenders, directors, advisors, and internal teams. They are also helpful for identifying patterns, such as whether revenue growth is outpacing payroll and overhead, whether cash balances remain adequate, and whether profitability improves as the bank reaches scale. This component supports stakeholder presentations, monthly planning meetings, funding packages, and business plan documentation by making complex financial information more accessible and decision-ready.
ROE Components and DuPont Analysis
The ROE components and DuPont analysis section helps users understand what drives return on equity in the agricultural banking business. Return on equity is a key measure for a bank because it shows how effectively the institution uses its capital base to generate profit.
The DuPont-style view breaks this performance into underlying drivers, which may include profitability margins, asset utilization, leverage, cost structure, and balance sheet efficiency. In an agricultural bank financial model, this section can help users see whether ROE is improving because of stronger net interest income, better expense control, higher earning asset growth, more efficient capital deployment, or improved non-interest income.
This is valuable for planning because it moves the analysis beyond a simple profit number and explains why performance changes over time. Founders and analysts can use the section to assess whether the bank’s projected returns are healthy enough to justify the initial capital investment and whether strategic adjustments are needed. It also strengthens investor and board discussions by showing the financial mechanics behind long-term shareholder returns.
Revenue Inputs
The revenue inputs section is where users define the key assumptions that drive income for the agricultural bank. This component may include inputs for farm real estate loans, agricultural equipment loans, crop input loans, operating lines of credit, investment securities, deposit-related assumptions, service fees, advisory income, wealth management income, and other interest-earning assets.
Users can adjust loan volumes, growth rates, yields, interest spreads, fee percentages, and timing assumptions to match their target market and strategy. This is one of the most important parts of the model because banking revenue is highly dependent on both portfolio size and margin quality. The section helps users estimate net interest income by connecting earning assets with funding sources and interest costs, while also allowing for non-interest income planning.
It is useful for testing whether the bank can generate enough revenue to cover payroll, compliance, technology, facilities, marketing, and other operating expenses. By making revenue drivers explicit and editable, the model helps users build a forecast that is more transparent, defensible, and aligned with the realities of agricultural lending.
Bank-Ready Reports
The bank-ready reports section organizes the core financial outputs into a format that lenders, investors, boards, and other stakeholders can review efficiently. These reports may include projected profit and loss statements, cash flow statements, balance sheets, repayment outlook, capital planning summaries, revenue forecasts, expense forecasts, and key profitability indicators.
For an agricultural bank, these outputs are important because stakeholders typically want to evaluate whether the institution can generate stable income, manage liquidity, maintain adequate reserves, cover operating expenses, and support growth without creating unnecessary financial strain.
The reports help users present a professional financial case instead of submitting unstructured calculations or disconnected assumptions. They are also useful for business planning because they bring together the operational and financial effects of lending volume, deposit funding, payroll, startup costs, operating costs, and financing activity. This section supports due diligence, loan discussions, investor presentations, internal approvals, and strategic reviews by giving users polished outputs that communicate the financial plan clearly and consistently.
Revenue Breakdown
The revenue breakdown section provides a more detailed view of how total revenue is generated across the agricultural bank’s income streams. Rather than treating revenue as a single line item, this component separates interest income from different loan categories, yields from securities or other earning assets, and non-interest income from services such as fees, advisory services, account-related charges, or wealth management activities.
This is useful because the quality and risk profile of revenue can vary significantly by source. Farm real estate lending may produce different margins and growth patterns than equipment loans or operating lines, while fee-based income may help diversify earnings beyond the interest spread.
Users can review which revenue streams contribute most to total income, which segments support profitability, and where strategic focus may be needed. The breakdown also helps with planning product mix, pricing, staffing, marketing priorities, and capital allocation. For investors and lenders, this level of detail makes the revenue forecast more credible because it shows the specific business activities expected to produce income rather than relying on broad, unexplained assumptions.
KPI Dashboard
The KPI dashboard section tracks performance metrics and benchmarks that are especially relevant for an agricultural bank. This may include return on equity, net interest margin, efficiency ratios, revenue growth, EBITDA, cash position, payback period, loan portfolio growth, expense ratios, profitability measures, and other key indicators used to evaluate financial institution performance. A KPI dashboard is valuable because it turns the model from a simple forecast into a management tool.
Users can compare projected results against targets, identify areas that need improvement, and monitor whether the business plan supports a sustainable financial position. For example, if the net interest margin is too low, users may need to revisit loan pricing, funding costs, or portfolio mix. If the efficiency ratio is weak, they may need to review staffing levels, technology costs, or branch overhead.
This section also helps with stakeholder communication because KPIs provide a concise way to explain financial health. It supports investor reporting, board updates, internal planning, and strategic decision-making by focusing attention on the metrics that matter most.
Startup and Operating Cost Planning
The startup and operating cost planning section helps users estimate both the initial investment required to launch the agricultural bank and the recurring expenses needed to operate it. Startup costs may include branch build-out, core banking system implementation, IT infrastructure, network setup, office furniture, security systems, licensing, professional services, regulatory preparation, marketing, and working capital.
Operating expenses may include salaries, benefits, rent, utilities, insurance, compliance costs, technology subscriptions, marketing, data services, audit fees, legal support, and administrative overhead. This component is useful because underestimating costs can create capital shortages, delay launch plans, or weaken the financial case presented to lenders and investors.
By separating one-time costs from ongoing expenses, users can better understand how much funding is needed before operations begin and how monthly cash requirements may evolve as the bank grows. It also supports budgeting discipline by making cost assumptions transparent and editable. For founders, consultants, and analysts, this section provides a practical foundation for capital planning, expense control, and realistic launch preparation.
Break-Even and Payback Analysis
The break-even and payback analysis section helps users understand when the agricultural bank may become profitable and how long it may take to recover the initial investment. This component uses assumptions from the revenue forecast, interest income, funding costs, operating expenses, payroll, startup costs, and cash flow projections to estimate the point where the business covers its costs and begins generating sustainable profit.
For an agricultural bank, break-even analysis is especially important because early-stage performance often depends on how quickly the loan portfolio grows, how efficiently deposits or other funding sources are secured, and how well management controls overhead while building customer relationships.
The payback view helps users evaluate whether the projected return timeline is acceptable for founders, investors, or sponsors. This section is useful for decision-making because it highlights the assumptions that have the greatest effect on profitability, such as lending volume, net interest margin, staffing pace, and expense levels. It also helps users prepare stronger funding discussions by showing a clear path from initial capital investment to operating profitability and long-term financial viability.
File types:
Excel – Single-User: .xlsx
Excel – Multi-User: .xlsx
Similar ProductsOther customers were also interested in...


 HenrySheykin
Online Bank Financial Model Excel Template
The Online Bank Financial Model Financial Model Template helps founders, fintech entrepreneurs, cons... Read more
Cattle Farming Financial Model Excel Template
The Cattle Farming Financial Model helps users turn a cattle farm concept, expansion plan, or fundin... Read more
Hydroponics Financial Model Excel Template
The Hydroponic Farming Financial Model helps entrepreneurs, growers, consultants, analysts, and busi... Read more

Bank Financial Model Excel Template
The Bank Financial Model Financial Model Template helps founders, banking entrepreneurs, consultants... Read more
Law Firm Financial Model Excel Template
The Law Firm Financial Model Template helps users turn a legal practice concept into a structured fi... Read more
Hemp Farming Financial Model Excel Template
The Hemp Farming Financial Model Template helps entrepreneurs, farm owners, consultants, analysts, a... Read more

Dairy Farming Financial Model Excel Template
Purchase Dairy Farming Financial Projection. Sources & Uses, Profit & Loss, Cash Flow statem... Read more
Business Brokerage Financial Model Excel Template
The Business Brokerage Financial Model helps entrepreneurs, brokerage owners, consultants, analysts,... Read more
Aquaponics Financial Model Excel Template
The Commercial Aquaponics Financial Model helps users turn a capital-intensive aquaponics concept in... Read more
Sheep Farming Financial Model Excel Template
The Sheep Farming Financial Model helps entrepreneurs, farm owners, consultants, analysts, and busin... Read more
You must log in to submit a review.