
0 ITEMS

Online Clothing Store Financial Model Excel Template
The Online Clothing Store Financial Model helps founders, entrepreneurs, business owners, consultants, and analysts turn an apparel e-commerce idea into a structured financial forecast. Instead of relying on rough estimates, users can organize revenue assumptions, startup costs, operating expenses, payroll, product margins, marketing spend, cash flow, and profitability in one ready-to-use planning file. The template is designed for online boutiques, digital fashion brands, niche apparel stores, direct-to-consumer clothing startups, and existing retailers planning to expand online. This financial model template supports business planning, funding preparation, lender discussions, investor presentations, and internal decision-making. It gives users a practical way to estimate how customer acquisition, repeat purchases, pricing, product categories, cost of goods sold, fulfillment costs, and marketing budgets may affect long-term performance. By connecting revenue drivers with expenses and cash flow, the model helps users understand whether the store can grow sustainably, how much capital may be required, and when the business may move toward profitability. The template is fully editable, so users can adjust assumptions to reflect their own pricing strategy, sales channels, staffing plan, supplier costs, inventory approach, advertising budget, and growth expectations. It is useful for preparing a business plan, comparing scenarios, testing different revenue assumptions, evaluating break-even analysis, and reviewing the impact of changes in customer acquisition cost or repeat purchase behavior. The structure is built to save time while still giving users control over the details that matter most for an online clothing business. With five-year projections, financial statements, dashboards, charts, KPI tracking, scenario analysis, and investor-ready outputs, the Online Clothing Store Financial Model provides a clear framework for decision-making. It helps users move beyond a simple sales forecast and build a more complete view of cash needs, profit potential, funding requirements, and operating performance. Whether launching a new brand, refining an existing e-commerce store, or preparing documents for stakeholders, this template gives users a practical foundation for planning and presenting the financial side of the business.
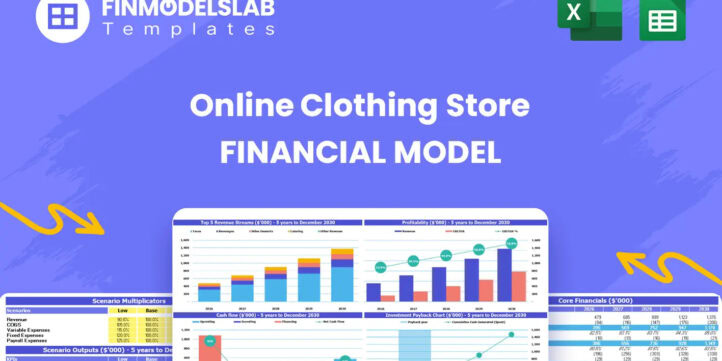


Financial Model Overview
The Online Clothing Store Financial Model is a ready-to-use financial model template built for entrepreneurs, apparel e-commerce founders, boutique owners, consultants, analysts, and business planners who need to evaluate the financial potential of selling clothing online. It brings together the main drivers of an online retail business, including customer acquisition, repeat orders, product category sales, pricing, cost of goods sold, marketing spend, payroll, operating expenses, cash flow, profitability, and funding needs. For an online clothing store, financial planning is especially important because revenue growth often depends on paid marketing, inventory decisions, supplier pricing, website performance, customer retention, and fulfillment efficiency. This template gives users a structured way to connect these assumptions and see how they affect the business over time. Instead of building formulas and financial statements from scratch, users can work from a professionally formatted model that is editable, presentation-ready, and suitable for business plans, investor discussions, lender reviews, internal budgeting, and strategic decision-making. The model is designed to help users answer practical questions, such as how much capital is needed to launch, how quickly revenue may scale, what margins are required to become profitable, when cash flow pressure may appear, and which assumptions have the greatest impact on overall performance.
All-in-One Dashboard
The all-in-one dashboard gives users a central view of the Online Clothing Store Financial Model by combining core inputs and core outputs in one organized area. This component is useful because founders and managers need a fast way to understand the business without searching through every calculation tab or financial statement. The dashboard may include key assumptions such as revenue growth, customer acquisition cost, marketing budget, repeat purchase rate, average order value, gross margin, payroll, startup costs, and operating expenses. It then translates those assumptions into high-level outputs such as projected revenue, gross profit, EBITDA, net income, cash balance, funding requirements, and return metrics. For an online clothing store, this is especially valuable because small changes in customer acquisition cost, product margin, shipping cost, or repeat order behavior can significantly affect profitability. The dashboard helps users review the overall financial picture, identify whether the plan is realistic, and communicate the forecast clearly to investors, lenders, partners, or internal team members. It also supports faster decision-making by showing how the business model responds when assumptions are updated, making it easier to compare growth plans, budget priorities, and operational targets.
Low, Base, and High Scenario Analysis
The low, base, and high scenario analysis section allows users to test how different assumptions affect the forecast under conservative, expected, and optimistic cases. This component is important for an online clothing store because performance can vary depending on market conditions, advertising efficiency, product demand, customer retention, supplier costs, inventory availability, and conversion rates. In the low case, users can model slower customer acquisition, higher marketing costs, lower repeat purchase rates, weaker margins, or delayed revenue growth. In the base case, users can present the most realistic plan based on researched assumptions and current expectations. In the high case, users can test stronger customer growth, better customer acquisition cost, higher average order value, improved product margins, or faster repeat purchase behavior. The outputs help users compare revenue, profitability, cash flow, capital needs, and return metrics across different outcomes. This is useful for risk management, funding preparation, and strategic planning because it shows what may happen if the business performs below, at, or above expectations. Investors and lenders often want to know whether a plan can withstand pressure, and this section helps users demonstrate that they have considered both upside potential and downside risk before making financial commitments.
Professional Charts
The professional charts component converts financial projections into clear visual reports that are easier to interpret and present. While detailed financial statements are necessary, charts help users quickly understand trends, relationships, and turning points within the Online Clothing Store Financial Model. This section may visualize revenue growth, gross profit, EBITDA, net income, cash balance, customer acquisition trends, marketing spend, operating expenses, product category performance, or scenario comparisons. For an online clothing store, charts are particularly useful for showing the expected growth curve as marketing investment increases, repeat customers accumulate, margins improve, and fixed costs become more efficient relative to revenue. These visuals help users communicate complex financial information in a format that is easier for investors, lenders, partners, and management teams to absorb. They can also support business plan presentations and pitch decks by showing how the store is expected to scale over time. The value of this component is not only presentation quality, but also decision support. By seeing financial data visually, users can identify patterns such as rising expense pressure, margin improvement, seasonal cash constraints, or the point where profitability begins to accelerate. This makes the model more practical for both planning and stakeholder communication.
ROE Components and DuPont Analysis
The ROE components and DuPont analysis section helps users understand the drivers behind return on equity rather than looking only at a single profitability percentage. This component breaks down return on equity into underlying performance factors, often including profitability, asset efficiency, and leverage. For an online clothing store, this is useful because shareholder returns may be influenced by product margins, marketing efficiency, inventory management, operating cost control, and the amount of external funding used to support growth. Inputs may include net income, revenue, assets, equity, debt, and related balance sheet assumptions. The outputs help users see whether improvements in return are coming from stronger margins, better use of assets, or changes in financing structure. This is especially relevant when preparing for investor conversations, because investors often want to understand not just whether the company becomes profitable, but how efficiently it generates returns on the capital invested. DuPont analysis can also help management identify areas for improvement. If returns are weak because margins are low, the business may need to improve pricing, supplier terms, or product mix. If asset efficiency is low, the company may need to manage inventory more carefully. If leverage is excessive, the funding structure may need to be reviewed. This section adds depth to the financial analysis and supports more informed decision-making.
Revenue Inputs
The revenue inputs section is one of the most important parts of the Online Clothing Store Financial Model because it defines the assumptions that drive sales projections. For an online clothing business, revenue is usually shaped by customer acquisition, advertising budget, customer acquisition cost, conversion behavior, average order value, repeat purchase rate, order frequency, product category mix, and pricing. This component allows users to enter or adjust these assumptions so the forecast reflects their own business strategy. A founder can model new customer first-time purchases, returning customer orders, and sales across different clothing categories such as apparel basics, seasonal collections, accessories, premium items, or other product lines. The model may also account for changes over time, such as declining customer acquisition cost as the brand becomes more efficient, higher repeat purchase rates as loyalty improves, or increasing average order value as product mix expands. The outputs from this section flow into revenue projections, gross profit, cash flow, and financial statements. This is useful because revenue forecasting for an online store must be connected to measurable drivers rather than unsupported growth percentages. By building the forecast around practical assumptions, users can create a more credible plan, test marketing budgets, evaluate sales targets, and understand how much customer volume is needed to support operating costs and profitability.
Bank-Ready Reports
The bank-ready reports section provides professionally structured financial outputs that can be used for lender reviews, investor discussions, business planning, and internal reporting. This component typically includes the key financial statements expected by financial stakeholders, such as the income statement, cash flow statement, and balance sheet. For an online clothing store, these reports help demonstrate whether the business can generate sufficient revenue, maintain healthy margins, manage expenses, fund inventory and operations, and repay potential financing. Inputs from the revenue model, cost assumptions, payroll, capital expenditures, working capital, and financing structure flow into these statements automatically. The income statement helps users review sales, cost of goods sold, gross profit, operating expenses, EBITDA, and net income. The cash flow statement helps identify liquidity needs, operating cash generation, investment outflows, and financing activity. The balance sheet provides a view of assets, liabilities, and equity over time. This section is useful because lenders and investors often require more than a summary forecast; they need a complete view of financial performance and financial position. Bank-ready reports also help business owners prepare for questions about profitability, debt service capacity, cash reserves, and capital requirements. With these outputs in place, users can present a more organized and credible financial plan.
Revenue Breakdown
The revenue breakdown section gives users a detailed view of how total revenue is built across different revenue streams, customer groups, or product categories. For an online clothing store, this component is valuable because total sales are rarely driven by one single source. Revenue may come from first-time customer purchases, repeat customer orders, multiple apparel categories, seasonal product launches, promotions, accessories, premium collections, or other store-specific segments. This section helps users separate these streams so they can evaluate which parts of the business contribute the most to growth and profitability. Inputs may include product pricing, expected order volume, average order value, purchase frequency, customer retention assumptions, and category-level sales mix. Outputs may include monthly or annual revenue by stream, percentage contribution by category, growth trends, and total revenue projections. The value of this component is that it gives management a clearer understanding of where sales are coming from and which areas deserve more focus. If one product category delivers strong margins but lower volume, the business may invest in marketing or merchandising to grow it. If repeat orders are becoming a larger share of revenue, the company may prioritize loyalty programs, email marketing, and customer experience. This detailed revenue view supports pricing decisions, inventory planning, marketing allocation, and strategic growth decisions.
KPI Dashboard
The KPI dashboard tracks the performance metrics that matter most for an online clothing store and makes them easier to monitor over the forecast period. While financial statements show overall performance, KPIs help users understand the operational drivers behind the numbers. This component may include metrics such as revenue growth, gross margin, average order value, customer acquisition cost, repeat purchase rate, customer lifetime value, EBITDA margin, cash balance, payback period, return on equity, and other e-commerce performance indicators. Inputs are drawn from the revenue assumptions, cost structure, marketing plan, customer behavior, and financial statements. The outputs help users compare performance against targets, identify potential issues, and evaluate whether the business is moving toward sustainable profitability. For example, if revenue grows but customer acquisition cost remains too high, the KPI dashboard can highlight pressure on margins and cash flow. If repeat purchase rates improve, users can see the benefit through higher customer lifetime value and stronger profitability. This section is useful for founders, analysts, and consultants because it turns the model into a management tool rather than only a funding document. It also supports stakeholder reporting by presenting key metrics in a clear, organized format that helps explain the health and direction of the business.
Startup Costs and Initial Capital Planning
The startup costs and initial capital planning section helps users estimate how much money is required before the online clothing store can operate effectively. For an apparel e-commerce business, launch costs can include website development, platform setup, branding, product photography, initial inventory, packaging, office equipment, software, legal setup, business registration, pre-launch marketing, supplier deposits, and working capital reserves. This component allows users to organize one-time costs separately from ongoing operating expenses, which is important for understanding the true funding requirement. Inputs may include estimated setup costs by category, timing of payments, initial capital expenditures, deposits, and any pre-opening expenses needed to prepare the business for launch. Outputs may include total startup investment, required funding before revenue begins, cash balance impact, and the amount of capital needed to cover early operating losses. This section is useful because many online clothing startups underestimate how much cash is needed to build a functional store, create content, purchase inventory, acquire customers, and sustain operations until sales volume becomes consistent. By mapping startup costs clearly, users can prepare more accurate funding requests, avoid early cash shortages, and make better decisions about what to prioritize before launch. It also helps investors and lenders understand how requested capital will be used.
Break-Even Analysis
The break-even analysis section helps users identify when the online clothing store is expected to cover its costs and begin generating true profit.
Similar ProductsOther customers were also interested in...



 Giorgos
Online Clothing Wholesaler – 5 Year Financia...
Advanced Financial Model presenting a 5 Year Business Plan for an Online Clothing Wholesale company.... Read more
 HenrySheykin
Fashion Marketplace Financial Model Excel Template
The Fashion Retail Financial Model helps entrepreneurs, founders, business owners, consultants, and ... Read more
Etsy & Ebay Store Financial Model Excel Templa...
The Etsy and eBay Store Financial Model helps marketplace sellers, founders, consultants, and busine... Read more

 JILL LIU
Ultra Fashion Revenue and DCF Valuation Model
In this model, we presented a completed revenue and DCF valuation model for an Ultra-Fashion project... Read more

 Andreas
Online Shop Financial Model
Online Shop Financial Model presents the business case of a brand new start up Online Shop with an u... Read more
 anthony
Bundle – Business Financial Forecasting Mode...
The purpose of this Bundle of Business Forecasting and Financial Models is to assist Business Owners... Read more
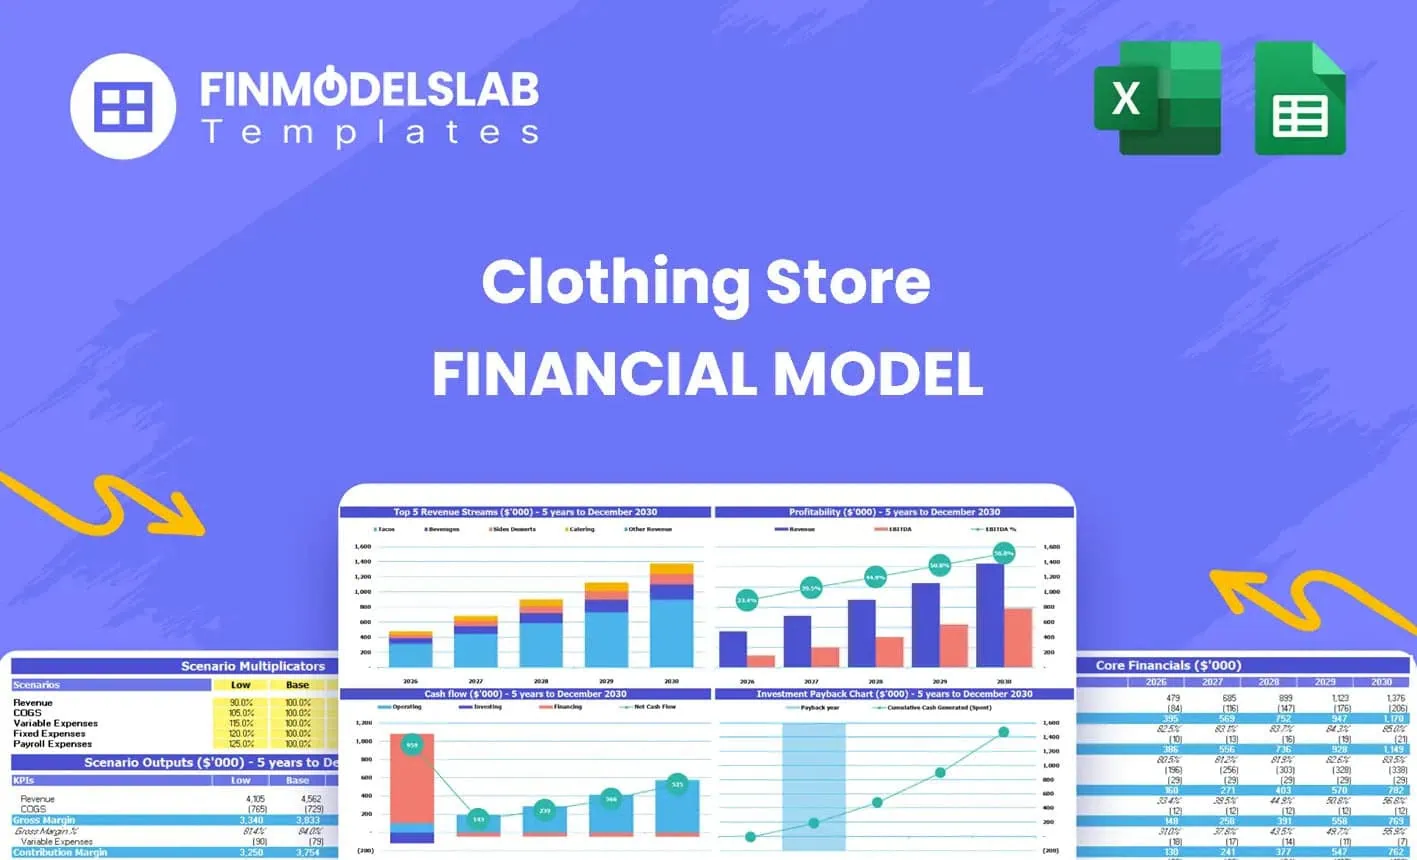
Clothing Store Financial Model Excel Template
The Clothing Store Financial Model helps turn a retail apparel concept into a structured financial f... Read more
Fresh Flowers Subscription Financial Model Excel T...
The Subscription Box Financial Model Template helps entrepreneurs, founders, analysts, consultants, ... Read more
You must log in to submit a review.