
0 ITEMS

Food Truck Financial Model Excel Template
The Food Truck Financial Model helps entrepreneurs, founders, business owners, consultants, and analysts turn a mobile food business idea into a structured financial forecast. Instead of building a complex spreadsheet from scratch, users can start with a ready-to-use model designed around the practical realities of running a food truck, including customer traffic, average order values, menu sales mix, startup investment, food costs, staffing, operating expenses, cash flow, and profitability. The template is fully editable, so assumptions can be adjusted to match a specific concept, city, cuisine, event strategy, catering plan, pricing approach, or growth target. This financial model template is built for business planning, funding preparation, internal budgeting, and decision-making. It helps users estimate how much capital may be required to launch, how revenue may develop over time, and how expenses could affect margins month by month and year by year. By connecting revenue assumptions with costs, payroll, working capital, and profitability, the model gives a clearer view of whether the business can support its investment, cover ongoing obligations, and move toward sustainable profit. The template is useful for anyone preparing a food truck business plan, investor presentation, loan application, or operational budget. It supports key planning questions such as how many customers need to be served each day, what average order value is required, how food and labor costs affect gross margin, when the business may reach break-even, and how much cash should be available during early operating months. Users can test low, base, and high scenarios to understand the impact of slower sales, stronger event bookings, higher pricing, or changes in expenses before making commitments. With automated calculations, professional formatting, dashboard views, charts, investor-ready reports, and editable assumptions, the Food Truck Financial Model provides a practical foundation for forecasting and communicating the economics of a mobile food business. It helps users organize startup costs, operating expenses, payroll, revenue streams, cash flow, profitability, break-even analysis, and performance metrics in one place, making it easier to evaluate opportunities, reduce planning uncertainty, and make more informed business decisions.


Food Truck Financial Model Overview
The Food Truck Financial Model is a ready-to-use financial model template designed to help entrepreneurs, operators, consultants, analysts, and business plan writers evaluate the financial potential of a mobile food business. A food truck has a unique cost structure compared with a traditional restaurant, with revenue driven by daily covers, event attendance, catering opportunities, ticket size, menu mix, location strategy, and operating days, while expenses depend on food costs, labor, fuel, commissary rent, insurance, permits, maintenance, payment processing, and seasonal demand. This template brings those assumptions into a structured forecasting model so users can estimate revenue, startup investment, operating expenses, cash flow, profitability, funding needs, and long-term performance. It is built to support business planning, investor discussions, bank submissions, internal budgeting, and strategic decision-making. Because the model is editable, users can adapt it to a breakfast truck, brunch concept, dinner-focused mobile kitchen, dessert truck, beverage cart, catering-focused food truck, or multi-location mobile food operation. The goal is to replace guesswork with a clear financial planning framework that shows how the food truck may perform under realistic assumptions before launch, expansion, or fundraising.
All-in-One Dashboard
The all-in-one dashboard gives users a central place to review the most important inputs and outputs of the Food Truck Financial Model. It is designed to connect the assumptions that drive the business, such as customer volume, average order value, revenue mix, cost levels, payroll, startup investment, and operating structure, with the financial outputs that matter most to owners, lenders, and investors. Instead of searching through multiple tabs to understand the model, users can quickly review projected revenue, expenses, profit, cash position, funding requirements, payback timing, and other headline metrics in one organized view. This is especially useful for a food truck because small changes in customer traffic, menu pricing, event bookings, or food cost percentages can materially change profitability. The dashboard helps users see how the business is expected to perform at a glance while still allowing them to edit the underlying assumptions in detail. For business planning, it provides a practical summary of whether the concept appears financially viable. For funding preparation, it creates a clear view of the financial story behind the business. For day-to-day decision-making, it helps operators focus on the key levers that influence margins, cash flow, and growth.
Low, Base, and High Scenario Analysis
The low, base, and high scenario analysis component helps users evaluate how the food truck may perform under different business conditions. A food truck can be affected by weather, seasonality, event availability, neighborhood foot traffic, catering demand, supplier pricing, staffing constraints, and local competition, so relying on only one forecast can create a false sense of certainty. This section allows users to compare a conservative case, an expected case, and an upside case using different assumptions for revenue, costs, margins, and growth. For example, the low case may reflect slower customer adoption, fewer event bookings, or lower average ticket sizes, while the high case may reflect strong launch demand, premium locations, catering orders, or successful menu pricing. The base case can be used as the main operating plan. By reviewing these scenarios side by side, users can understand the range of possible outcomes and prepare better decisions around funding, hiring, inventory, marketing, and expansion. This is valuable for lenders and investors because it shows that the founder has considered risk rather than presenting only an optimistic forecast. It also helps operators build contingency plans, set realistic targets, and identify which assumptions have the greatest effect on profitability and cash flow.
Professional Charts
The professional charts component turns the financial forecast into clear visual outputs that are easier to interpret and present. Food truck financial projections can include many detailed calculations, but stakeholders often need to understand the direction of the business quickly. Charts help summarize trends in revenue growth, cost behavior, gross profit, EBITDA, net income, cash balance, margins, and other key metrics over time. As users update assumptions, the visuals can reflect the revised financial outlook, making it easier to compare scenarios and communicate changes. This is useful when preparing a pitch deck, business plan appendix, bank loan package, investor update, or internal planning review. For a food truck, charts can help show whether sales build steadily after launch, whether margins improve as volume increases, whether cash remains sufficient during early months, and whether profitability becomes more stable over the forecast period. Visual reports also help non-financial users understand the model without reviewing every formula or worksheet. They provide a more polished way to explain the business case, highlight financial strengths, and identify areas that may require adjustment before committing capital or approaching funding sources.
ROE Components and DuPont Analysis
The ROE components section uses a DuPont-style analysis to help users understand what is driving return on equity rather than simply displaying one final return figure. For food truck founders and investors, return on equity can be influenced by profit margin, asset efficiency, and capital structure, each of which tells a different story about the business. This component helps break performance into more meaningful parts so users can see whether returns are coming from strong margins, efficient use of the truck and equipment, or the way the business is financed. Inputs may include net income, revenue, assets, equity, operating profit, and balance sheet assumptions. Outputs can help users assess how effectively the business turns sales into profit, how productively assets are being used, and whether the equity invested in the venture is generating an acceptable return. This is particularly useful for evaluating a capital-intensive launch where the truck, build-out, kitchen equipment, permits, and initial working capital require upfront investment. By analyzing the components of return, users can identify whether they need to improve pricing, reduce costs, increase sales volume, better utilize the truck schedule, or revisit financing assumptions. It adds an investor-oriented layer to the model and supports more sophisticated decision-making.
Revenue Inputs
The revenue inputs component is where users define the commercial assumptions that drive the food truck forecast. Food truck revenue depends on practical operating variables such as the number of customers served per day, average order value, number of operating days, weekday versus weekend activity, event attendance, catering volume, menu pricing, and the mix of breakfast, brunch, dinner, beverages, desserts, or other revenue categories. This section gives users a structured way to customize these assumptions instead of relying on a single flat sales estimate. For example, a truck that operates near offices during weekdays may have a different traffic pattern than one focused on festivals, nightlife, private catering, or weekend markets. Users can adjust pricing, customer counts, growth rates, and revenue mix to reflect their concept and market. The outputs flow into revenue projections, profitability calculations, cash flow, and investor reports, helping users understand how sales assumptions translate into financial performance. This component is especially useful because revenue is one of the most sensitive areas of a food truck business plan. By modeling revenue from the ground up, users can test whether their planned locations, menu pricing, and service capacity can generate enough sales to cover food costs, labor, overhead, debt service, and owner returns.
Bank-Ready Reports
The bank-ready reports component provides professionally formatted financial outputs that can support lender discussions, funding applications, investor reviews, and formal business planning. A lender or investor typically wants more than a simple revenue estimate; they want to see clear financial statements and a logical connection between assumptions, operations, profitability, and repayment capacity. This section helps generate outputs such as profit and loss summaries, cash flow forecasts, balance sheet views, and supporting financial metrics in a clean format. For a food truck, these reports can show how sales are expected to cover food costs, payroll, rent, insurance, fuel, maintenance, permits, marketing, and financing obligations over time. They can also help demonstrate whether the business has enough cash cushion during launch and whether profitability improves as operations mature. The value of this component is not only presentation quality but also credibility. A structured set of reports makes it easier for stakeholders to review the plan, compare assumptions, ask informed questions, and understand the funding request. For founders, these reports reduce the time needed to prepare financial documents from scratch and help ensure the business plan includes the financial outputs that banks and investors commonly expect.
Revenue Breakdown
The revenue breakdown component provides a more detailed view of how total sales are generated across the food truck’s revenue streams. Rather than treating the business as one undifferentiated sales line, this section can separate categories such as breakfast, brunch, dinner, beverages, desserts, event sales, catering orders, or other menu groups depending on how the user customizes the model. This is important because different revenue streams can have different price points, margins, volumes, seasonality, and growth potential. A beverage or dessert item may carry a different gross margin than a full meal, while catering may produce higher order values but require different labor and preparation. By breaking down revenue, users can evaluate which sales categories contribute most to the business and which may need more marketing, pricing adjustments, or operational support. The inputs may include sales mix percentages, average order values, customer counts, product categories, and growth assumptions. The outputs help users understand total revenue composition, identify high-margin opportunities, and assess whether the concept is too dependent on one type of sale. For planning and decision-making, this component supports menu strategy, staffing decisions, inventory purchasing, event selection, and pricing discussions, all of which are central to food truck profitability.
KPI Dashboard
The KPI dashboard component helps users track performance metrics that matter for a food truck business and compare them against planning targets or benchmark expectations. Key performance indicators may include revenue, gross margin, food cost percentage, labor cost percentage, EBITDA, net profit margin, cash balance, average order value, customer volume, break-even progress, return metrics, and payback timing. These metrics provide a more practical operating view than financial statements alone because they show the drivers behind performance. For example, if revenue is growing but profit is not improving, the KPI dashboard may point users toward food cost inflation, labor inefficiency, discounting, waste, or overhead increases. If profit appears strong but cash is tight, the dashboard can help highlight working capital or financing issues. This section is useful for founders who need a simple way to monitor whether the business is on track, consultants preparing recommendations, and investors reviewing the quality of the forecast. Because the KPIs update based on user assumptions, the dashboard can also be used during scenario planning and strategy discussions. It helps translate the financial model into measurable business targets, making it easier to manage the food truck after launch and communicate progress to partners, lenders, or stakeholders.
Startup Cost and Operating Expense Planning
The startup cost and operating expense planning component helps users estimate both the initial investment required to launch the food truck and the recurring costs required to keep it running. Startup costs may include truck purchase or lease, customization, kitchen equipment, point-of-sale systems, generator or utility setup, initial inventory, smallwares, branding, permits, licenses, legal setup, insurance deposits, website setup, pre-opening marketing, and working capital. Operating expenses may include food ingredients, packaging, payroll, fuel, maintenance, commissary rent, payment processing fees, marketing, software, accounting, insurance, phone, storage, cleaning, and miscellaneous supplies. This section is useful because many food truck plans underestimate either the upfront capital required or the monthly cash needed before stable profitability is reached. By organizing costs in one place, the model helps users build a more realistic funding plan and avoid launching with insufficient reserves. It also supports lender and investor conversations by showing where funds will be used and how expenses are expected to scale with revenue. For operators, this component can guide budgeting decisions, vendor negotiations, hiring plans, and purchasing priorities. A clear expense plan is essential for understanding margins, setting prices, managing cash flow, and determining whether the food truck concept can operate profitably in its target market.
Break-Even and Cash Flow Forecasting
The break-even and cash flow forecasting component helps users understand when the food truck may begin covering its costs and whether it can maintain enough cash during the early months of operation. Break-even analysis compares revenue with fixed and variable costs to estimate the point at which the business stops operating at a loss and begins generating profit. Inputs may include sales volume, average order value, food cost percentage, labor costs, rent, insurance, fuel, maintenance, marketing, and other overhead assumptions. Cash flow forecasting goes further by showing the timing of cash inflows and outflows, including startup spending, monthly operating results, working capital needs, owner contributions, loans, repayments, and ending cash balances. This is critical for a food truck because a business can appear profitable on paper but still face cash pressure if startup costs are high, sales ramp slowly, inventory purchases are mistimed, or large events require upfront preparation.
File types:
Excel – Single-User: .xlsx
Excel – Multi-User: .xlsx
Similar ProductsOther customers were also interested in...


 HenrySheykin
Pizzeria Financial Model Excel Template
The Pizza Restaurant Financial Model Template helps entrepreneurs, restaurant owners, consultants, a... Read more
Confectionery Shop Financial Model Excel Template
The Confectionery Shop Financial Model helps turn a candy shop, sweet shop, dessert retail concept, ... Read more
 Pushkar
BAKERY – 3 Statement Financial Model with 5 ...
This Bakery Business Plan Model is a perfect tool for a financial feasibility study on launching a B... Read more
Bakery Financial Model Excel Template
The Bakery Financial Model helps entrepreneurs, bakery owners, consultants, analysts, and business p... Read more
Coffee Shop Financial Model Excel Template
The Coffee Shop Financial Model helps entrepreneurs, founders, business owners, consultants, and ana... Read more
Gourmet Food Store Financial Model Excel Template
The Gourmet Food Store Financial Model helps entrepreneurs, founders, business owners, consultants, ... Read more
Coffee Truck Financial Model Excel Template
The Coffee Truck Financial Model Template helps entrepreneurs, founders, consultants, and business p... Read more
 Andreas
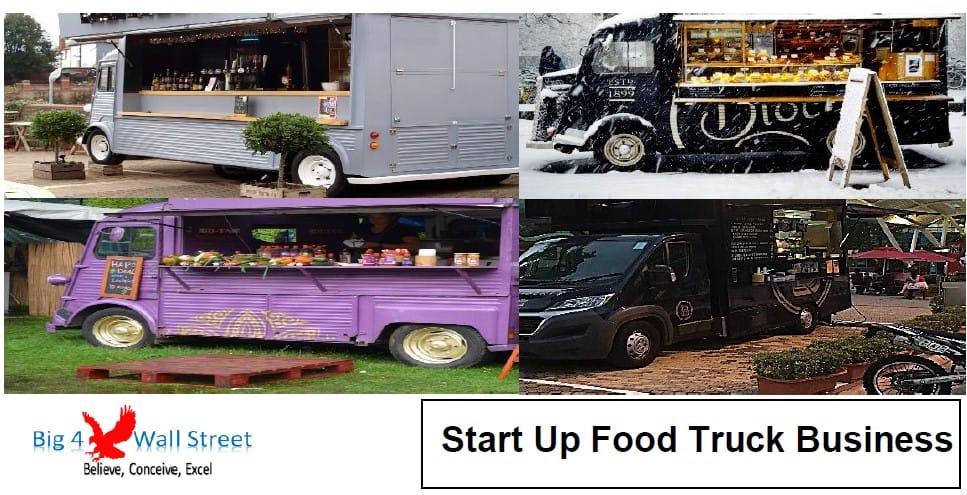
Start Up Food Truck Business Financial Model
Start Up Food Truck Business Financial Model presents the case of an investment in a food truck busi... Read more

 David
David
Vending Machine Business 5-Year 3 Statement Financ...
5 year rolling financial projection Excel model for a vending machine business generating revenue by... Read more

 ECF Consultancy
Startup Business Plan – Coffee Shop
If you dream of owning a coffee shop, the template is the first step in making your dream into reali... Read more
You must log in to submit a review.