
0 ITEMS

Real Estate Development Financial Model Excel – 10-Year Build-to-Sell, Rent-and-Hold, Debt & IRR
10-year real estate development Excel model with 120 monthly cash flows, build-to-sell and rent-and-hold strategies, 500-line budgets, construction debt, refinancing, IRR, equity multiples, scenarios and 8 dashboard charts. Includes a 35-page PDF guide.
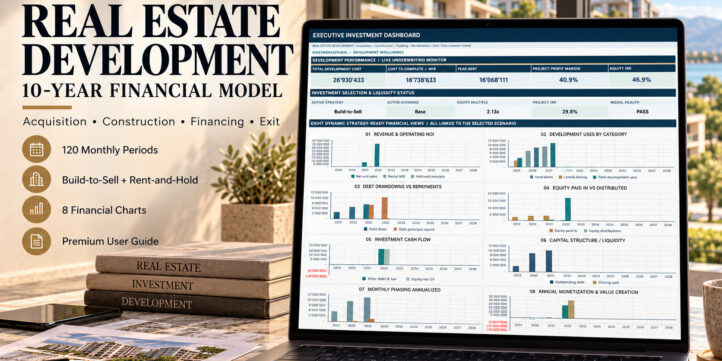
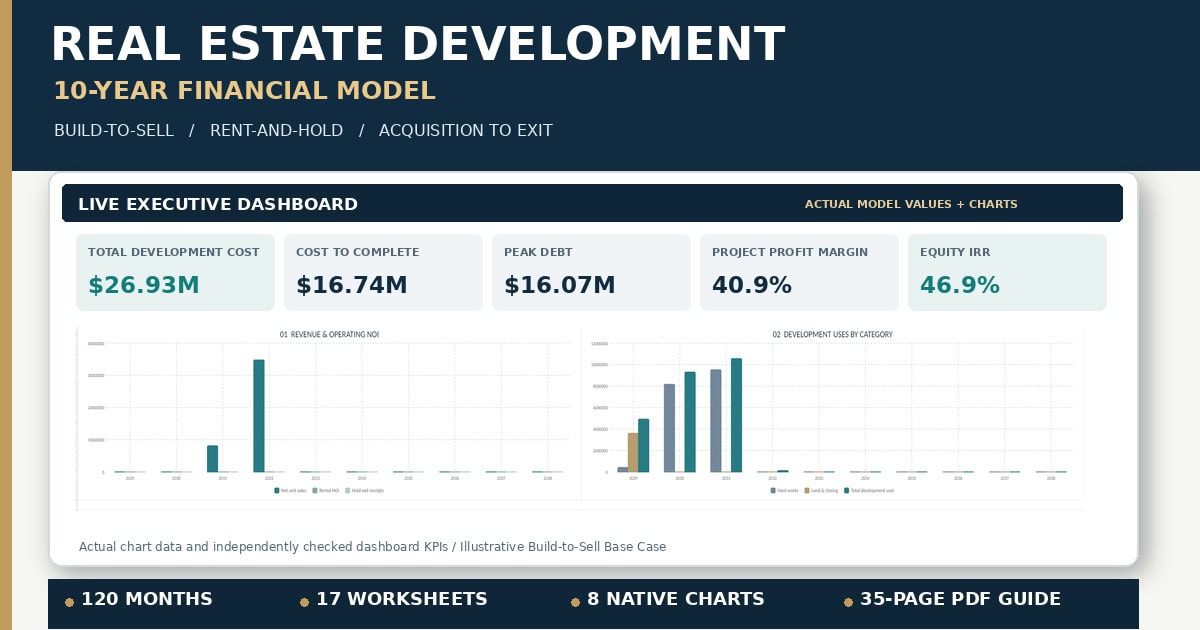
REAL ESTATE DEVELOPMENT FINANCIAL MODEL
10-Year SIGNATURE Edition | Build-to-Sell & Rent-and-Hold | Acquisition-to-Exit Analysis
Evaluate property development economics from land acquisition through construction, financing, monetization and final exit in one professional Excel financial model.
The Real Estate Development Financial Model – SIGNATURE Edition by SheetworksStudio integrates 120 monthly forecast periods, 10 annual summaries, detailed project budgets, unit economics, construction financing, investment returns and four financial scenarios.
Designed for real estate developers, investment analysts, project sponsors and consultants, this fully editable model supports the evaluation of property development opportunities under two distinct investment strategies.
🏗️ TWO INVESTMENT STRATEGIES
Build-to-Sell – Develop, Complete & Sell
Forecast development spending, construction completion, unit-sale pricing and absorption, gross development value (GDV), selling costs, construction debt repayment and equity distributions.
Evaluate project profit, investor returns, equity funding requirements and the potential impact of construction delays or slower unit sales.
The model also includes a configurable final-period liquidation assumption for remaining unsold units.
Rent-and-Hold – Develop, Lease, Refinance & Exit
Model lease-up, stabilization, recurring rental income, occupancy, rent escalation, property operating expenses and net operating income (NOI).
Evaluate construction-to-term refinancing, debt amortization, DSCR, equity distributions and exit value based on a capitalization rate.
Both strategies are controlled from the central CONTROL worksheet and feed into the same integrated financial engine.
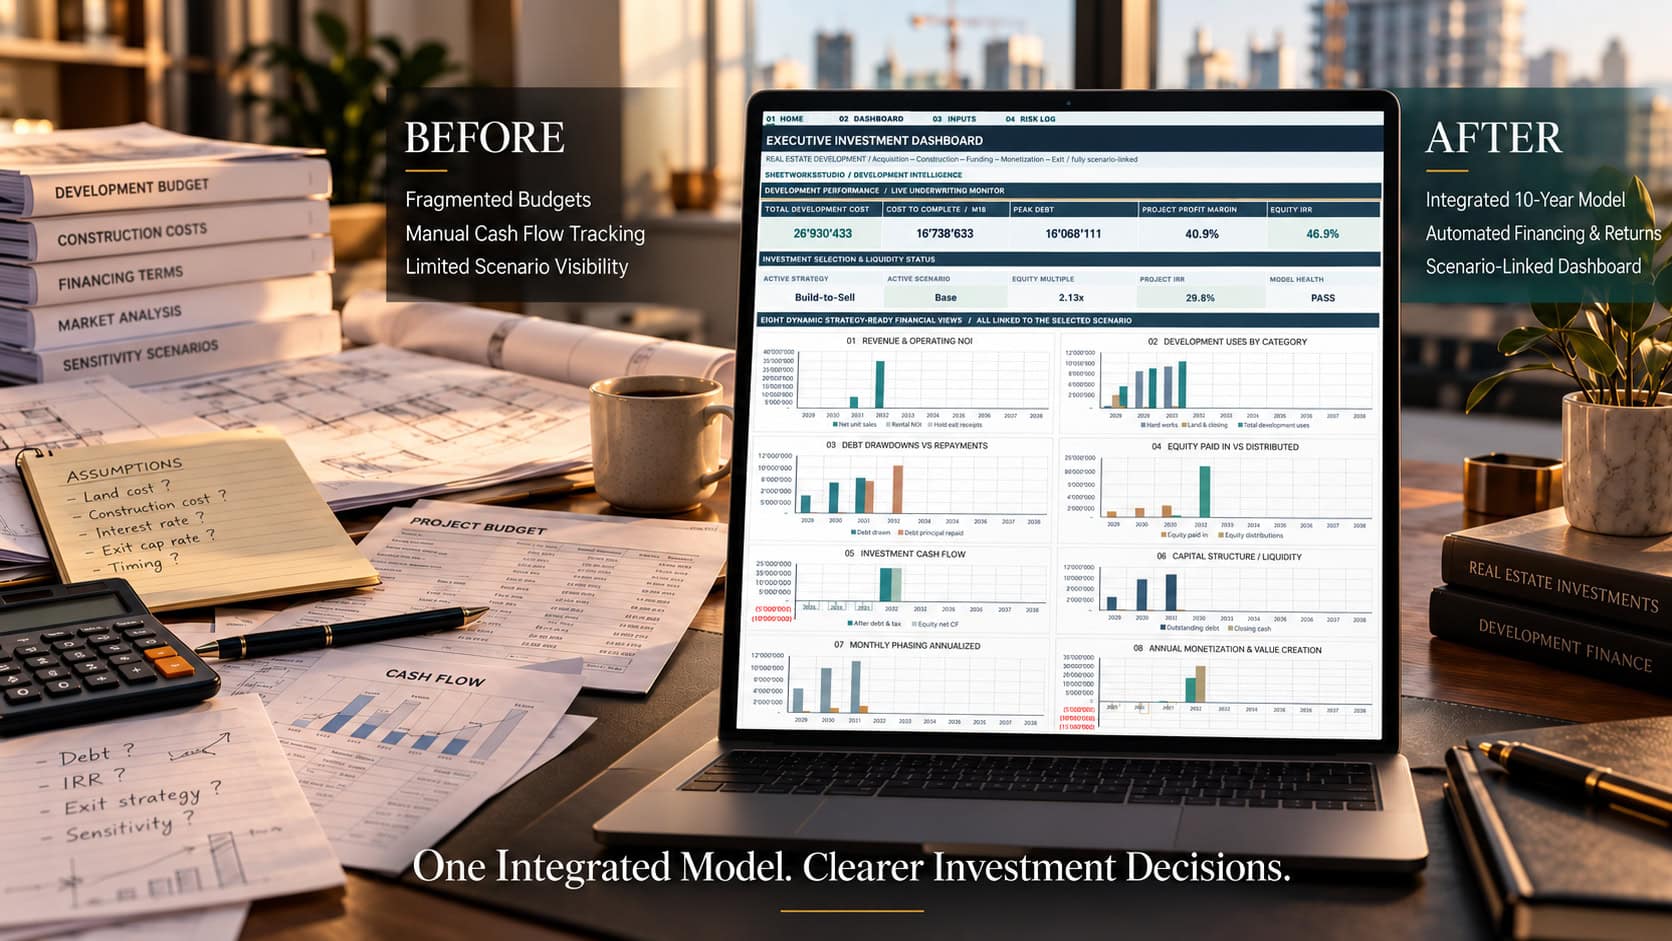
📊 120-MONTH FORECAST & EXECUTIVE DASHBOARD
The model covers 10 years / 120 monthly periods, supported by ten annual financial summaries.
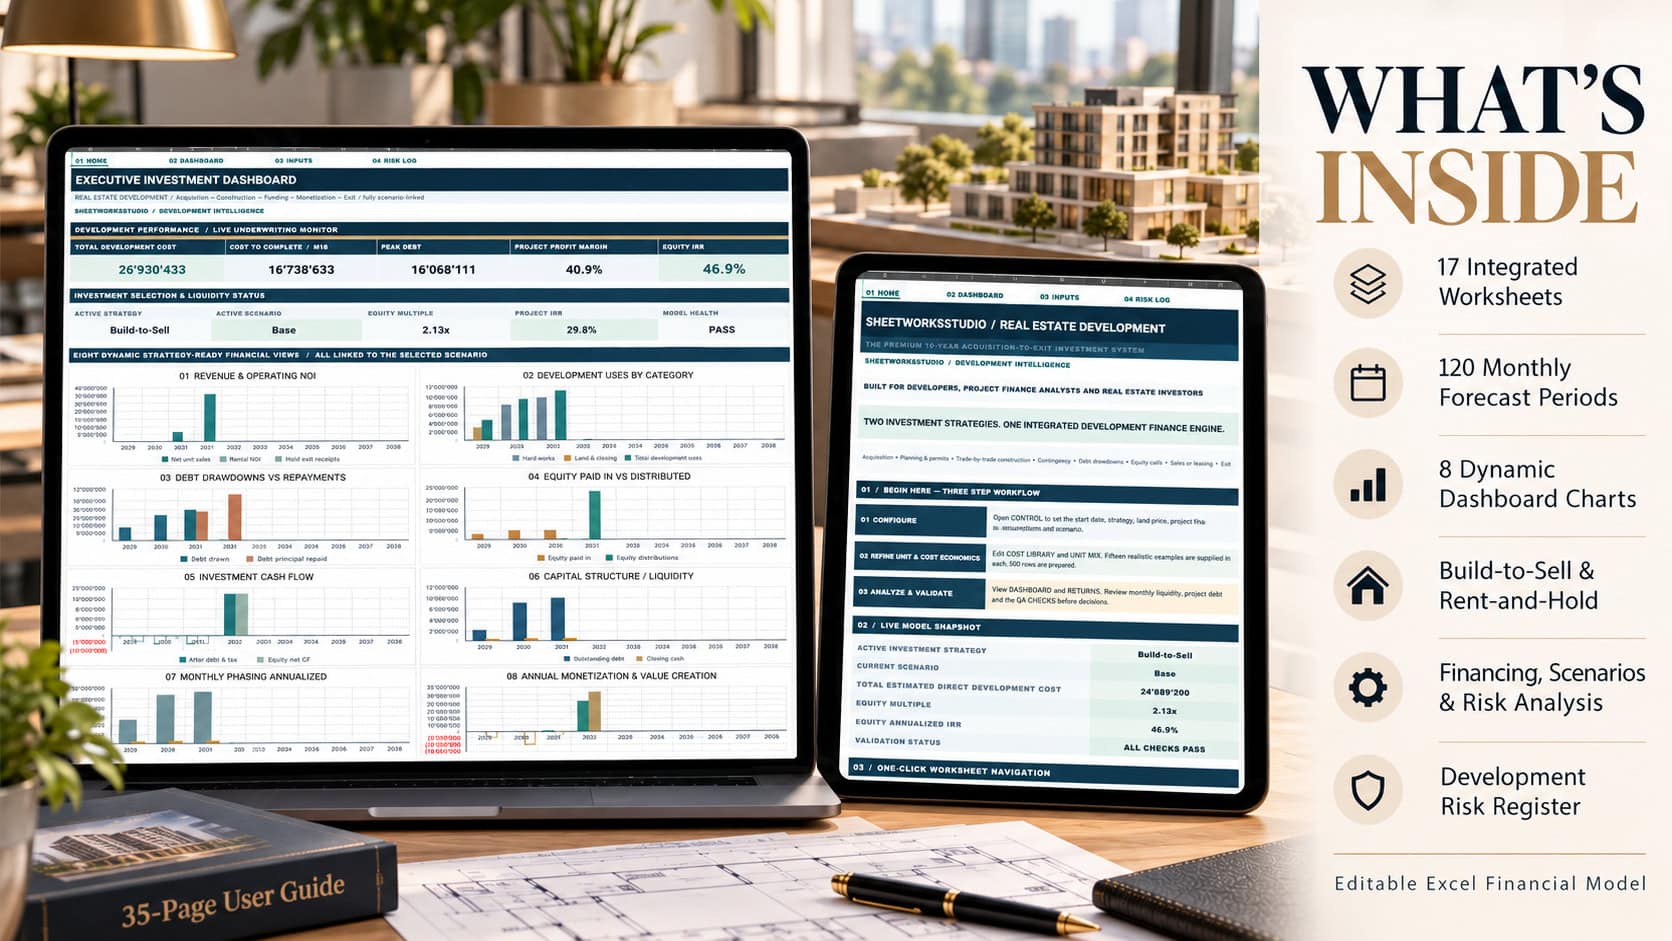
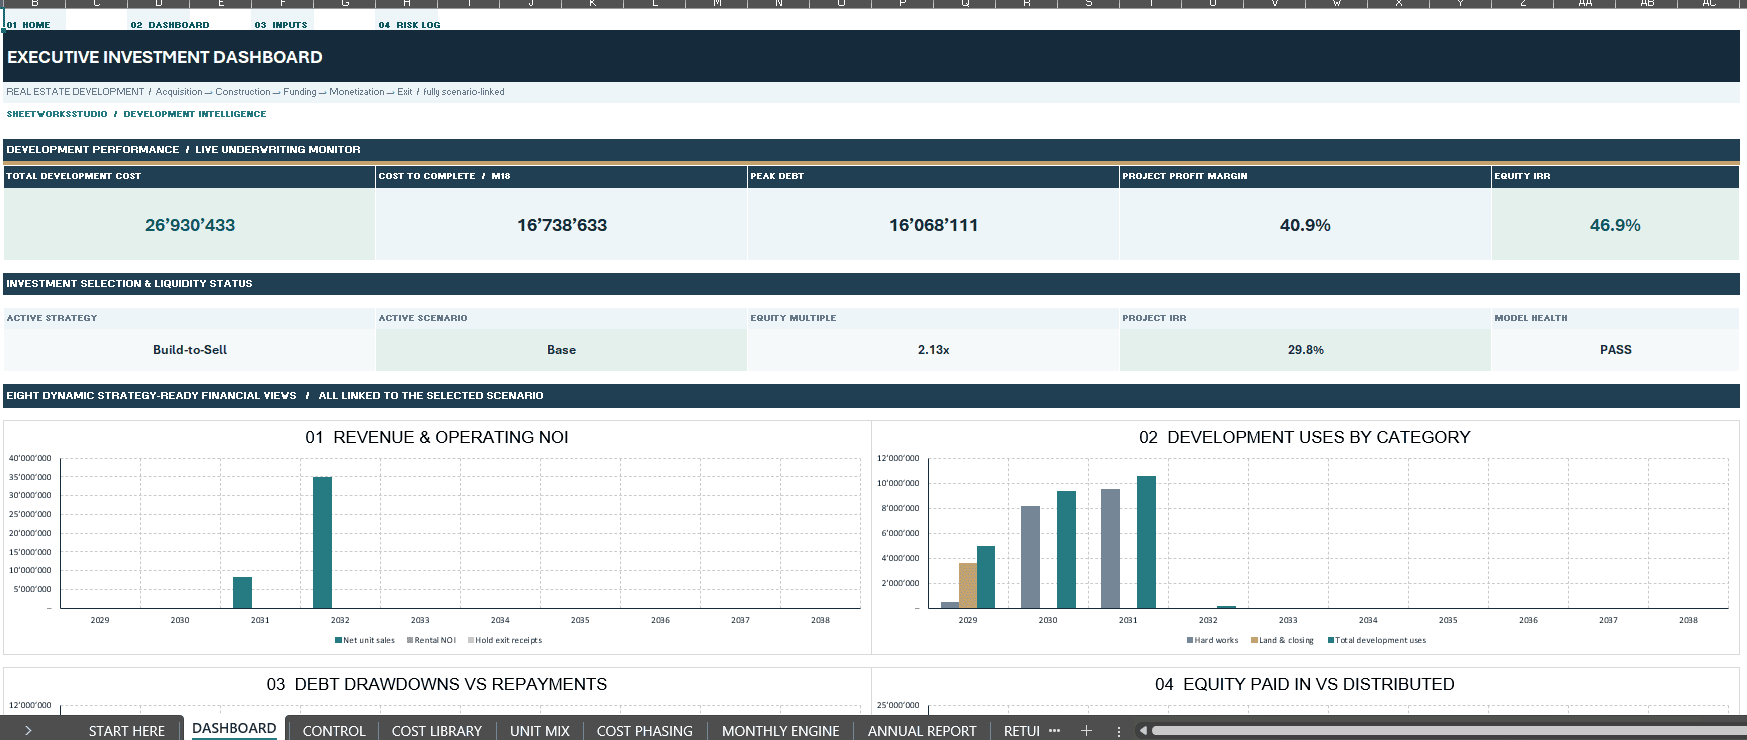
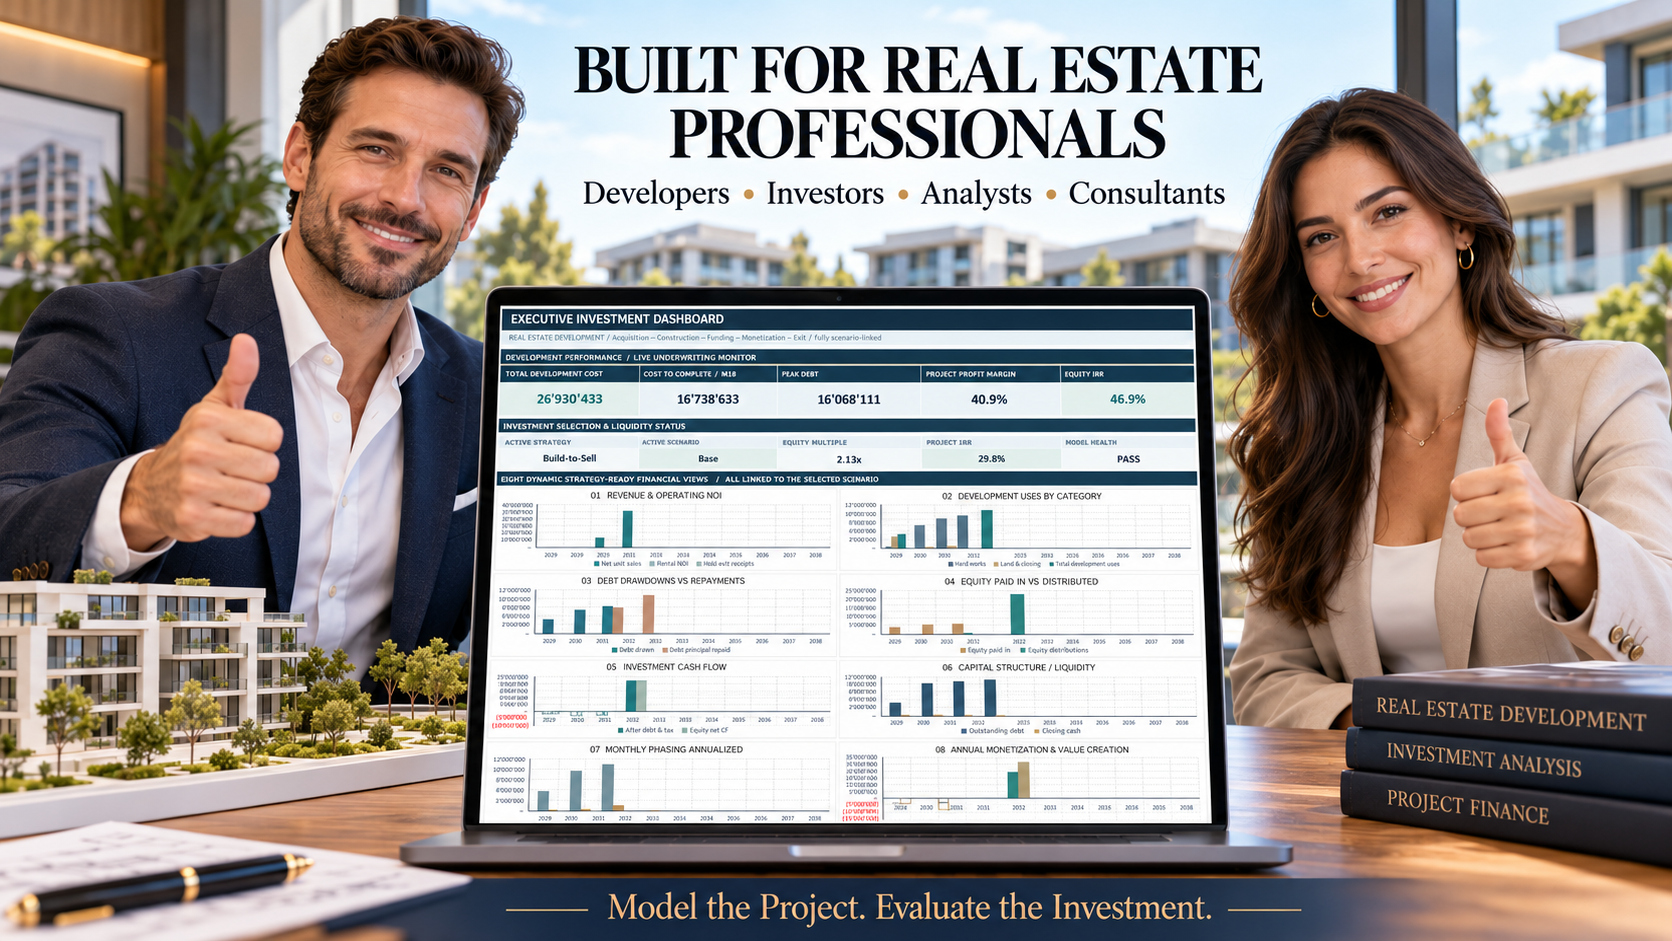
A professional Executive Dashboard presents the most important development and investment indicators:
- Total Development Cost
- Cost-to-Complete
- Peak Outstanding Debt
- Project Profit Margin
- Project Internal Rate of Return (IRR)
- Equity Internal Rate of Return (IRR)
- Equity Multiple
- Gross Development Value / Exit Value
- Residual Land Value
- Model Health and Validation Status
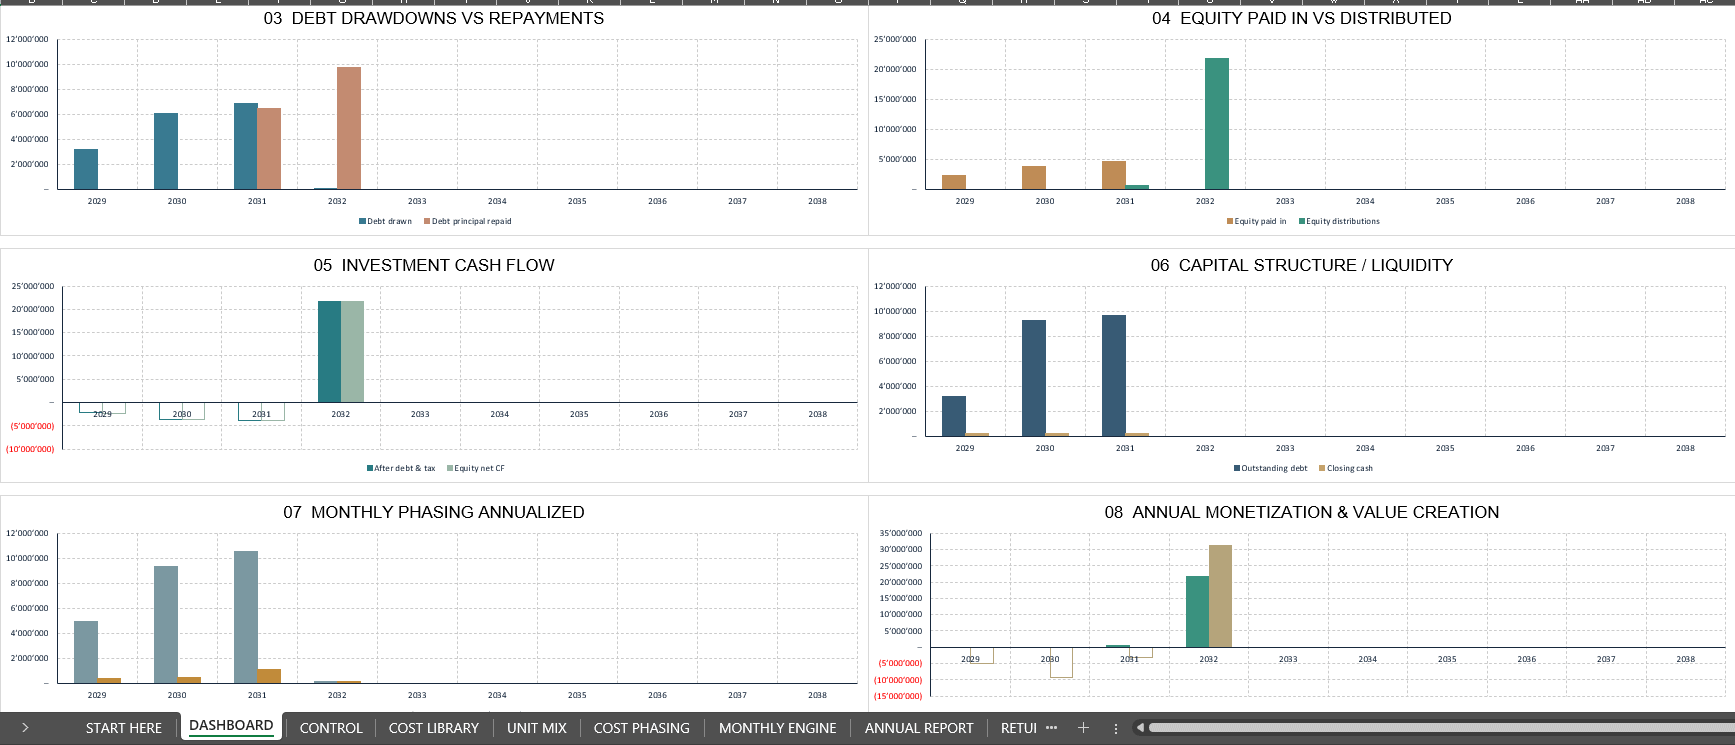
Eight native, formula-linked Excel charts visualize:
- Revenue and Operating NOI
- Development Uses by Category
- Debt Drawdowns versus Repayments
- Equity Contributions versus Distributions
- Investment Cash Flow
- Capital Structure and Liquidity
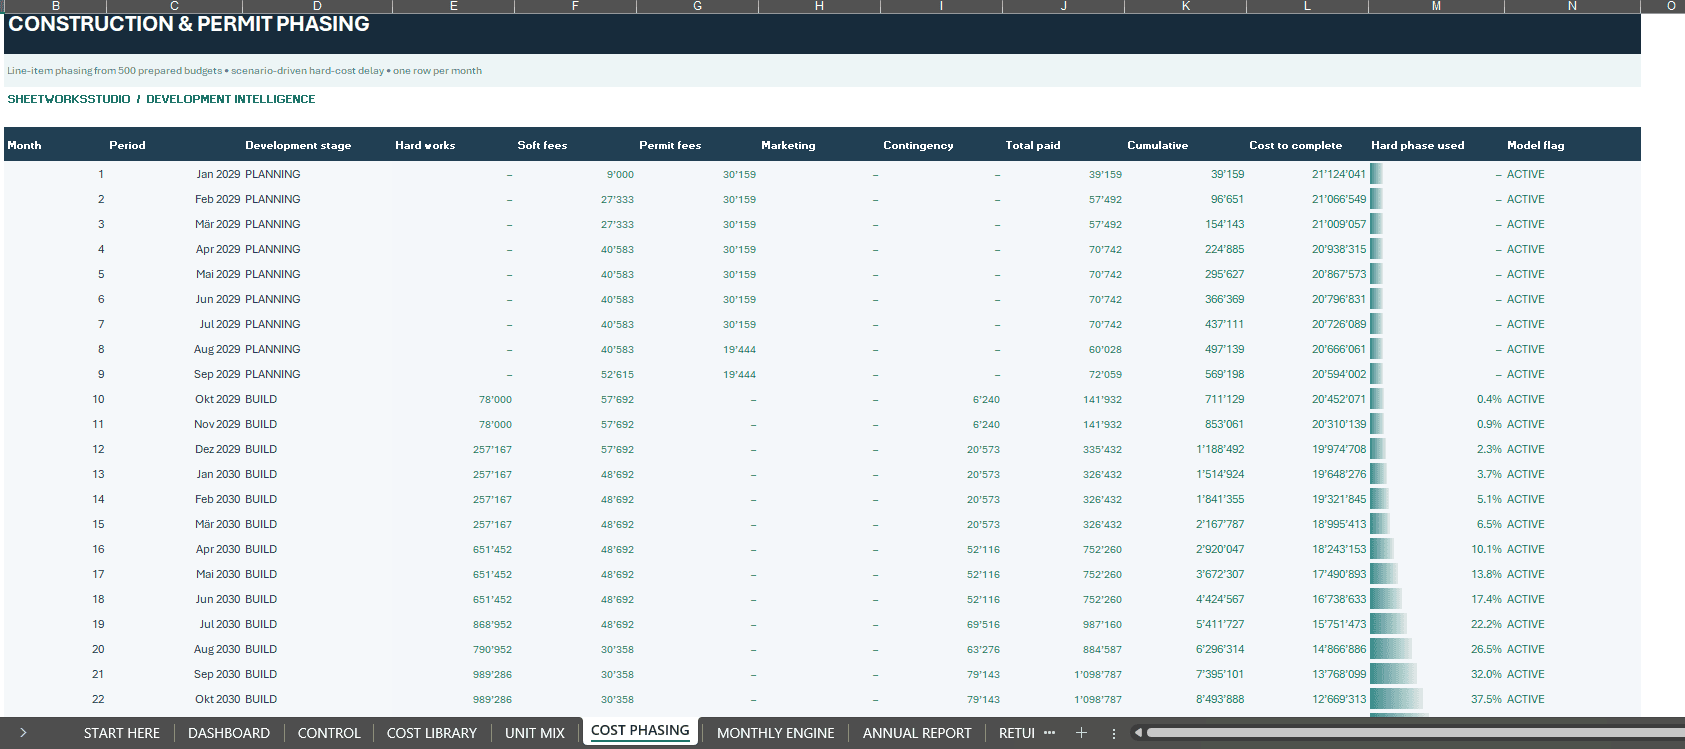
- Monthly Construction Phasing Summarized by Year
- Annual Monetization and Value Creation
All charts are linked to model results and update when assumptions and financial scenarios change.
🏦 DEVELOPMENT BUDGET, FINANCING & CASH FLOW
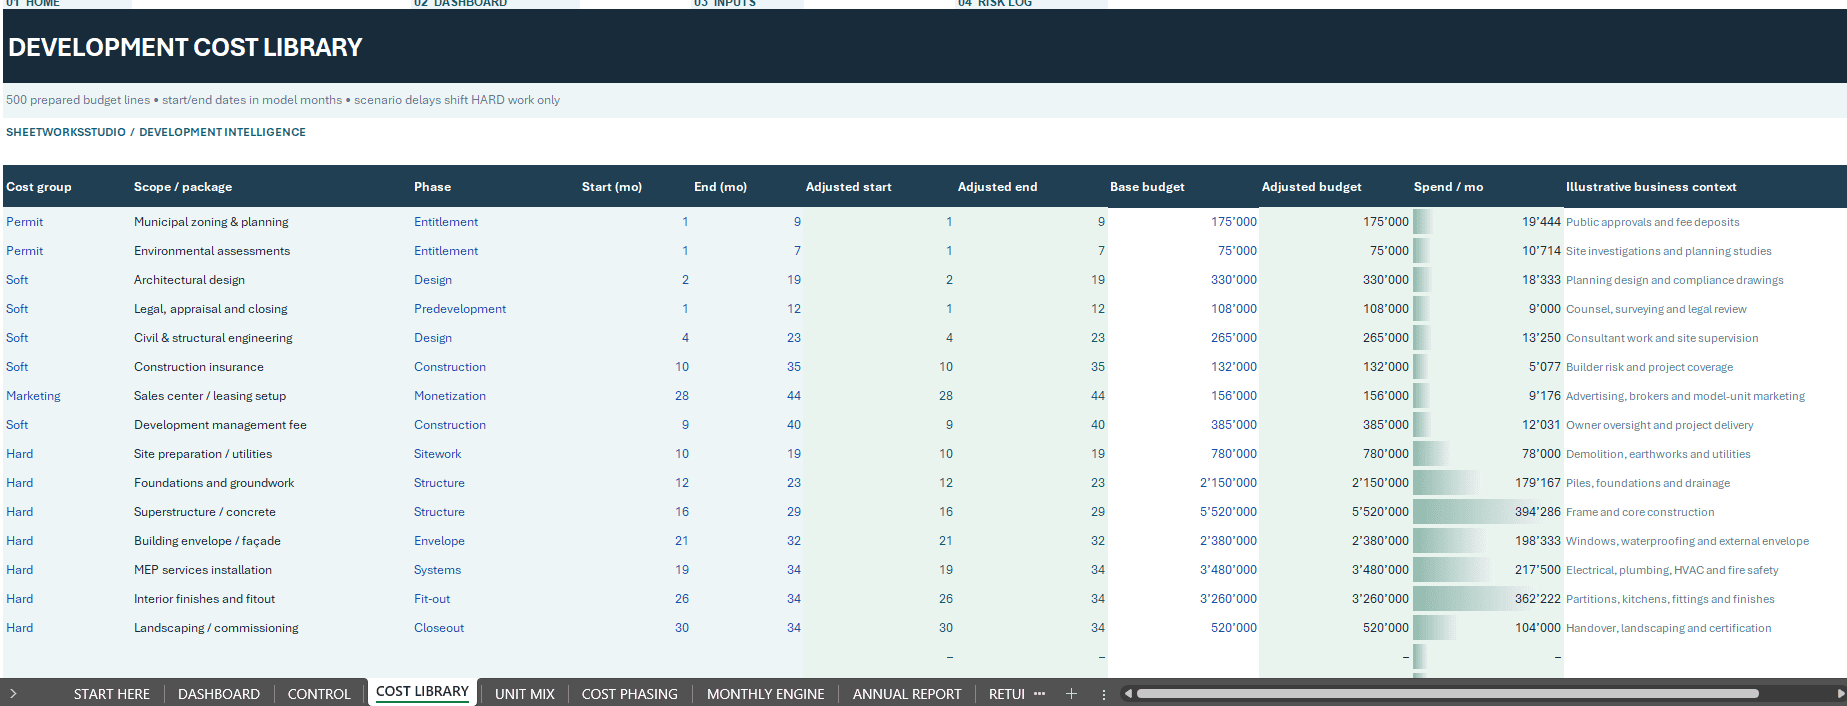
Development Cost Library
A structured financial planning register with up to 500 prepared budget lines and 15 illustrative development cost packages.
Track land acquisition, permits, architecture, engineering, hard construction costs, infrastructure, professional fees, marketing and other expenses.
Define individual cost phasing, apply contingencies and review the impact of development delays and cost overruns.
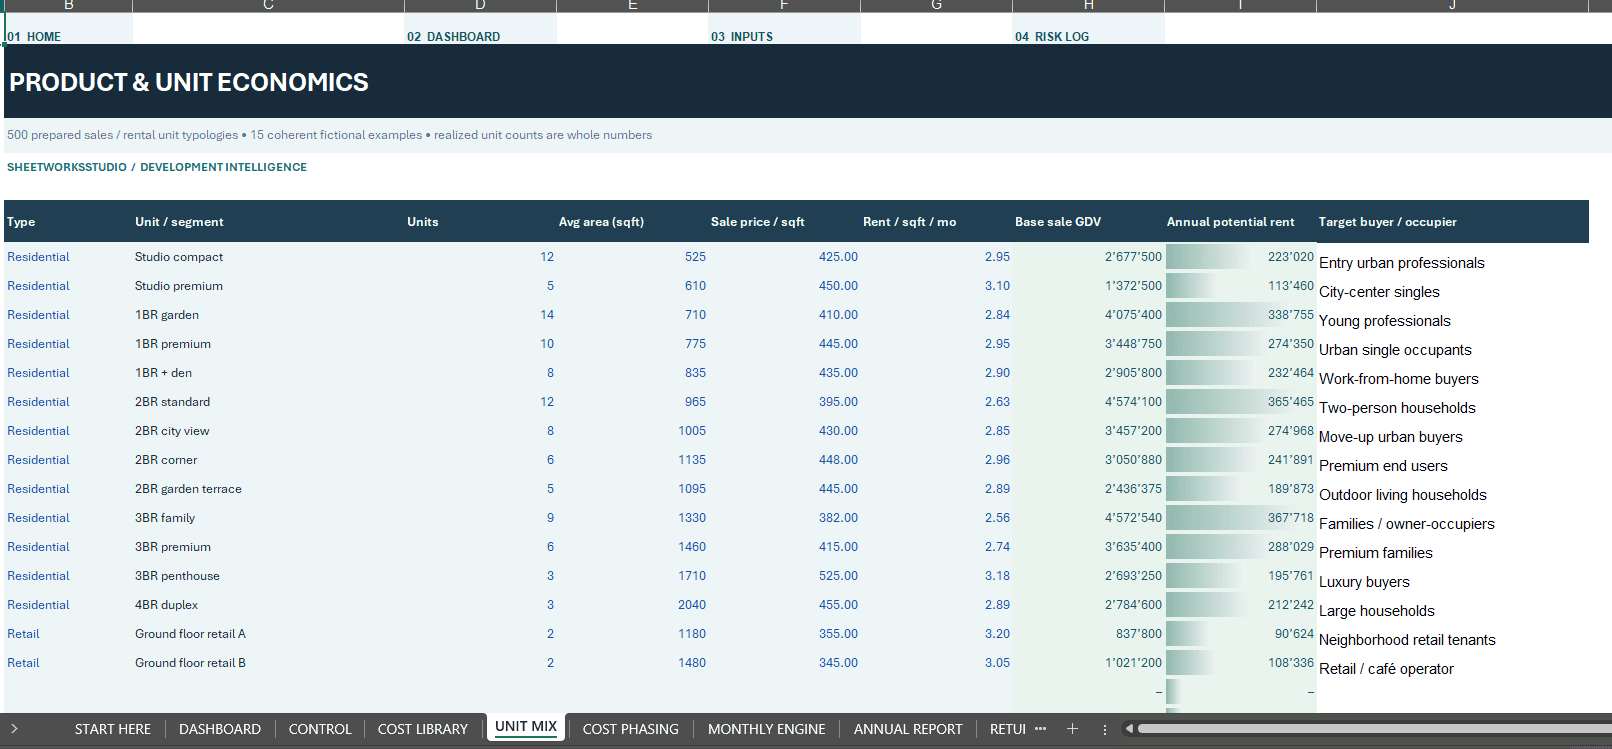
Unit Mix & Property Economics
A 500-row product and unit register with 15 illustrative residential and retail categories.
Configure unit quantities, floor areas, sale prices, rental assumptions and unit-specific commercial parameters.
Automatically calculate saleable area, aggregate GDV and stabilized rental potential.
Construction Financing
Analyze construction loans, loan-to-cost assumptions, interest, lender fees, repayment schedules, equity funding requirements and liquidity reserves.
The Rent-and-Hold strategy also supports term refinancing constrained by modeled loan-to-value assumptions.
Monthly Development Cash Flow
Follow land acquisition, development expenses, unit sales, rental NOI, loan drawdowns and repayments, simplified taxes, investor capital calls and cash distributions through the complete 120-month forecast.
📈 RETURNS, VALUATION & DECISION SUPPORT
Evaluate the potential financial performance of a development through integrated project and investor-level metrics.
The model calculates:
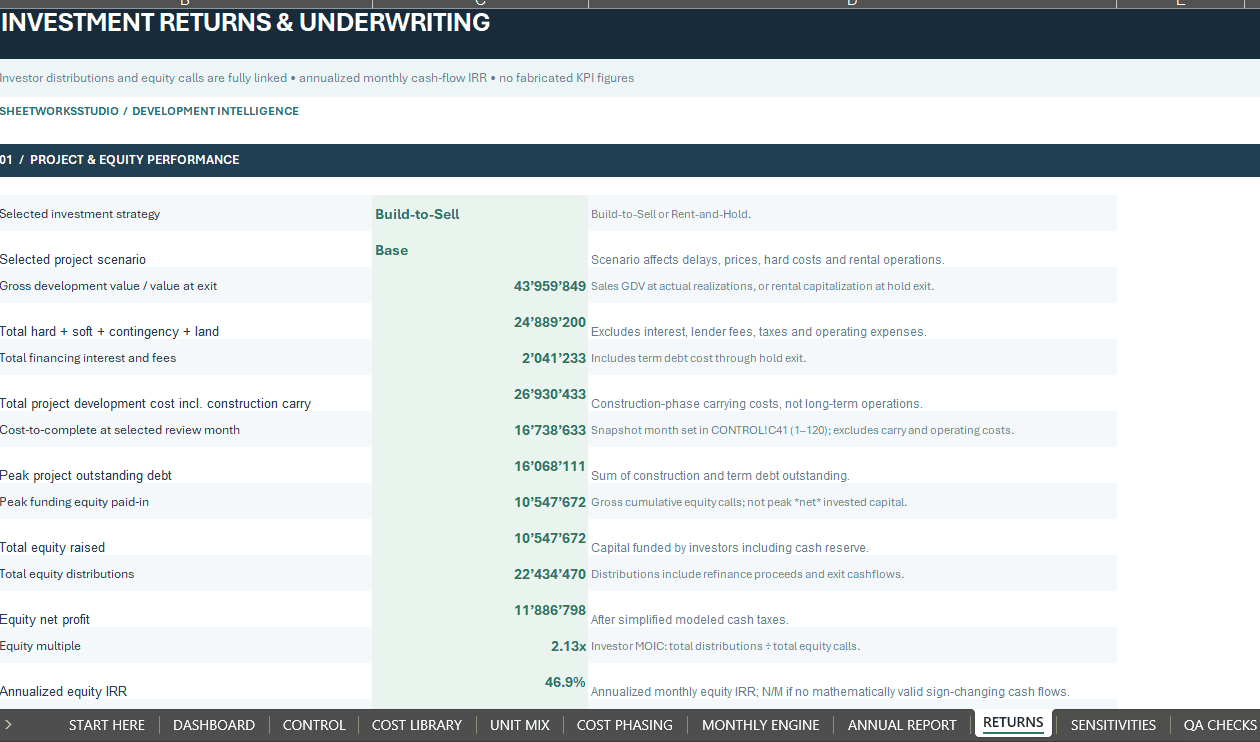
- Annualized Project IRR
- Annualized Equity IRR
- Equity Multiple
- Equity Net Profit
- Peak Debt and Total Equity Raised
- Discounted Equity Cash Flow NPV
- Project Development Profit Margin
- Residual Land Value
- Break-Even Development Sale Value
- Terminal Property Valuation
- Exit Capitalization Rate
- Investor Distributions
Sensitivity Analysis
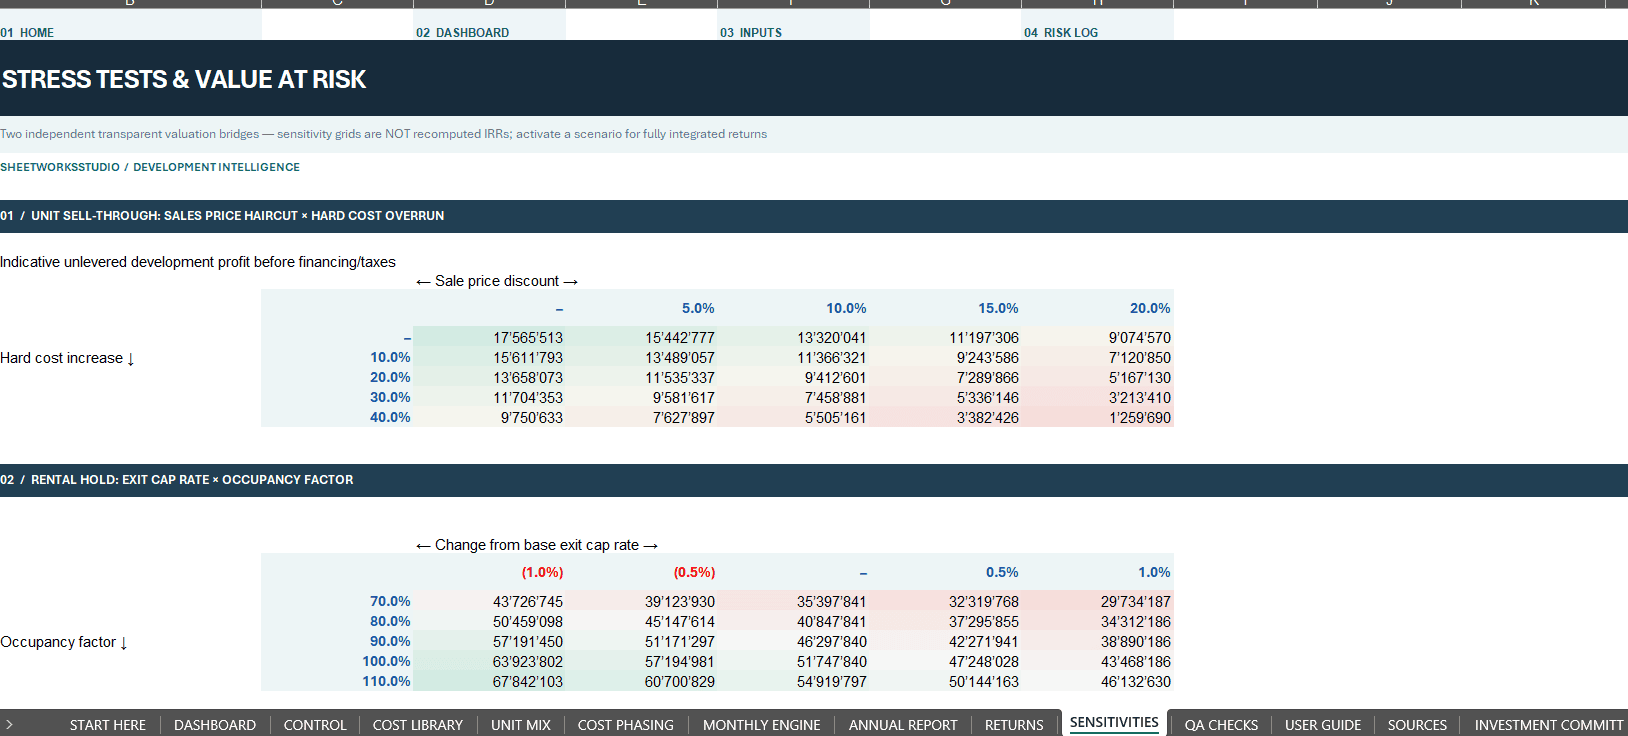
Analyze indicative changes in development profit and valuation under alternative sales pricing, hard construction costs, rental occupancy and exit capitalization rates.
These grids provide decision-support approximations. For the complete effect on financing and equity returns, select and recalculate the appropriate live financial scenario.
🔄 FOUR FINANCIAL SCENARIOS
The model includes four integrated development cases.
Base Case – Central illustrative development assumptions.
Upside Case – More favorable market conditions, pricing and execution assumptions.
Downside Case – Construction delays, weaker demand and additional cost pressure.
Severe Stress – A more adverse combination of development, financing and market assumptions.
Scenario selection affects relevant construction, sales, rental, financing and investment-return calculations.
PROFESSIONAL INVESTMENT INTELLIGENCE MODULES
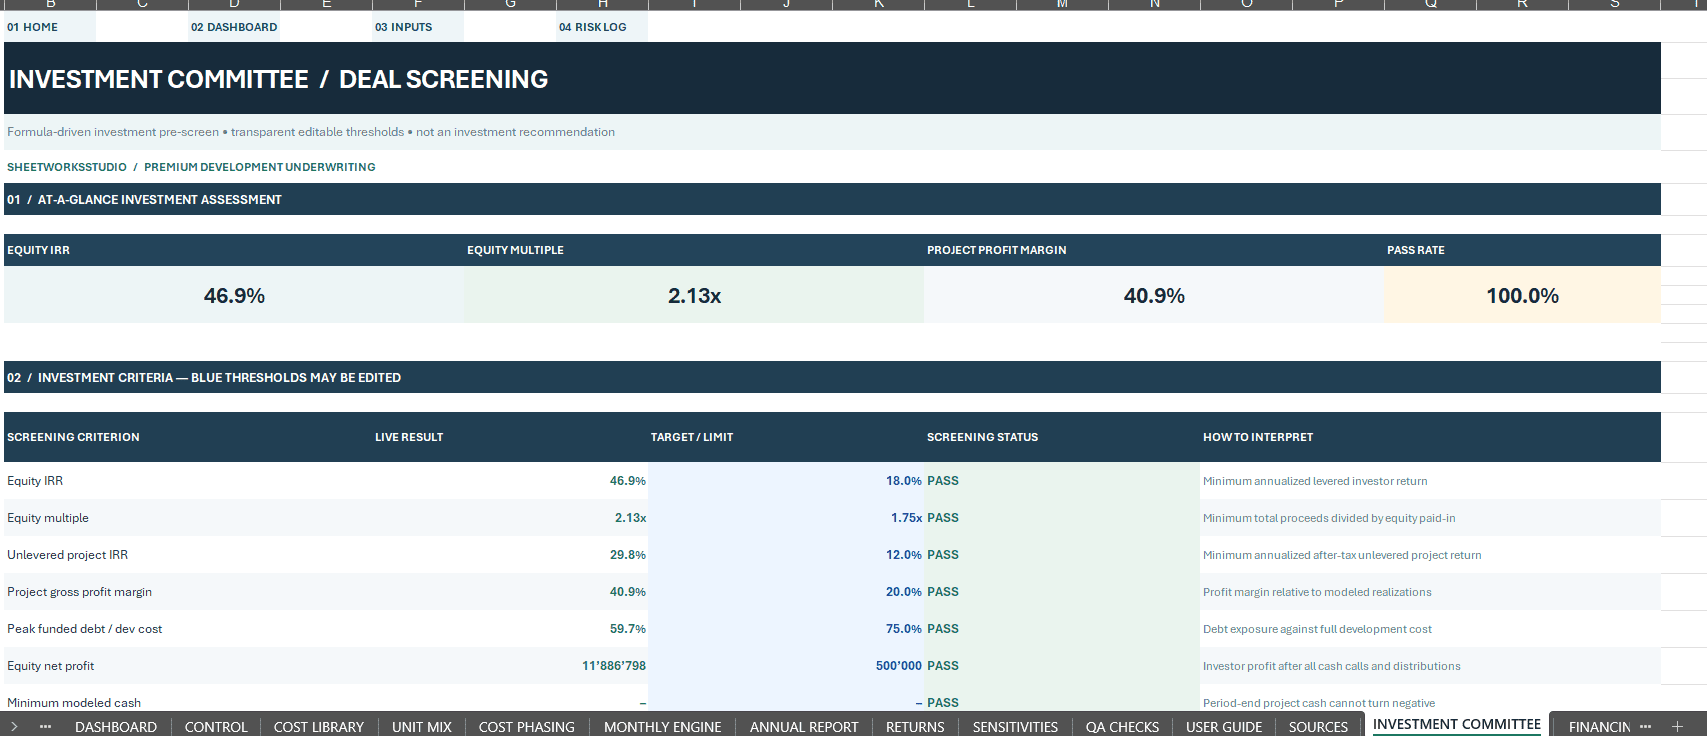
Investment Committee
Twelve configurable evaluation criteria with target thresholds and automated PASS / REVIEW indicators support structured investment screening.
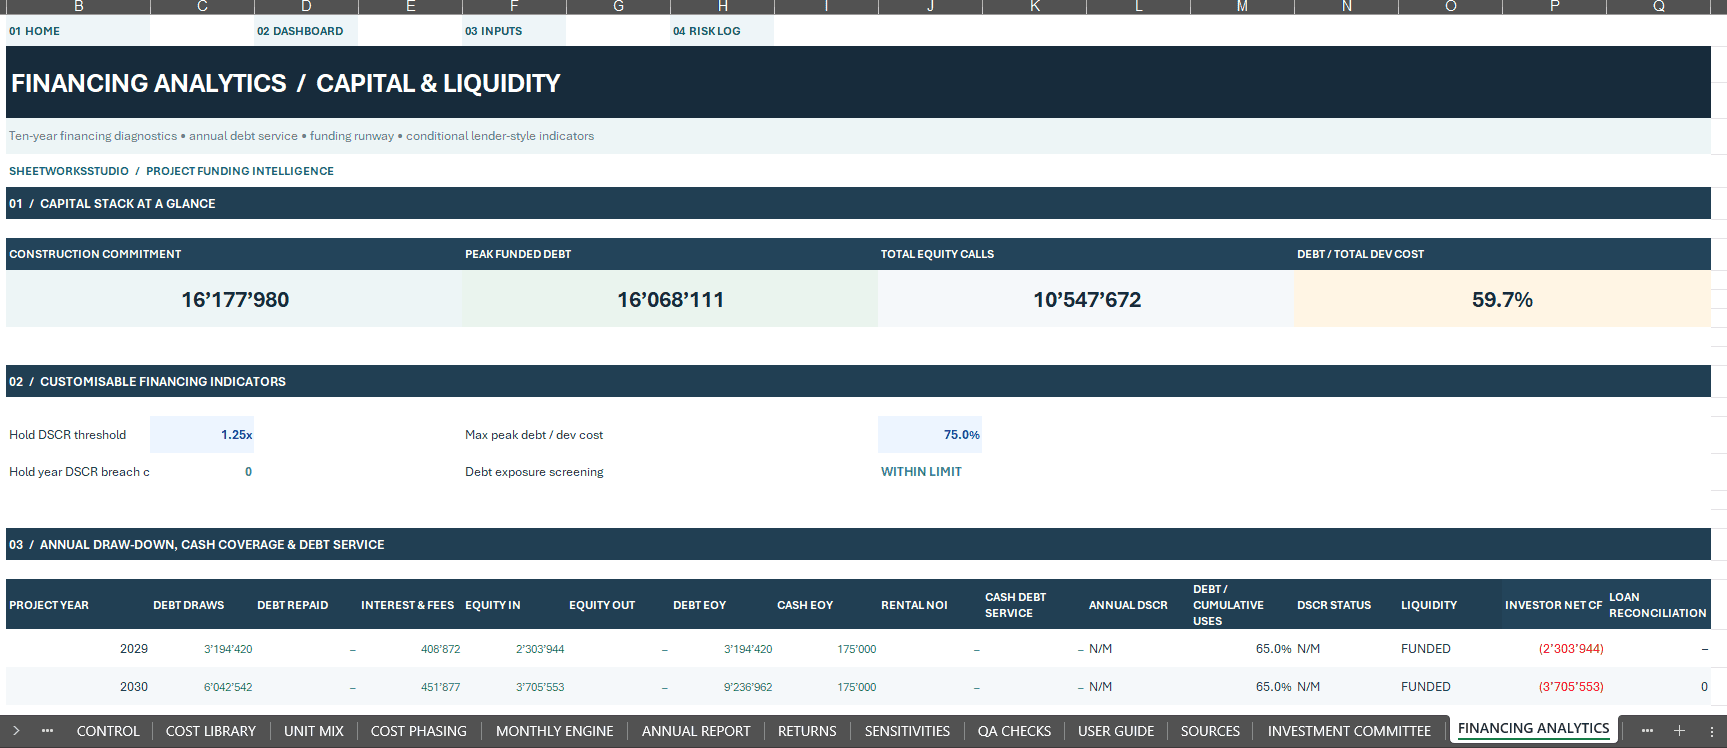
Financing Analytics
A dedicated 10-year analysis of debt, equity funding, investor distributions and debt-service indicators.
Development Timeline
A scenario-aware overview of acquisition, construction, development milestones, monetization and project exit.
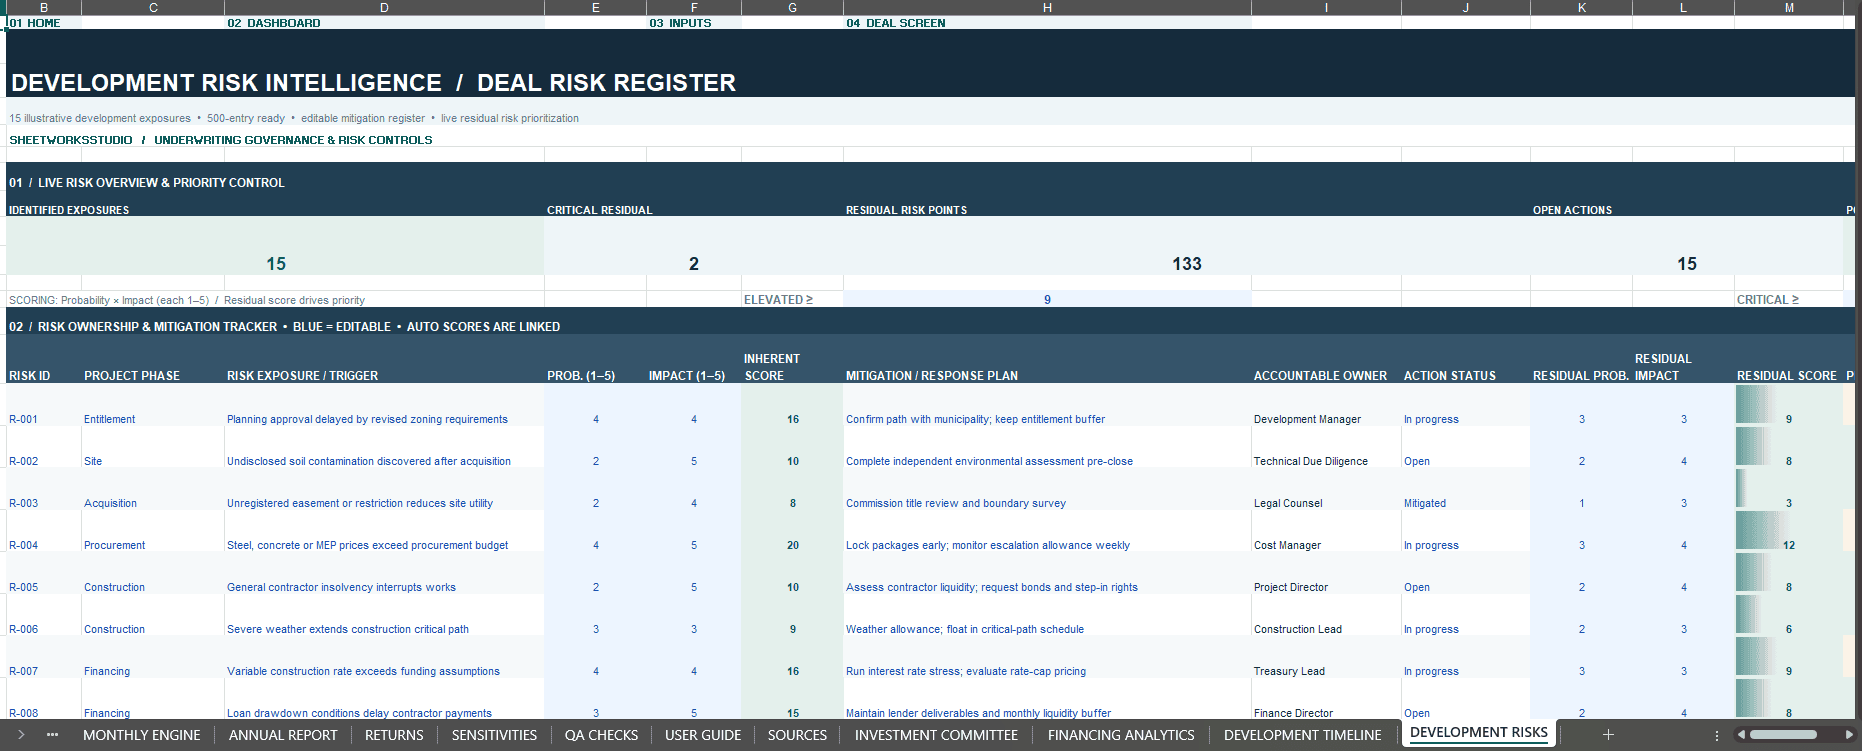
Development Risks
A risk management register with 500 prepared entries and 15 fictional development risks.
Track likelihood, impact, risk priorities, responsible owners, mitigation measures and action status.
Qualitative risk scores do not independently change the financial cash flow projections.
📦 WHAT YOU RECEIVE
1. Real Estate Development Financial Model – Excel Workbook (.xlsx)
- 17 Integrated Excel Worksheets
- 120 Monthly Forecast Periods
- 10 Annual Financial Summaries
- Build-to-Sell and Rent-and-Hold Strategies
- 500 Prepared Development Cost Lines
- 500 Prepared Unit-Type Rows
- Eight Native Dashboard Charts
- Four Financial Scenarios
- Construction Financing and Refinancing
- Equity Cash Flow, IRR, NPV and Valuation
- Investment Committee and Financing Analytics
- Development Timeline and Risk Register
- Twenty Model Integrity Checks
- Editable Assumptions and Formula-Driven Outputs
- Illustrative Sample Data
- No VBA Macros or External Data Dependencies
2. Professional How-to-Use Guide – 35-Page PDF
A detailed English-language operating guide explaining workbook navigation, model setup, cost budgets, unit economics, development scheduling, financing, investment returns, financial scenarios, model validation, risk management and worked examples.
IDEAL FOR
- Real Estate Developers
- Property and Land Investors
- Project Finance Analysts
- Real Estate Investment Consultants
- Development Advisory Firms
- Investment and Acquisition Teams
- Real Estate Project Sponsors
- Investment Committees
- Property Development Professionals
⚙️ HOW TO GET STARTED
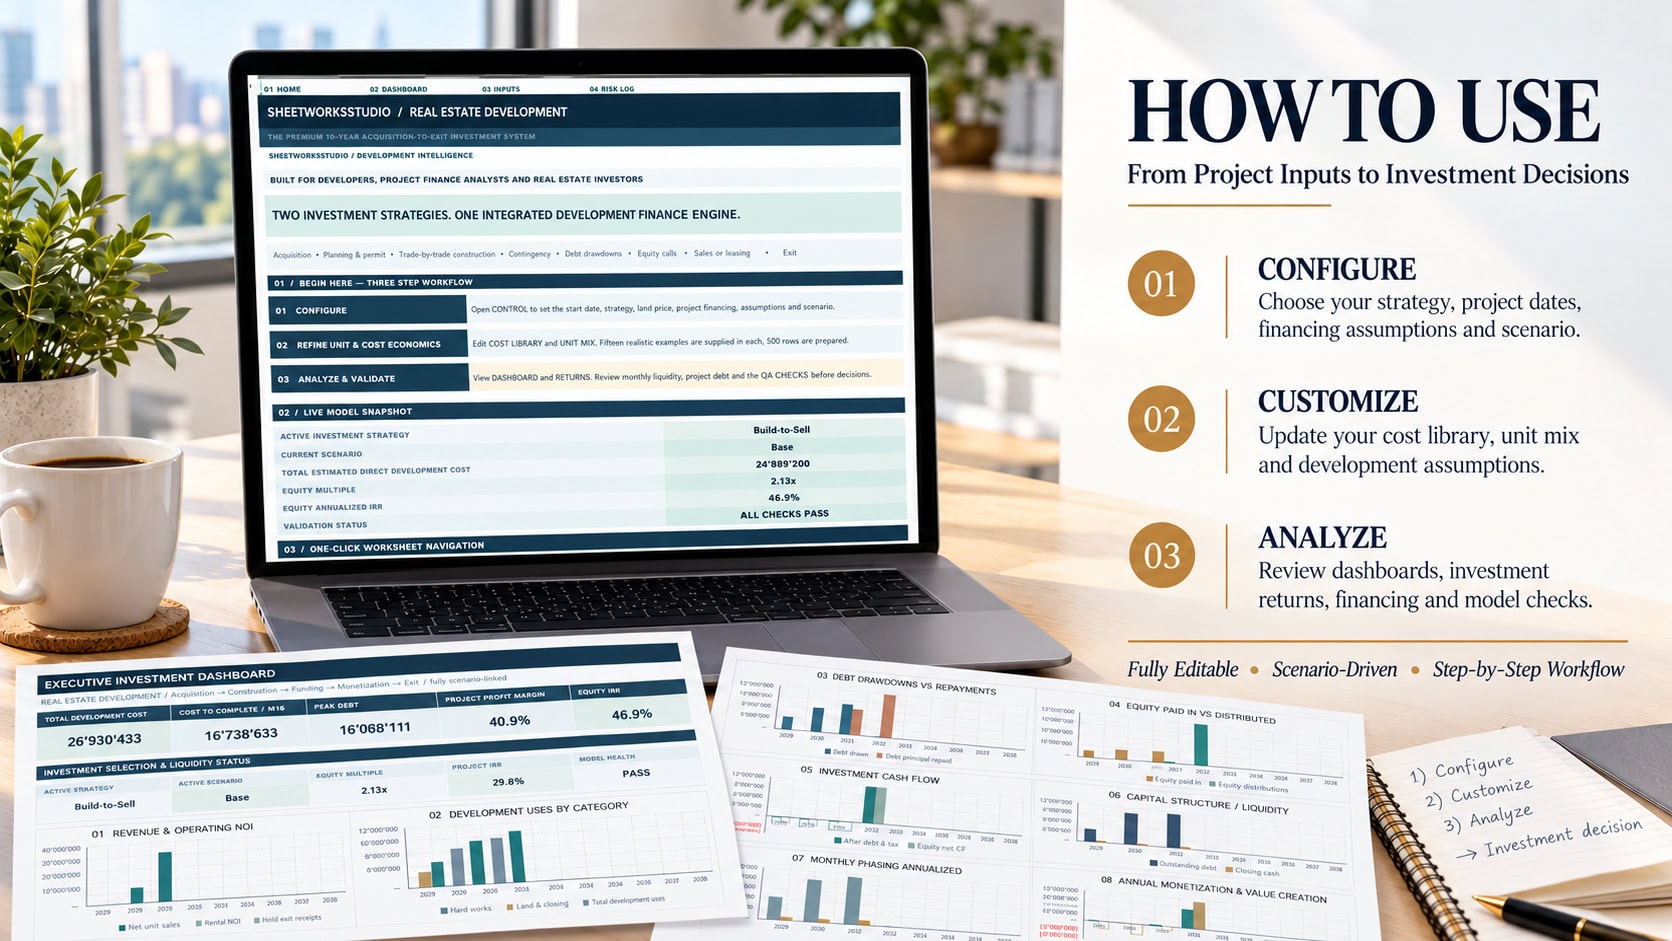
Step 1 – Configure Your Investment
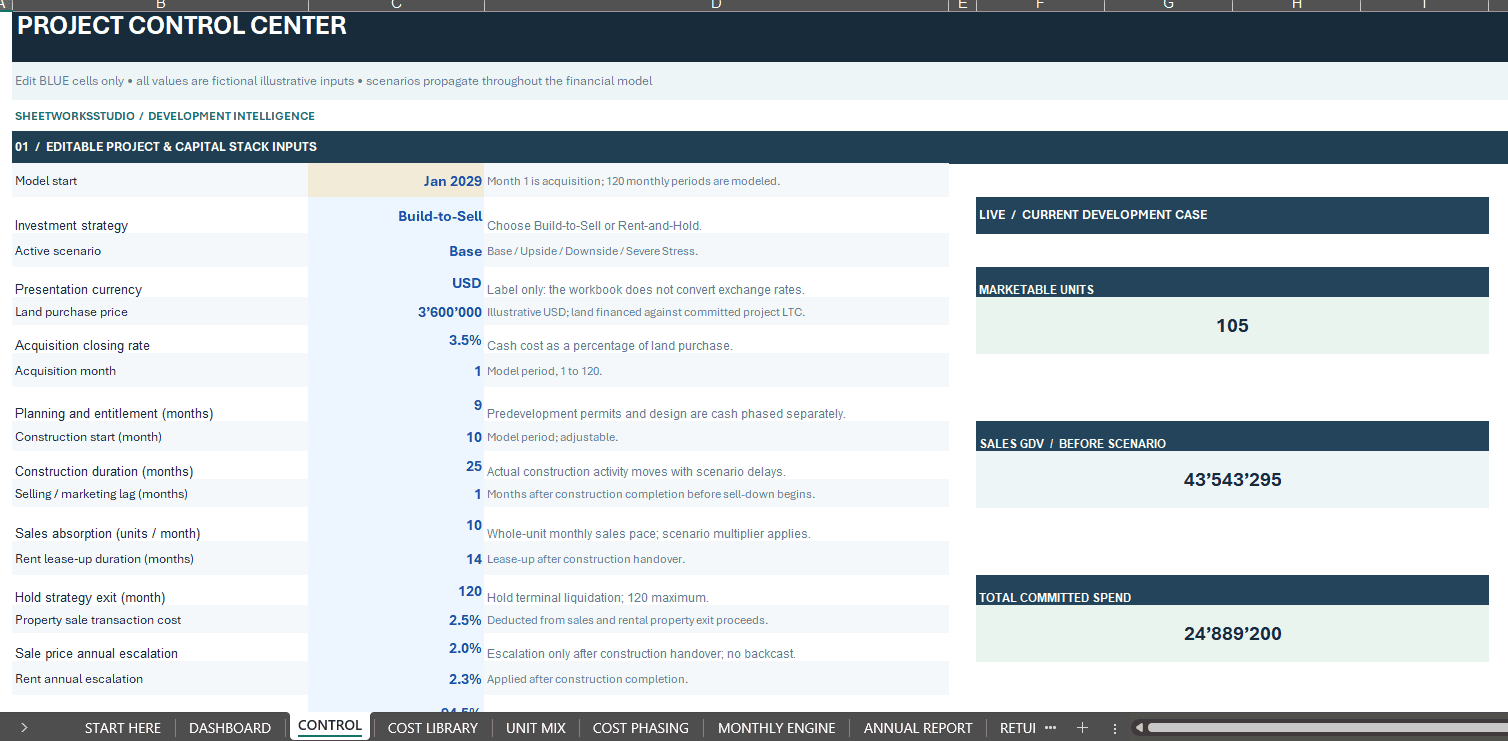
Open START HERE and CONTROL. Select your development strategy, financial scenario, project starting date and financing assumptions.
Step 2 – Customize Development Costs
Replace illustrative construction and development expenses in COST LIBRARY.
Step 3 – Configure Property Economics
Update UNIT MIX with project-specific unit quantities, sales prices, rental values and other assumptions.
Step 4 – Review Development Cash Flows
Analyze construction spending, debt funding, equity requirements and monetization through COST PHASING, MONTHLY ENGINE and ANNUAL REPORT.
Step 5 – Analyze Investment Performance
Review DASHBOARD and RETURNS for profit, financing requirements, project IRR, equity IRR, equity multiples and valuation.
Step 6 – Validate and Compare
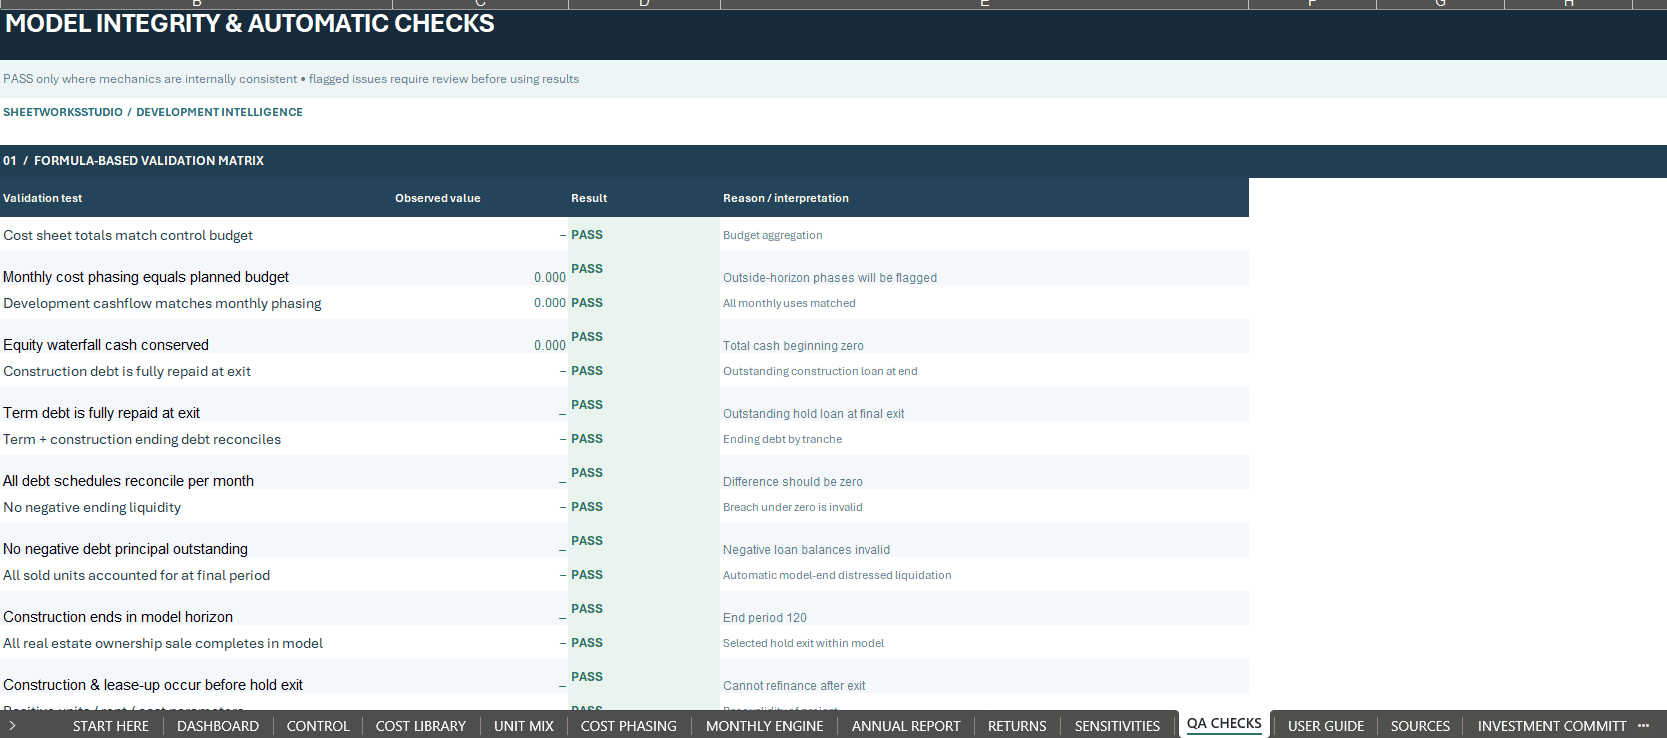
Use SENSITIVITIES, INVESTMENT COMMITTEE, FINANCING ANALYTICS, DEVELOPMENT TIMELINE, DEVELOPMENT RISKS and QA CHECKS to evaluate the project from different perspectives.
TECHNICAL SPECIFICATIONS
- File Format: Microsoft Excel (.xlsx)
- Forecast Horizon: 10 Years
- Forecast Frequency: Monthly
- Forecast Periods: 120
- Annual Reporting: 10 Years
- Worksheets: 17
- Formula Cells: 13,868
- Dashboard Charts: 8
- Scenarios: 4
- Model Validation Checks: 20
- PDF User Guide: 35 Pages
- Macros: None
- External Data Connections: None
- Editable Formulas: Yes
- Illustrative Forecast Years: 2029–2038
Microsoft Excel Desktop is recommended.
Google Sheets import and functional compatibility have not been independently tested. Equivalent formulas, charts, navigation, formatting and dropdown behavior are therefore not guaranteed.
IMPORTANT MODEL LIMITATIONS & DISCLAIMER
This product is an illustrative real estate development feasibility and investment cash flow model.
It is not a full statutory three-statement accounting system, lender-certified financing model, professional property valuation report or multi-partner GP/LP promote waterfall.
Taxation, financing and investment-return calculations use simplified modeling assumptions. Currency selection provides a presentation label only and does not perform foreign exchange conversion.
The qualitative Development Risks register supports management review but does not automatically alter modeled project cash flows.
All project assumptions, sample values, financial results and investment outcomes are fictional and intended for demonstration purposes.
Users must independently verify relevant property market data, development budgets, legal requirements, lender conditions, tax assumptions and calculations before making investment decisions.
This product does not constitute financial, investment, legal, accounting, tax, construction or real estate advice.
No physical product will be shipped.
Developed by SheetworksStudio – Premium Financial Models & Investment Decision Tools.
Similar ProductsOther customers were also interested in...



 eFinancialModels
Electric Vehicle (EV) Charging Station Financial M...
With this comprehensive 5- or 10-year monthly tool, investors can assess the viability of setting up... Read more

Financial Model for Mobile App | Mobile App Busine...
The Mobile App Financial Plan Template in Excel allows you to develop financial projections when lau... Read more

 HenrySheykin
Food Truck Financial Model Excel Template
The Food Truck Financial Model helps entrepreneurs, founders, business owners, consultants, and anal... Read more

Green Hydrogen Production from Wind Energy Financi...
The Green Hydrogen from Wind Financial Model aims to comprehensively forecast a horizon of 40 years ... Read more

Simple Mutual Non-Disclosure Agreement Template
Protect your business secrets with ease using our Simple Mutual Non-Disclosure Agreement Template. S... Read more

Solar Energy Financial Model
The Solar Energy Financial Model Spreadsheet Template in Excel assists you in preparing a sophistica... Read more

 Peter Graf
The Customer-Centric Financial Model for Restauran...
Starting a restaurant without a financial plan is like driving a car blindfolded. You wouldn´t do i... Read more
You must log in to submit a review.