
0 ITEMS

SaaS Startup Financial Model (Monthly MRR Forecast, Cap Table, Funding Rounds, SaaS Metrics, Valuation and Investor Returns)
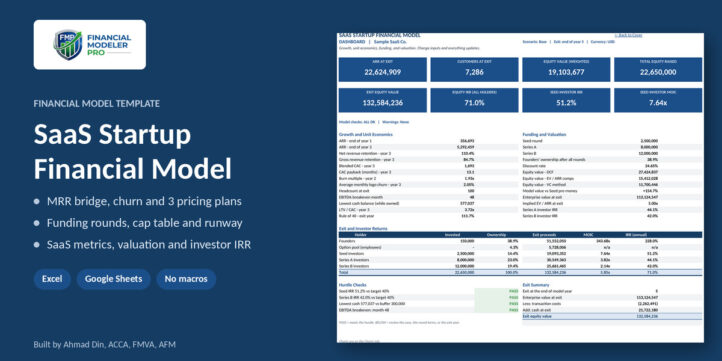
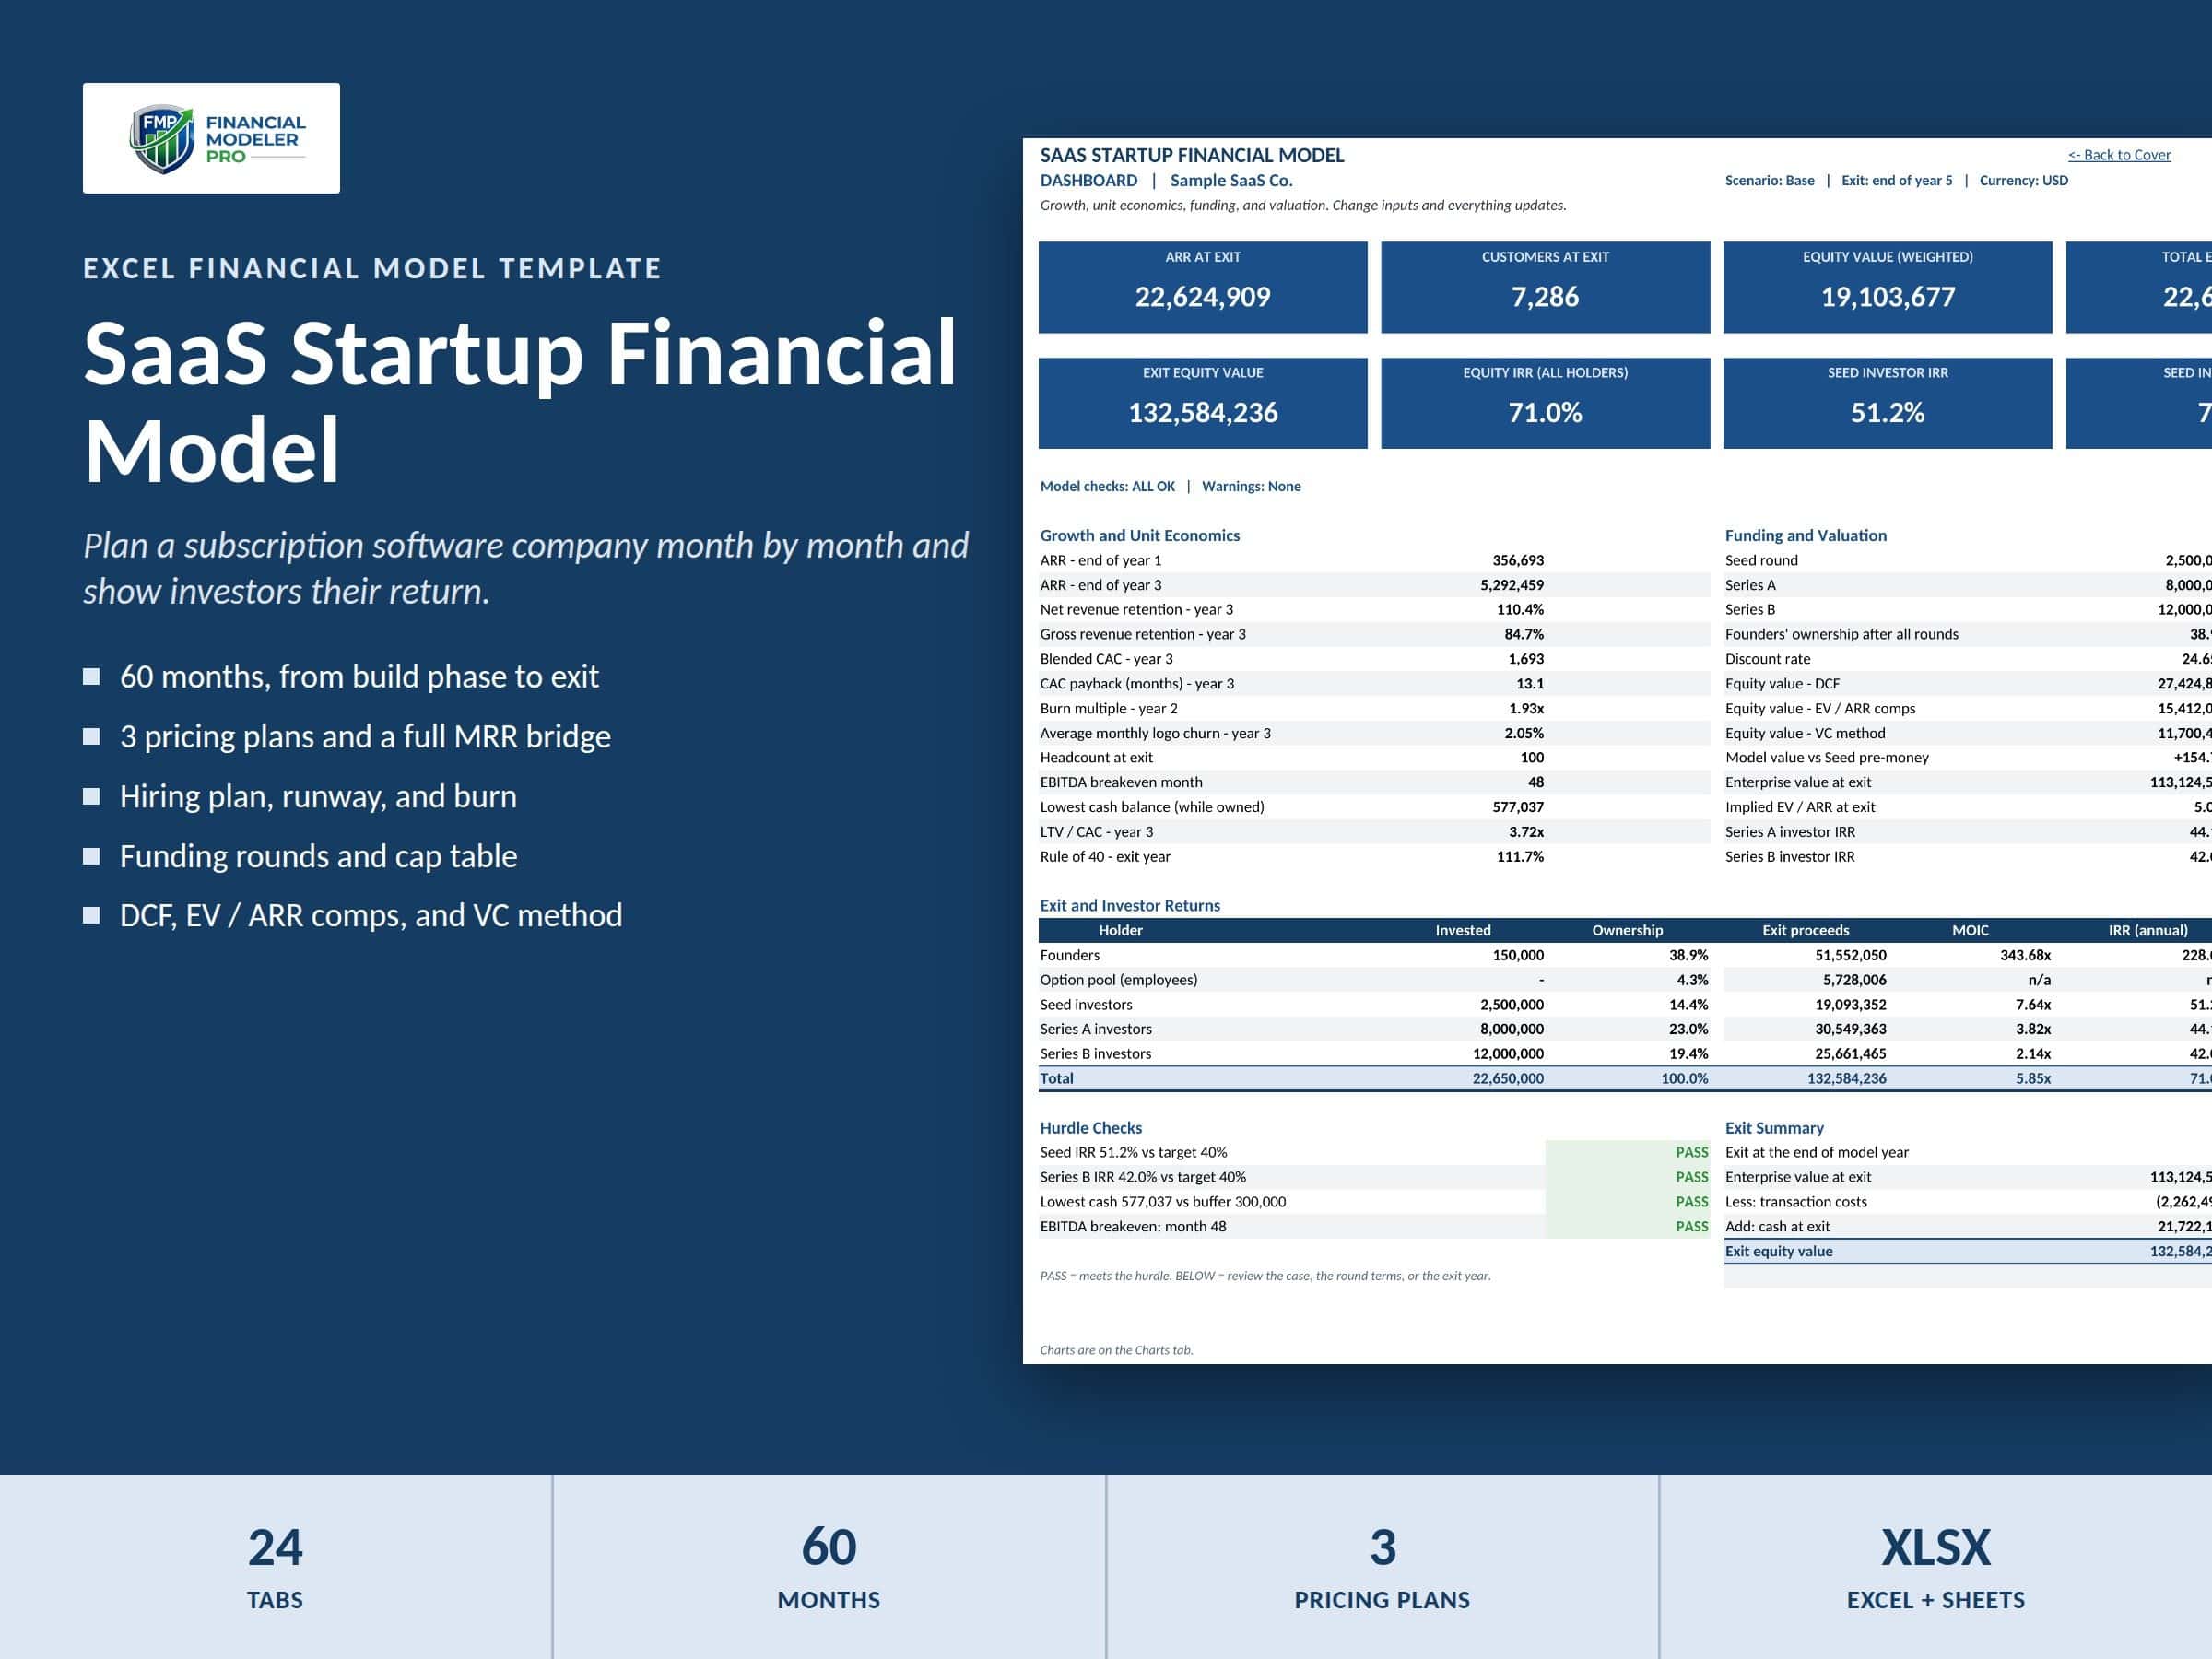
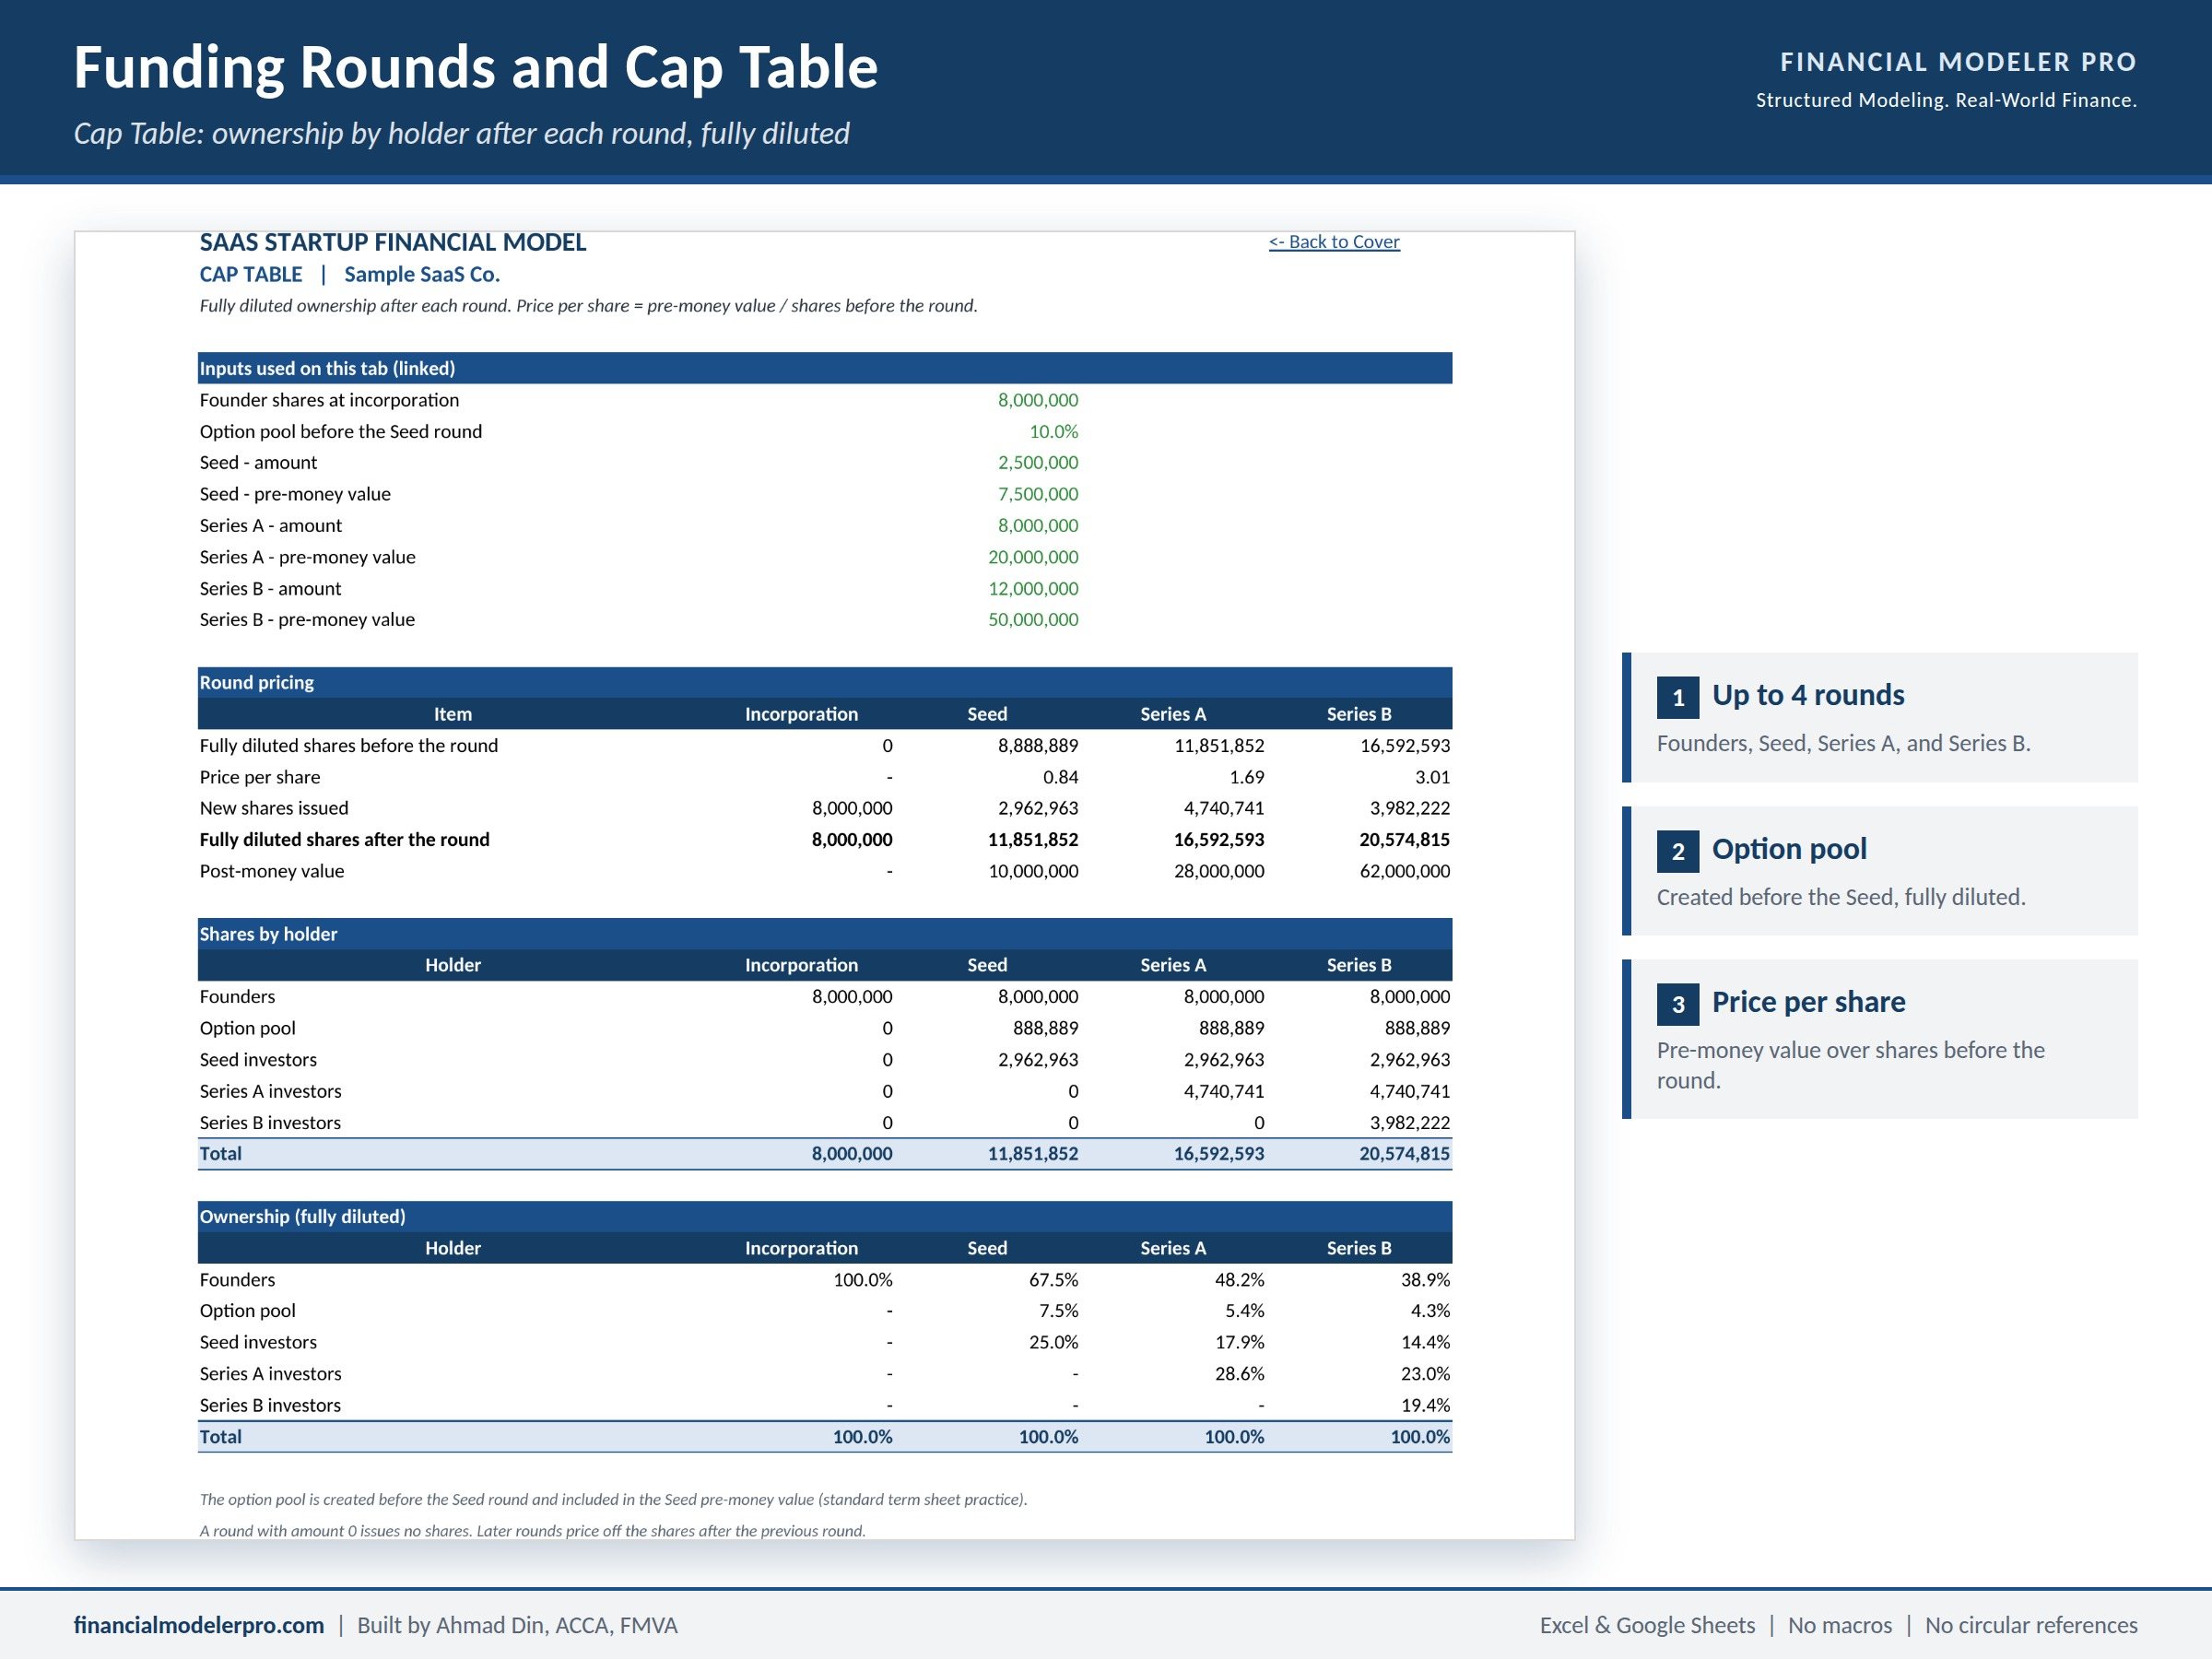
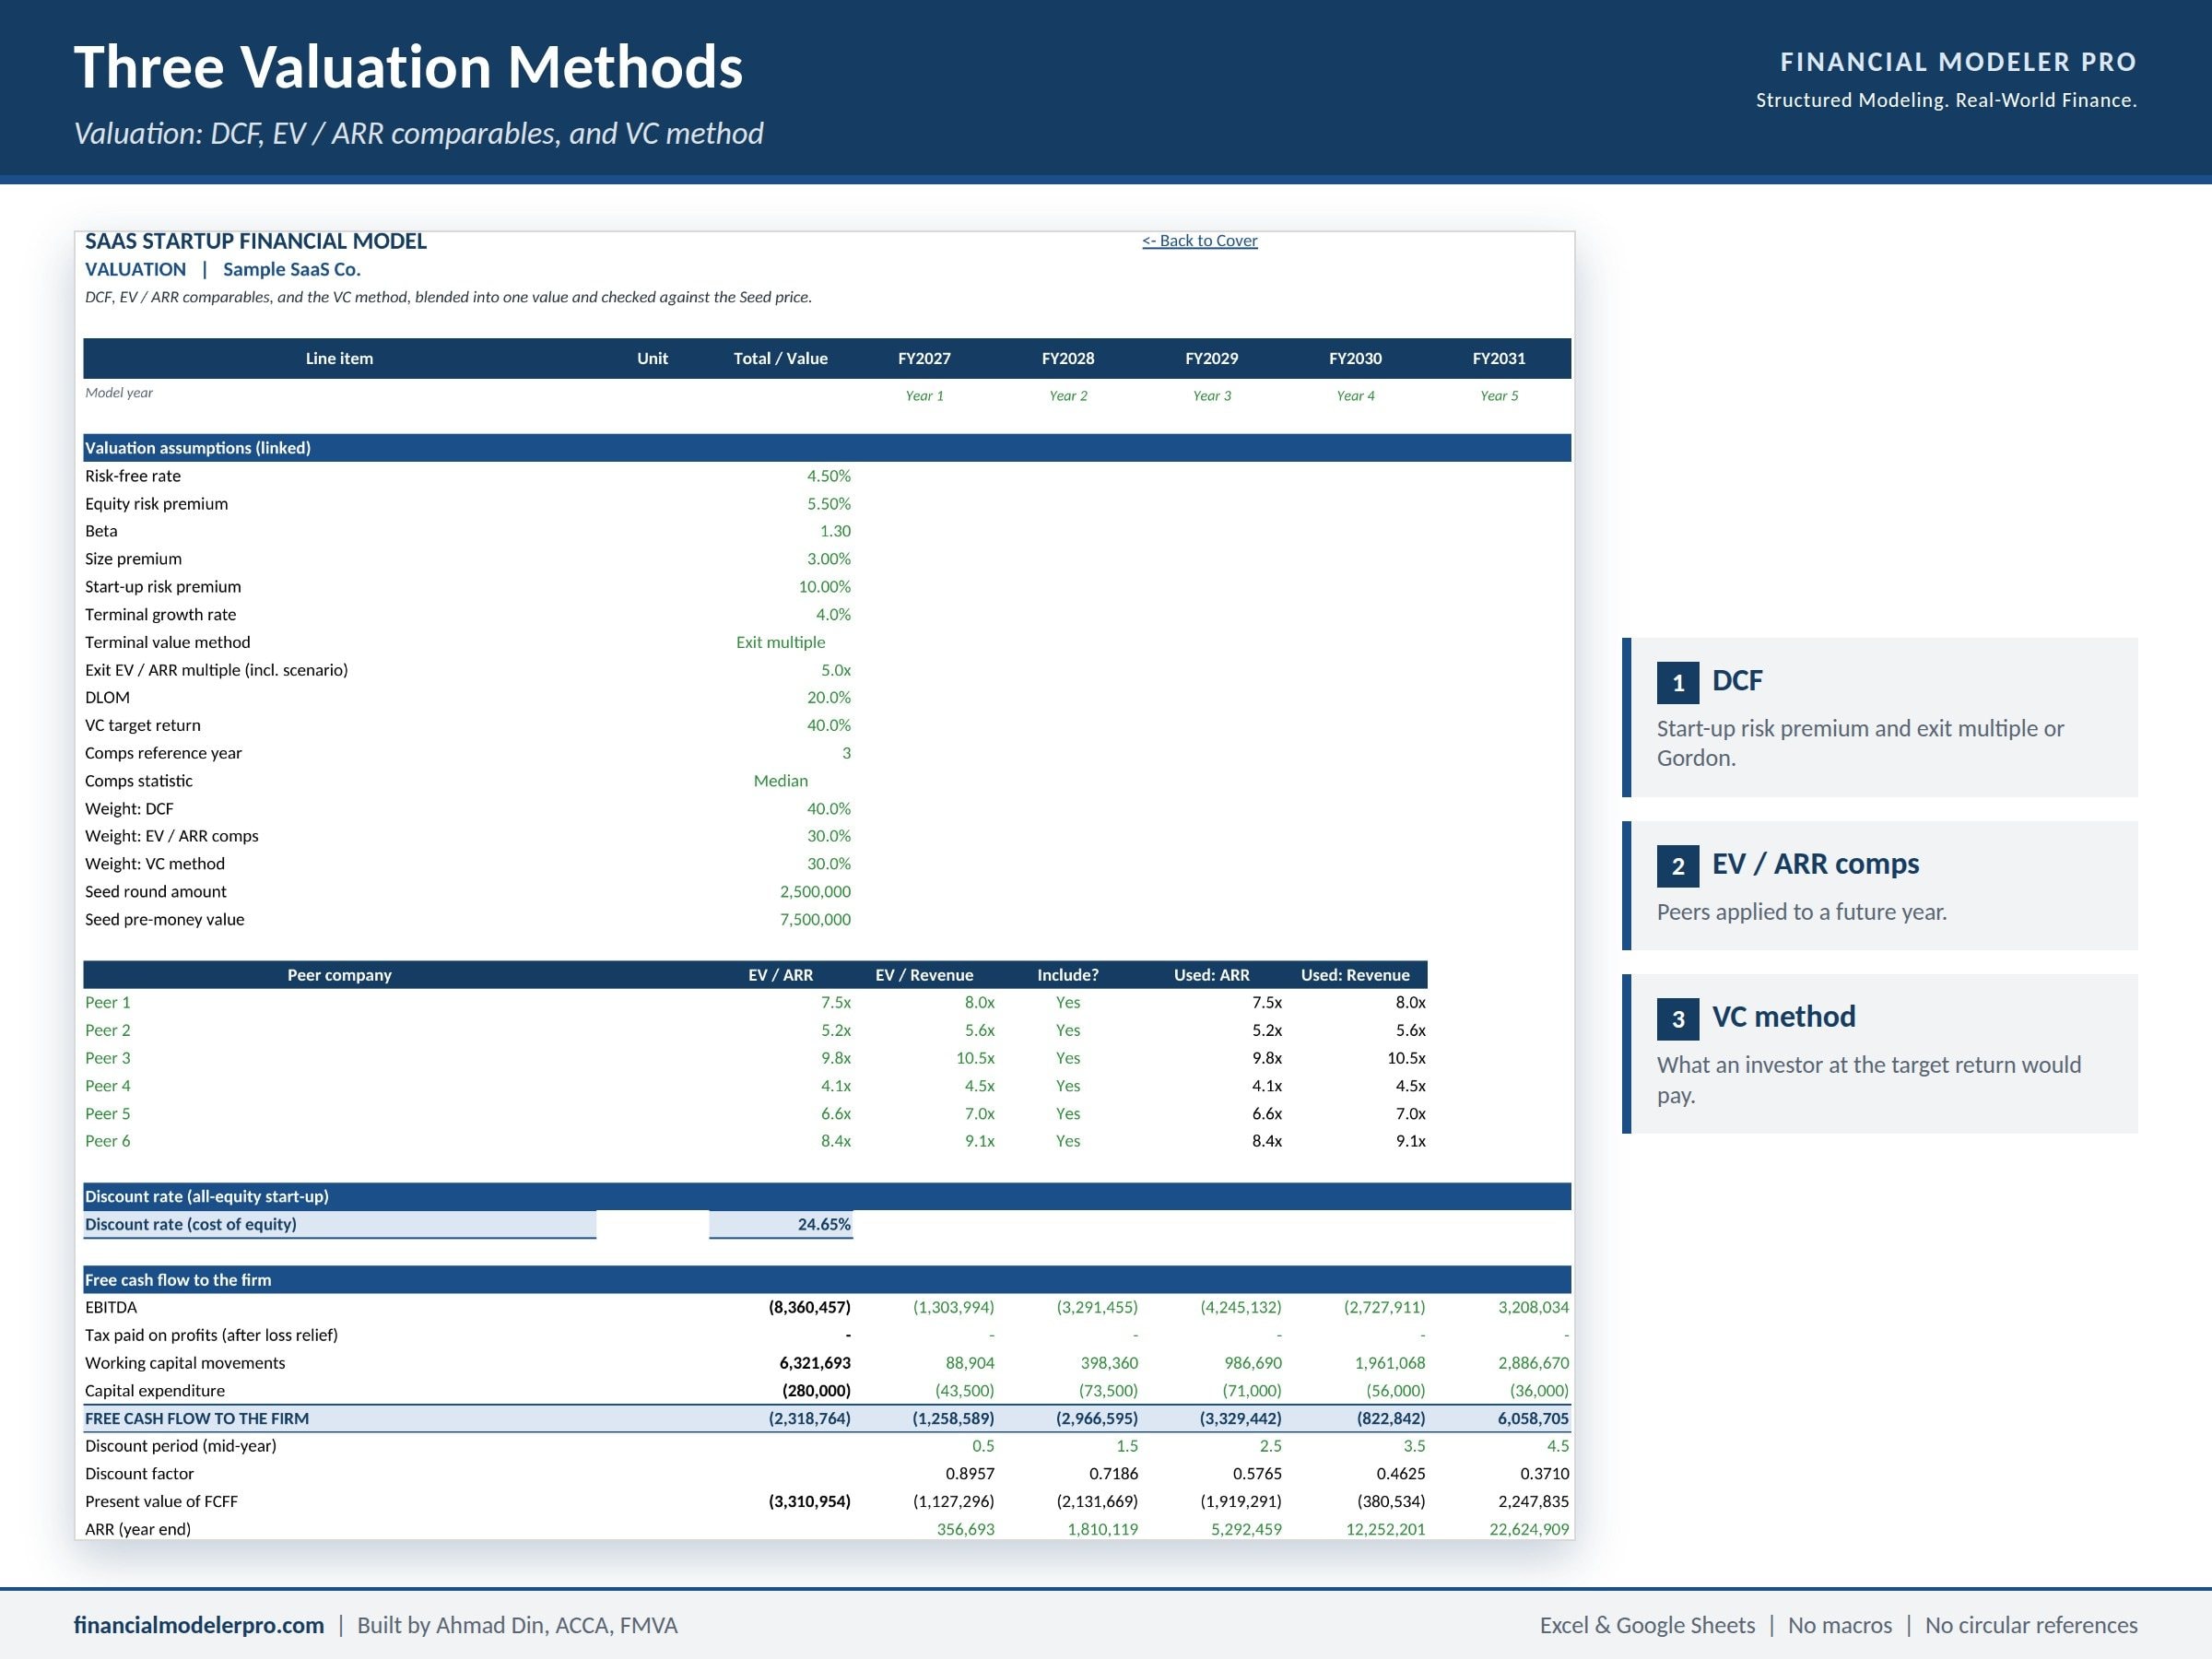
Plan a subscription software company month by month for five years, from the build phase before launch to the exit. The model covers three pricing plans, a customer engine and MRR bridge, a hiring plan, cash runway, up to four funding rounds with a full cap table, and the SaaS metrics investors ask for: ARR, NRR, GRR, CAC, LTV / CAC, payback, burn multiple, and Rule of 40. It values the company three ways and shows the IRR and multiple for each investor. Works in Excel and Google Sheets, with no macros.
What is this model used for?
This template is for founders and finance leads of subscription software companies, from pre-launch to Series B. It turns a pricing page, a hiring plan, and a funding plan into the numbers an investor will ask for: how fast revenue grows, how long the cash lasts, how much of the company each round costs, and what everyone gets back at exit.
Use it for a fundraising deck or data room, a board budget, a runway check before hiring, or a quick test of a new pricing plan. The sample case is a B2B SaaS company in USD, and every figure can be replaced with your own.
What is included?
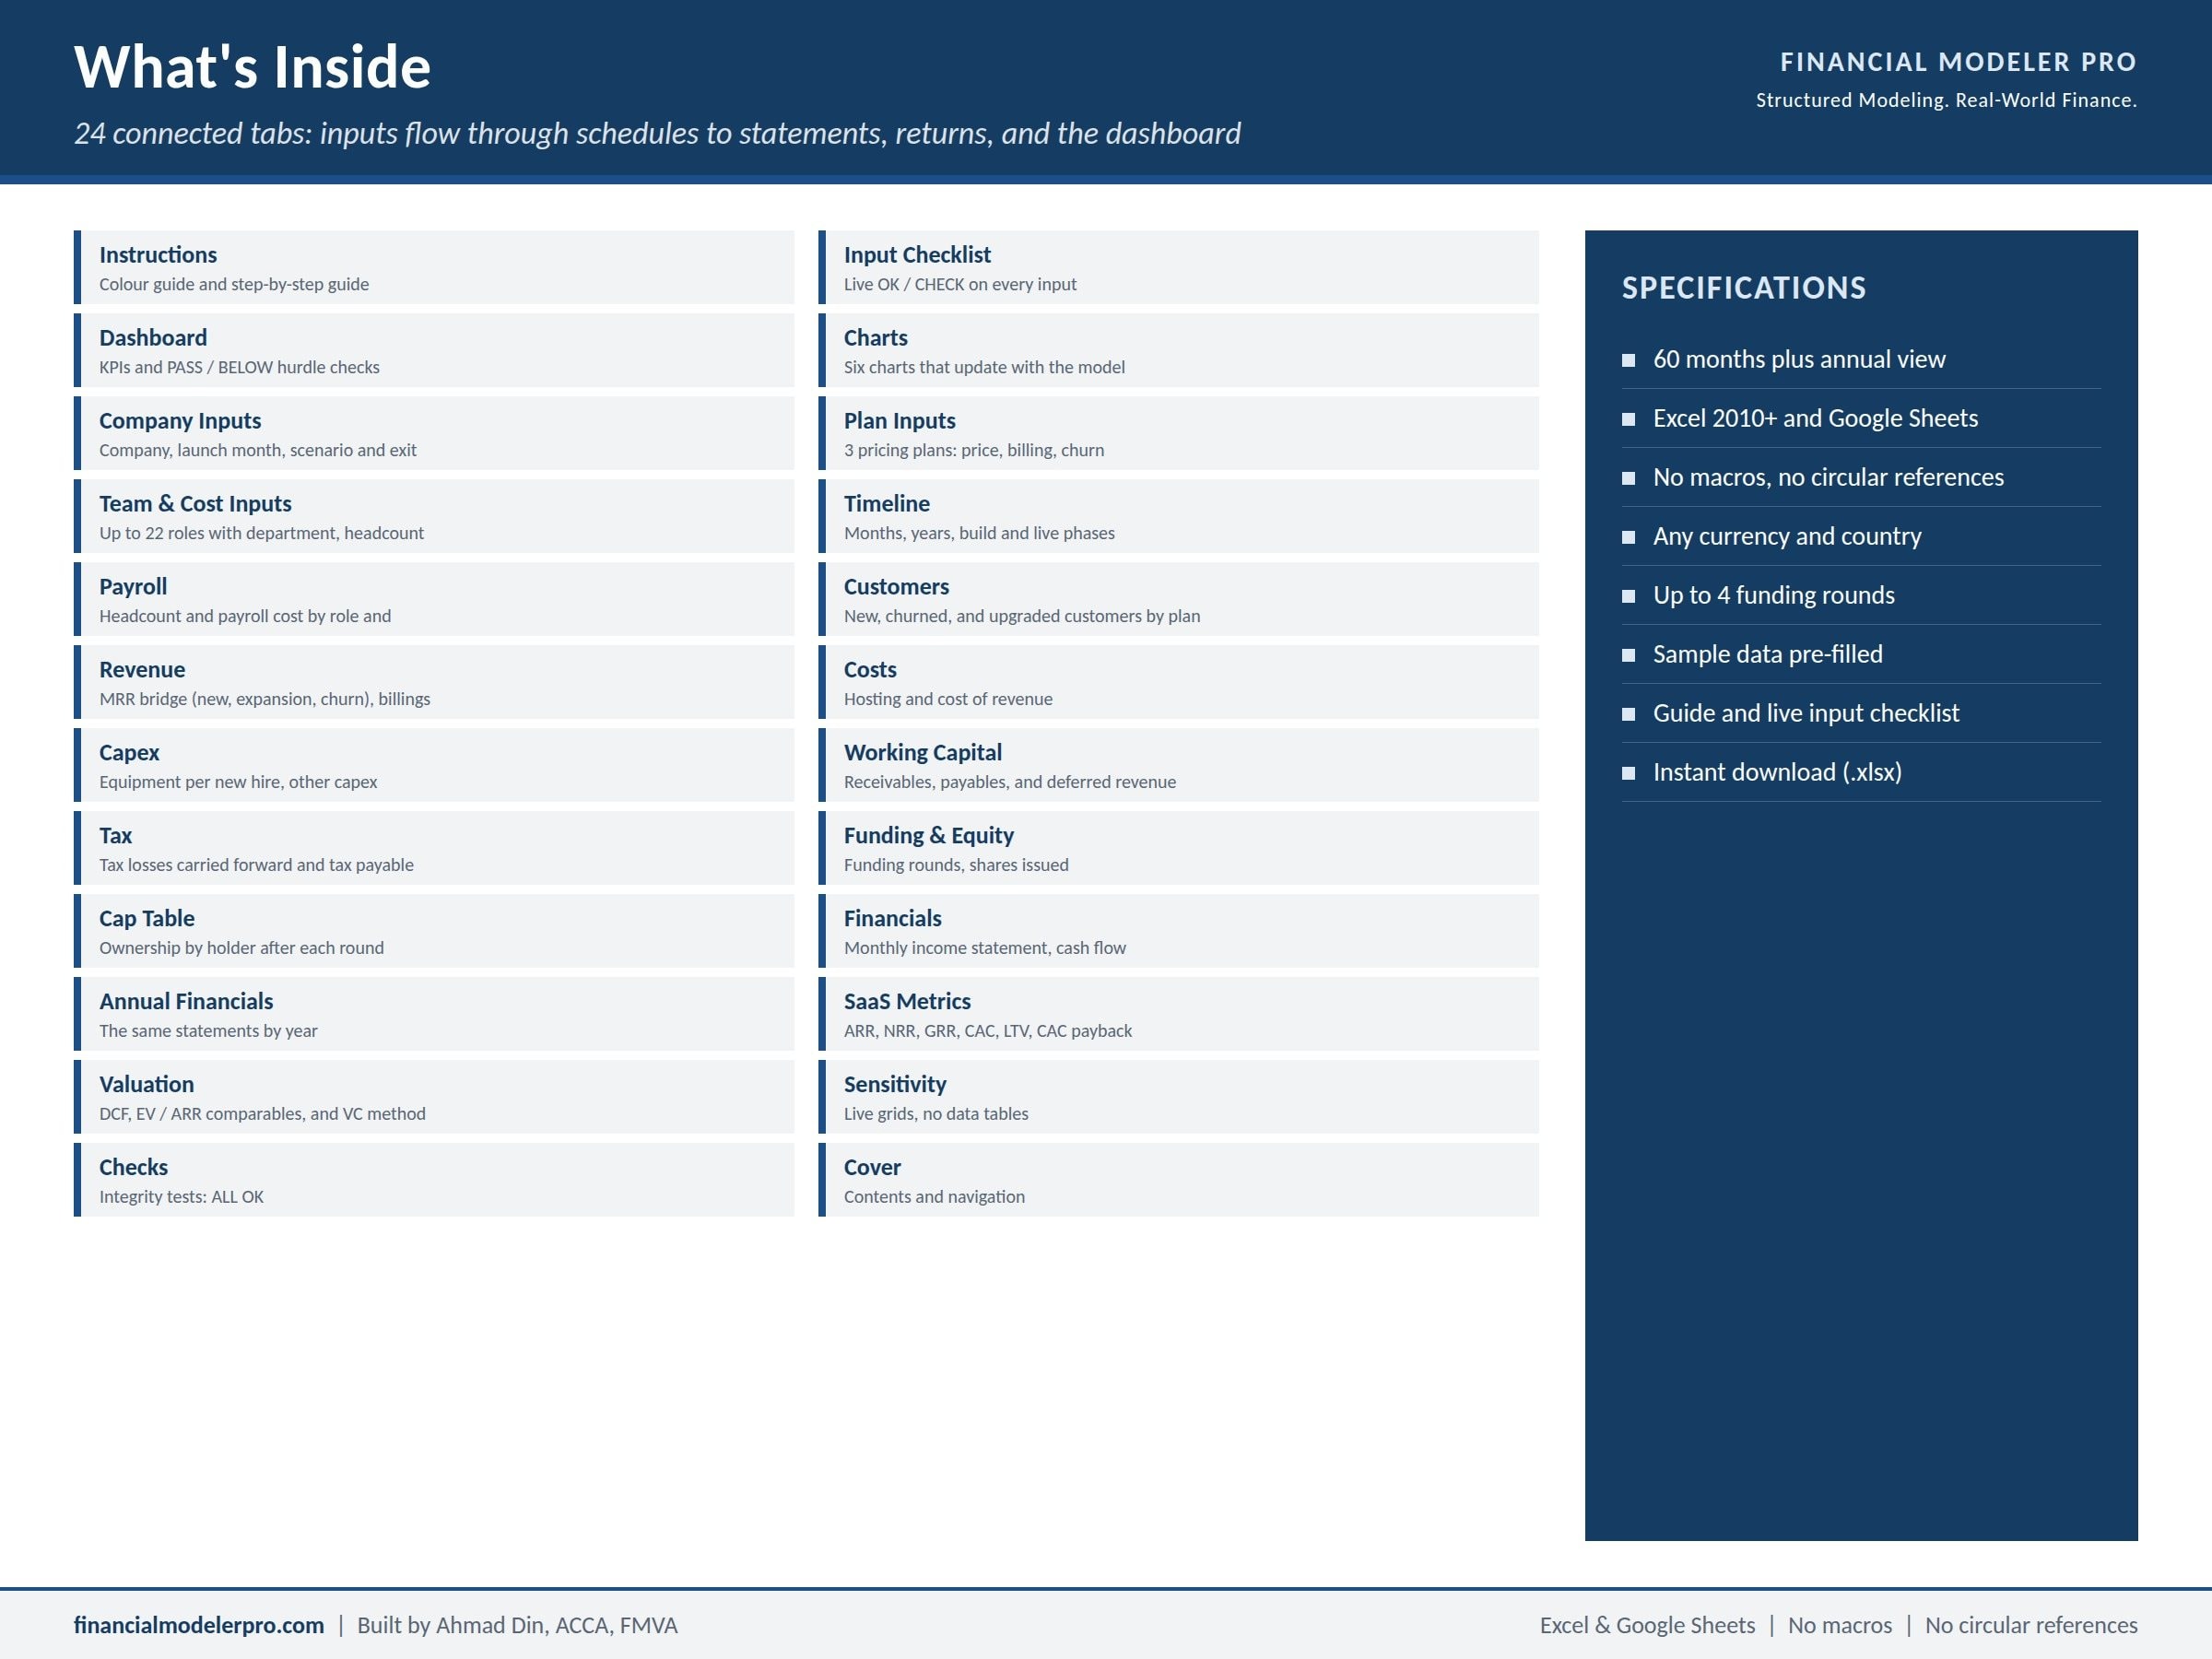
One Excel workbook with 24 linked tabs:
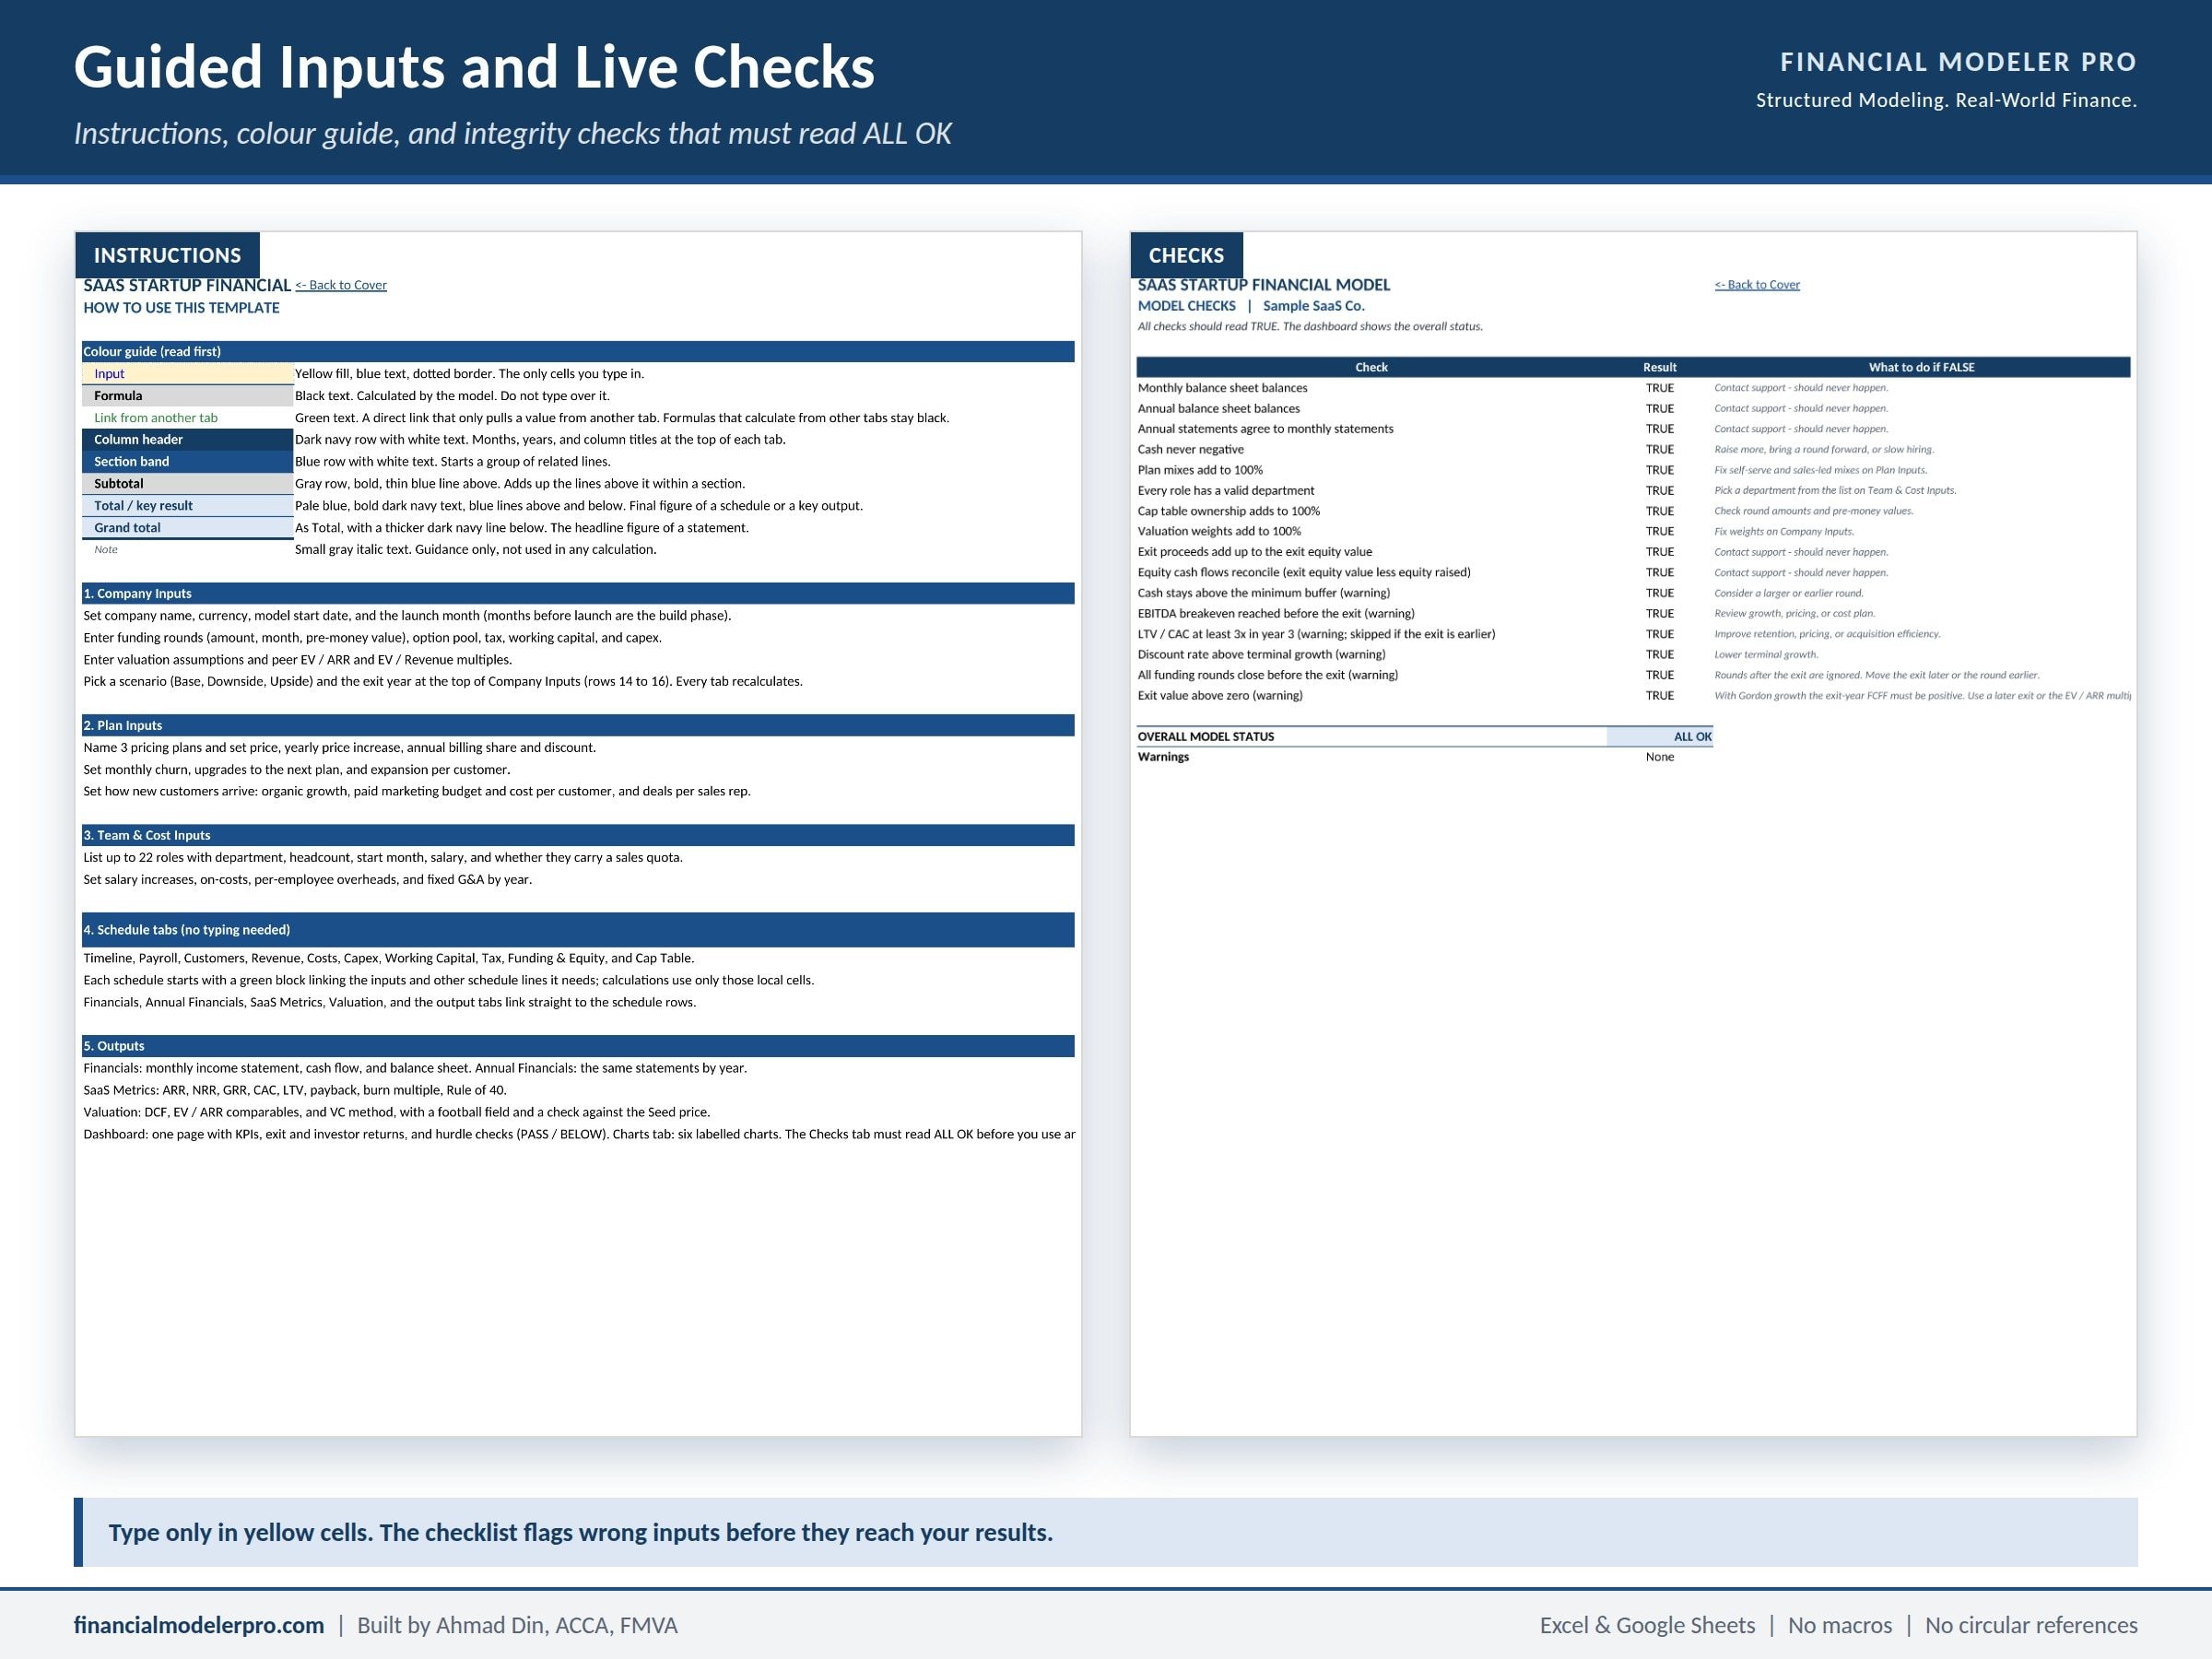
- Cover, Instructions, and an Input Checklist that shows OK or CHECK for each input group
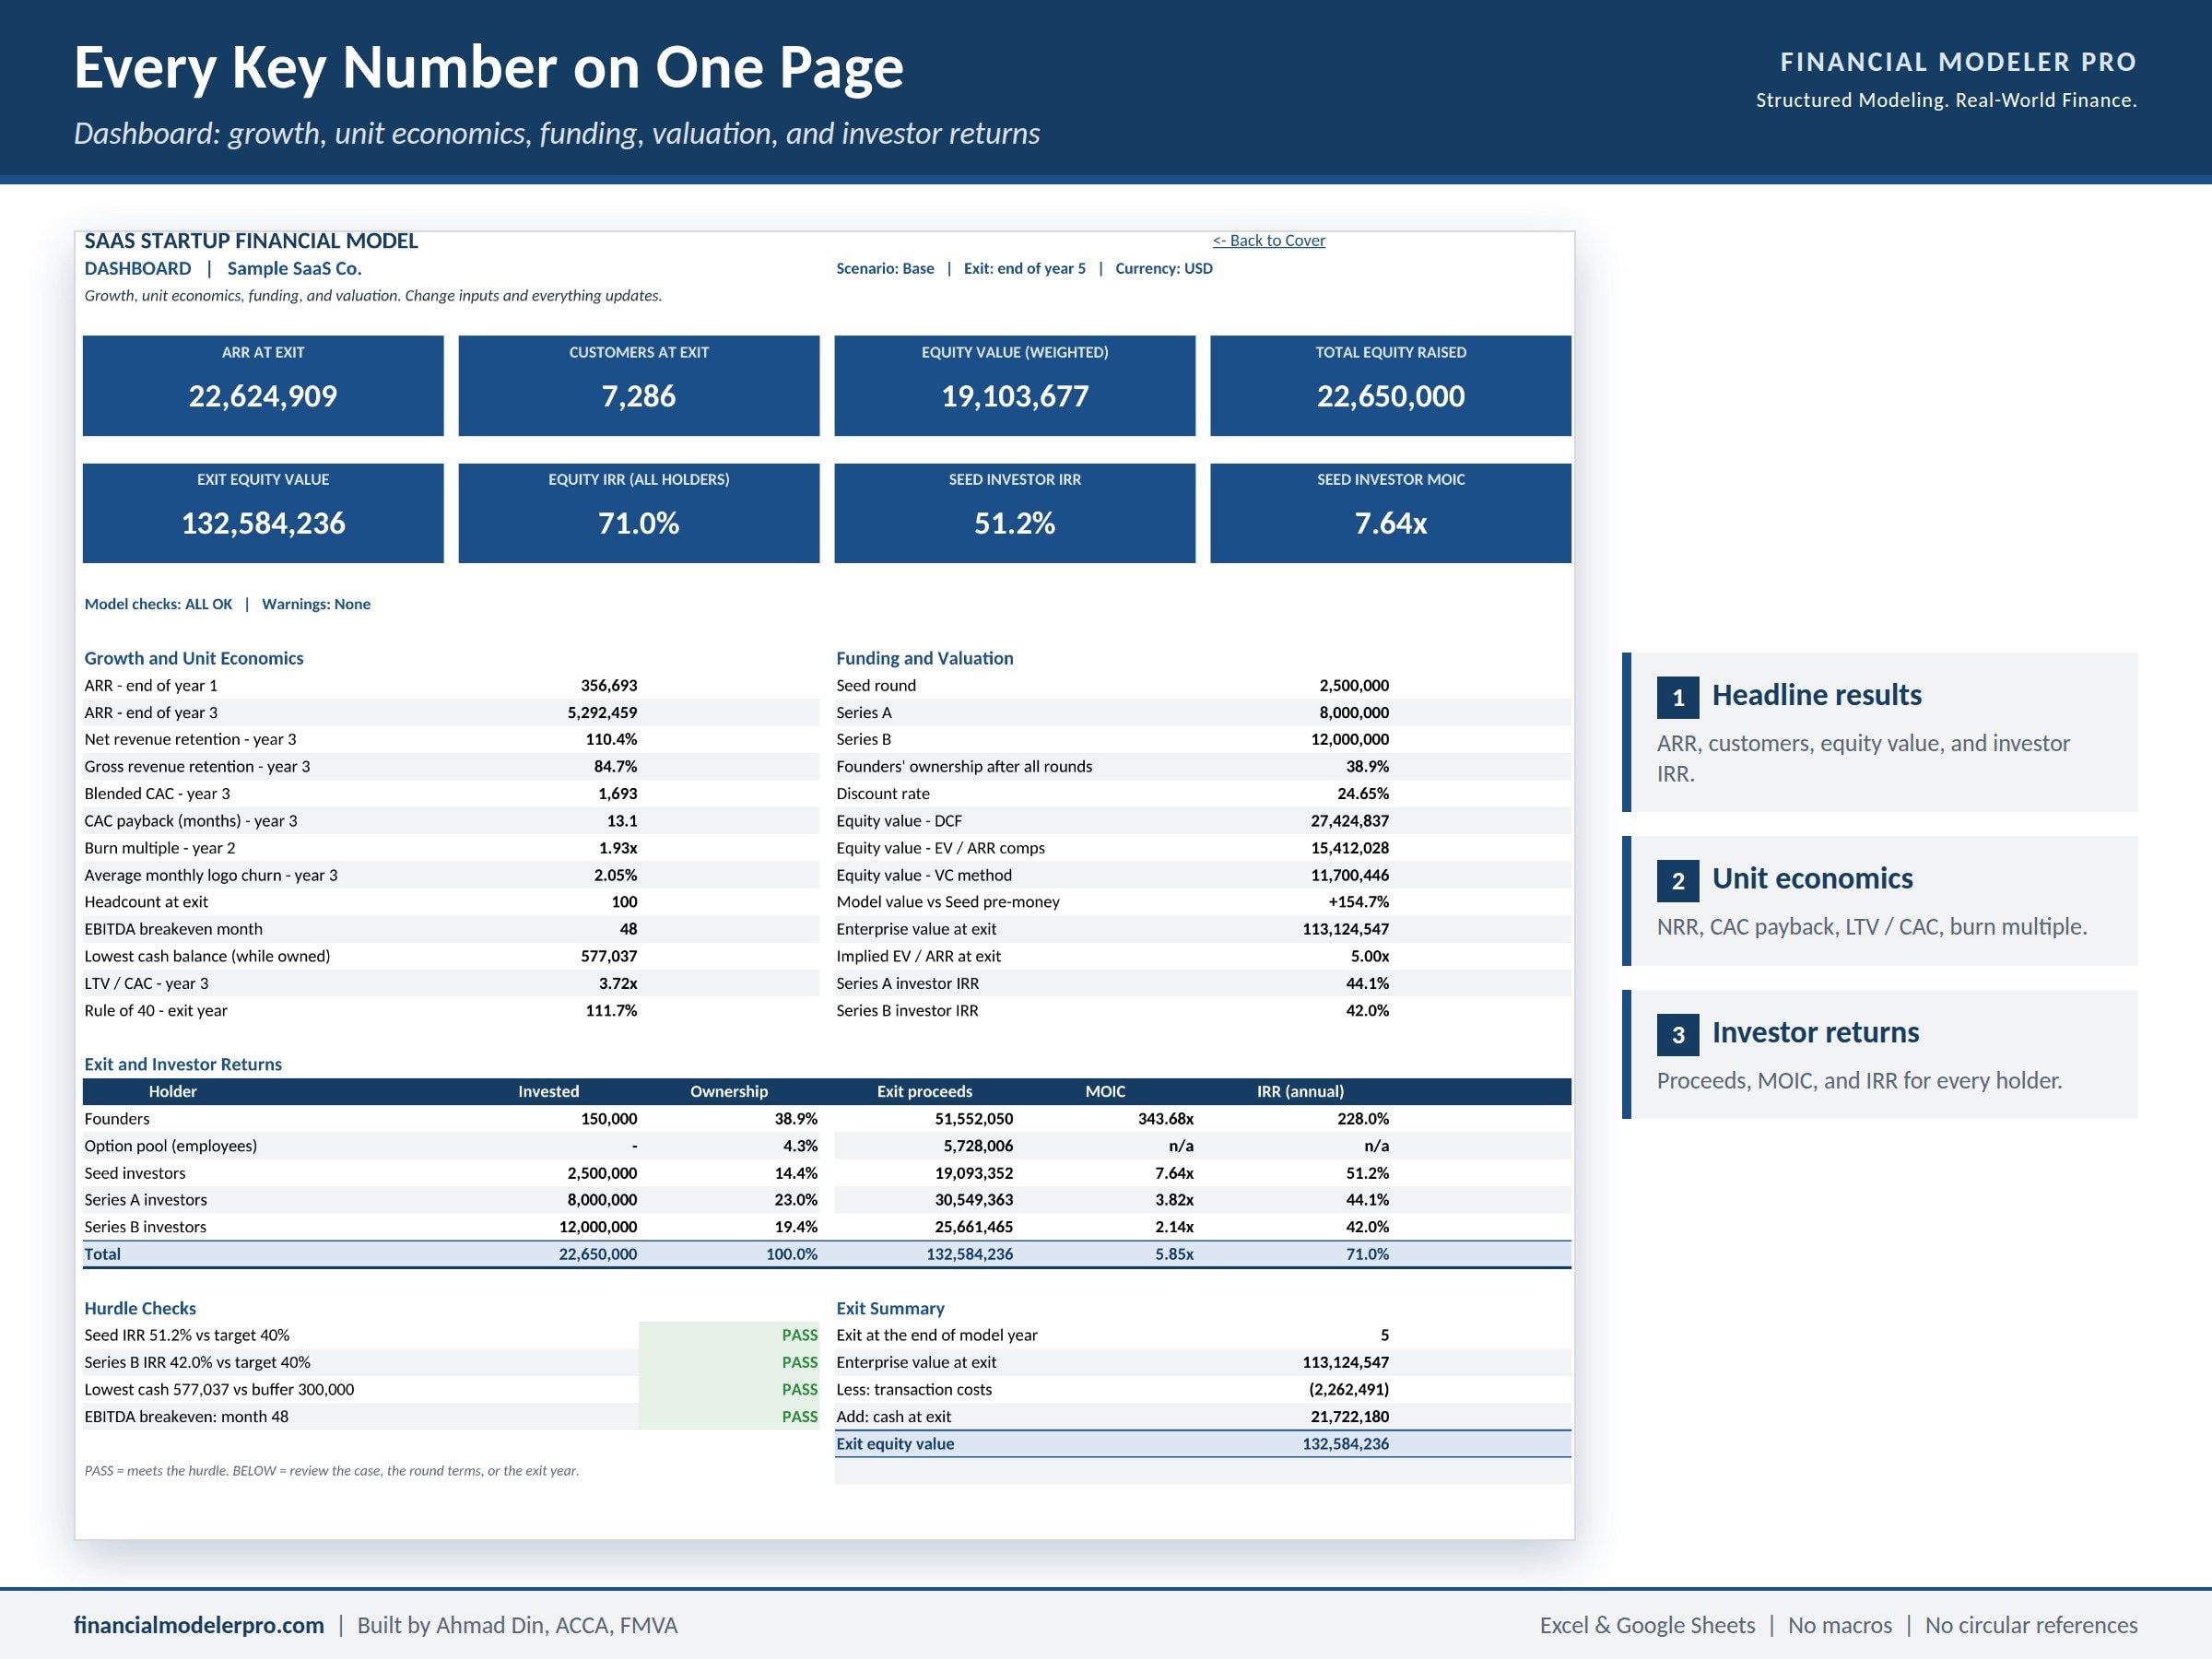
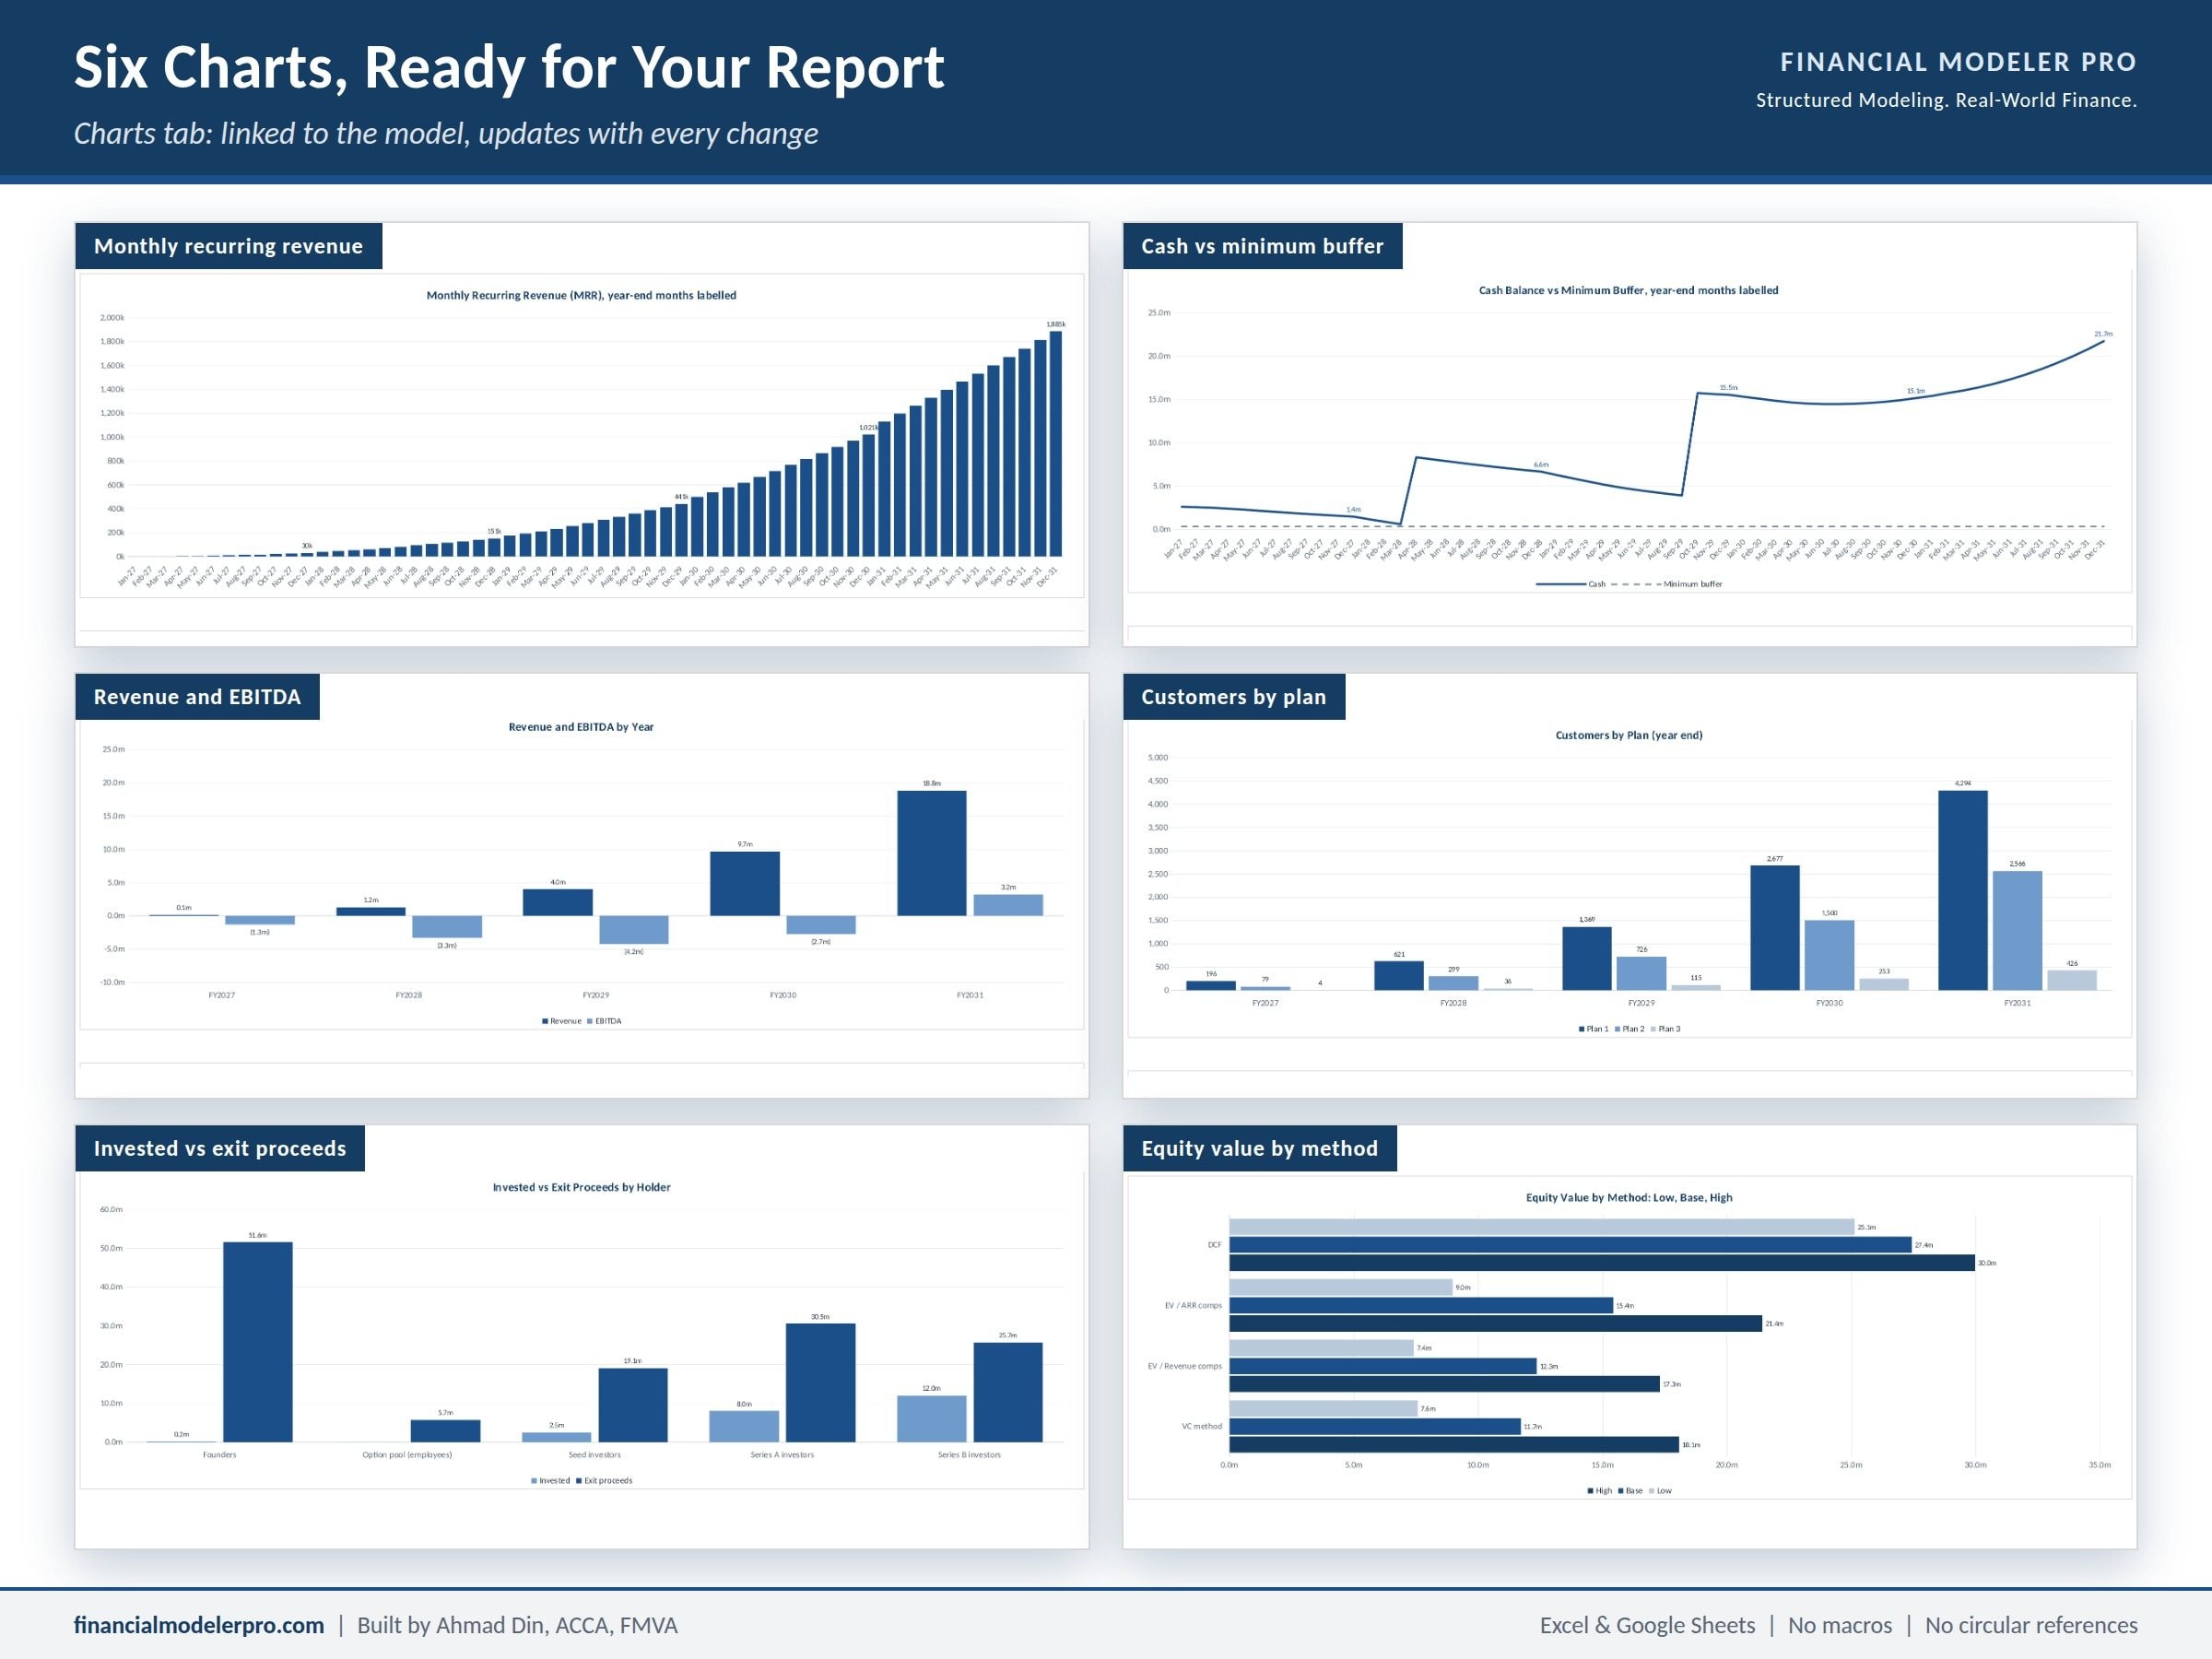
- Dashboard with eight headline KPIs, exit and investor returns, and hurdle checks, plus a Charts tab with six charts
- Company Inputs: launch month, funding rounds, option pool, tax, valuation, peers, scenario, and exit year
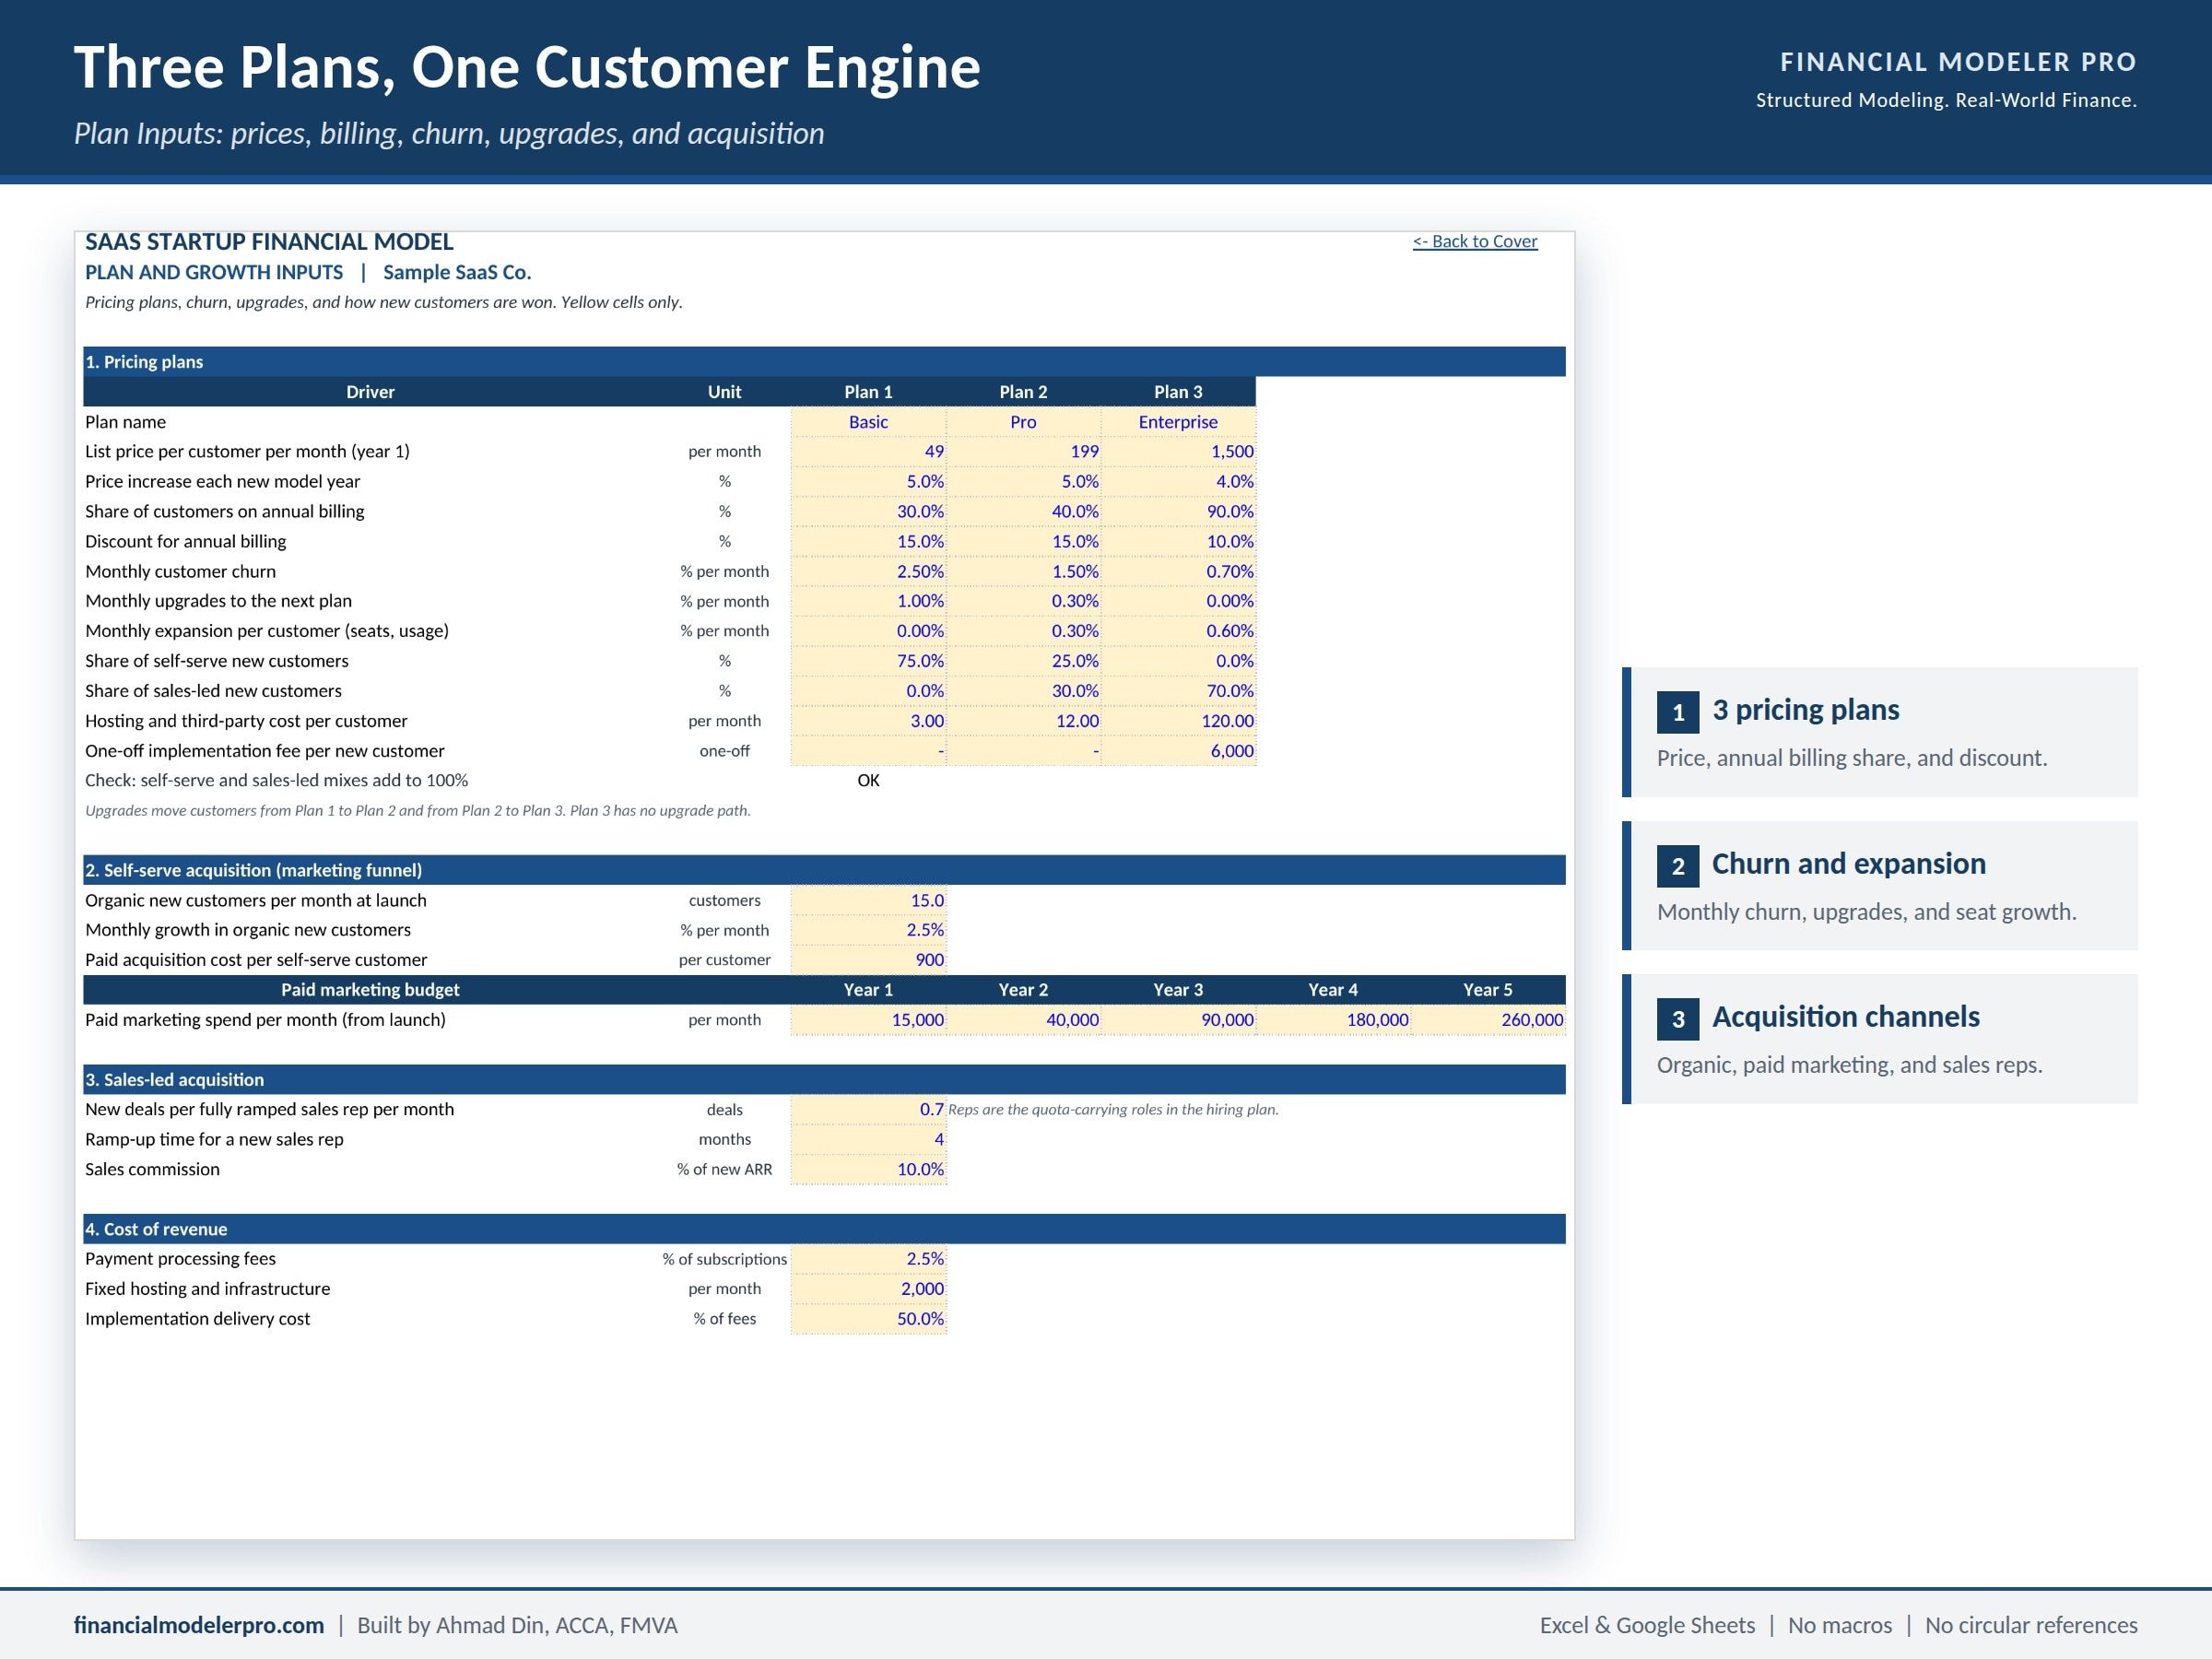
- Plan Inputs: three pricing plans, billing, churn, upgrades, expansion, and customer acquisition
- Team & Cost Inputs: roles, headcount, start months, salaries, and overheads
- Timeline, Payroll, Customers, Revenue, Costs, Capex, Working Capital, Tax, and Funding & Equity schedules
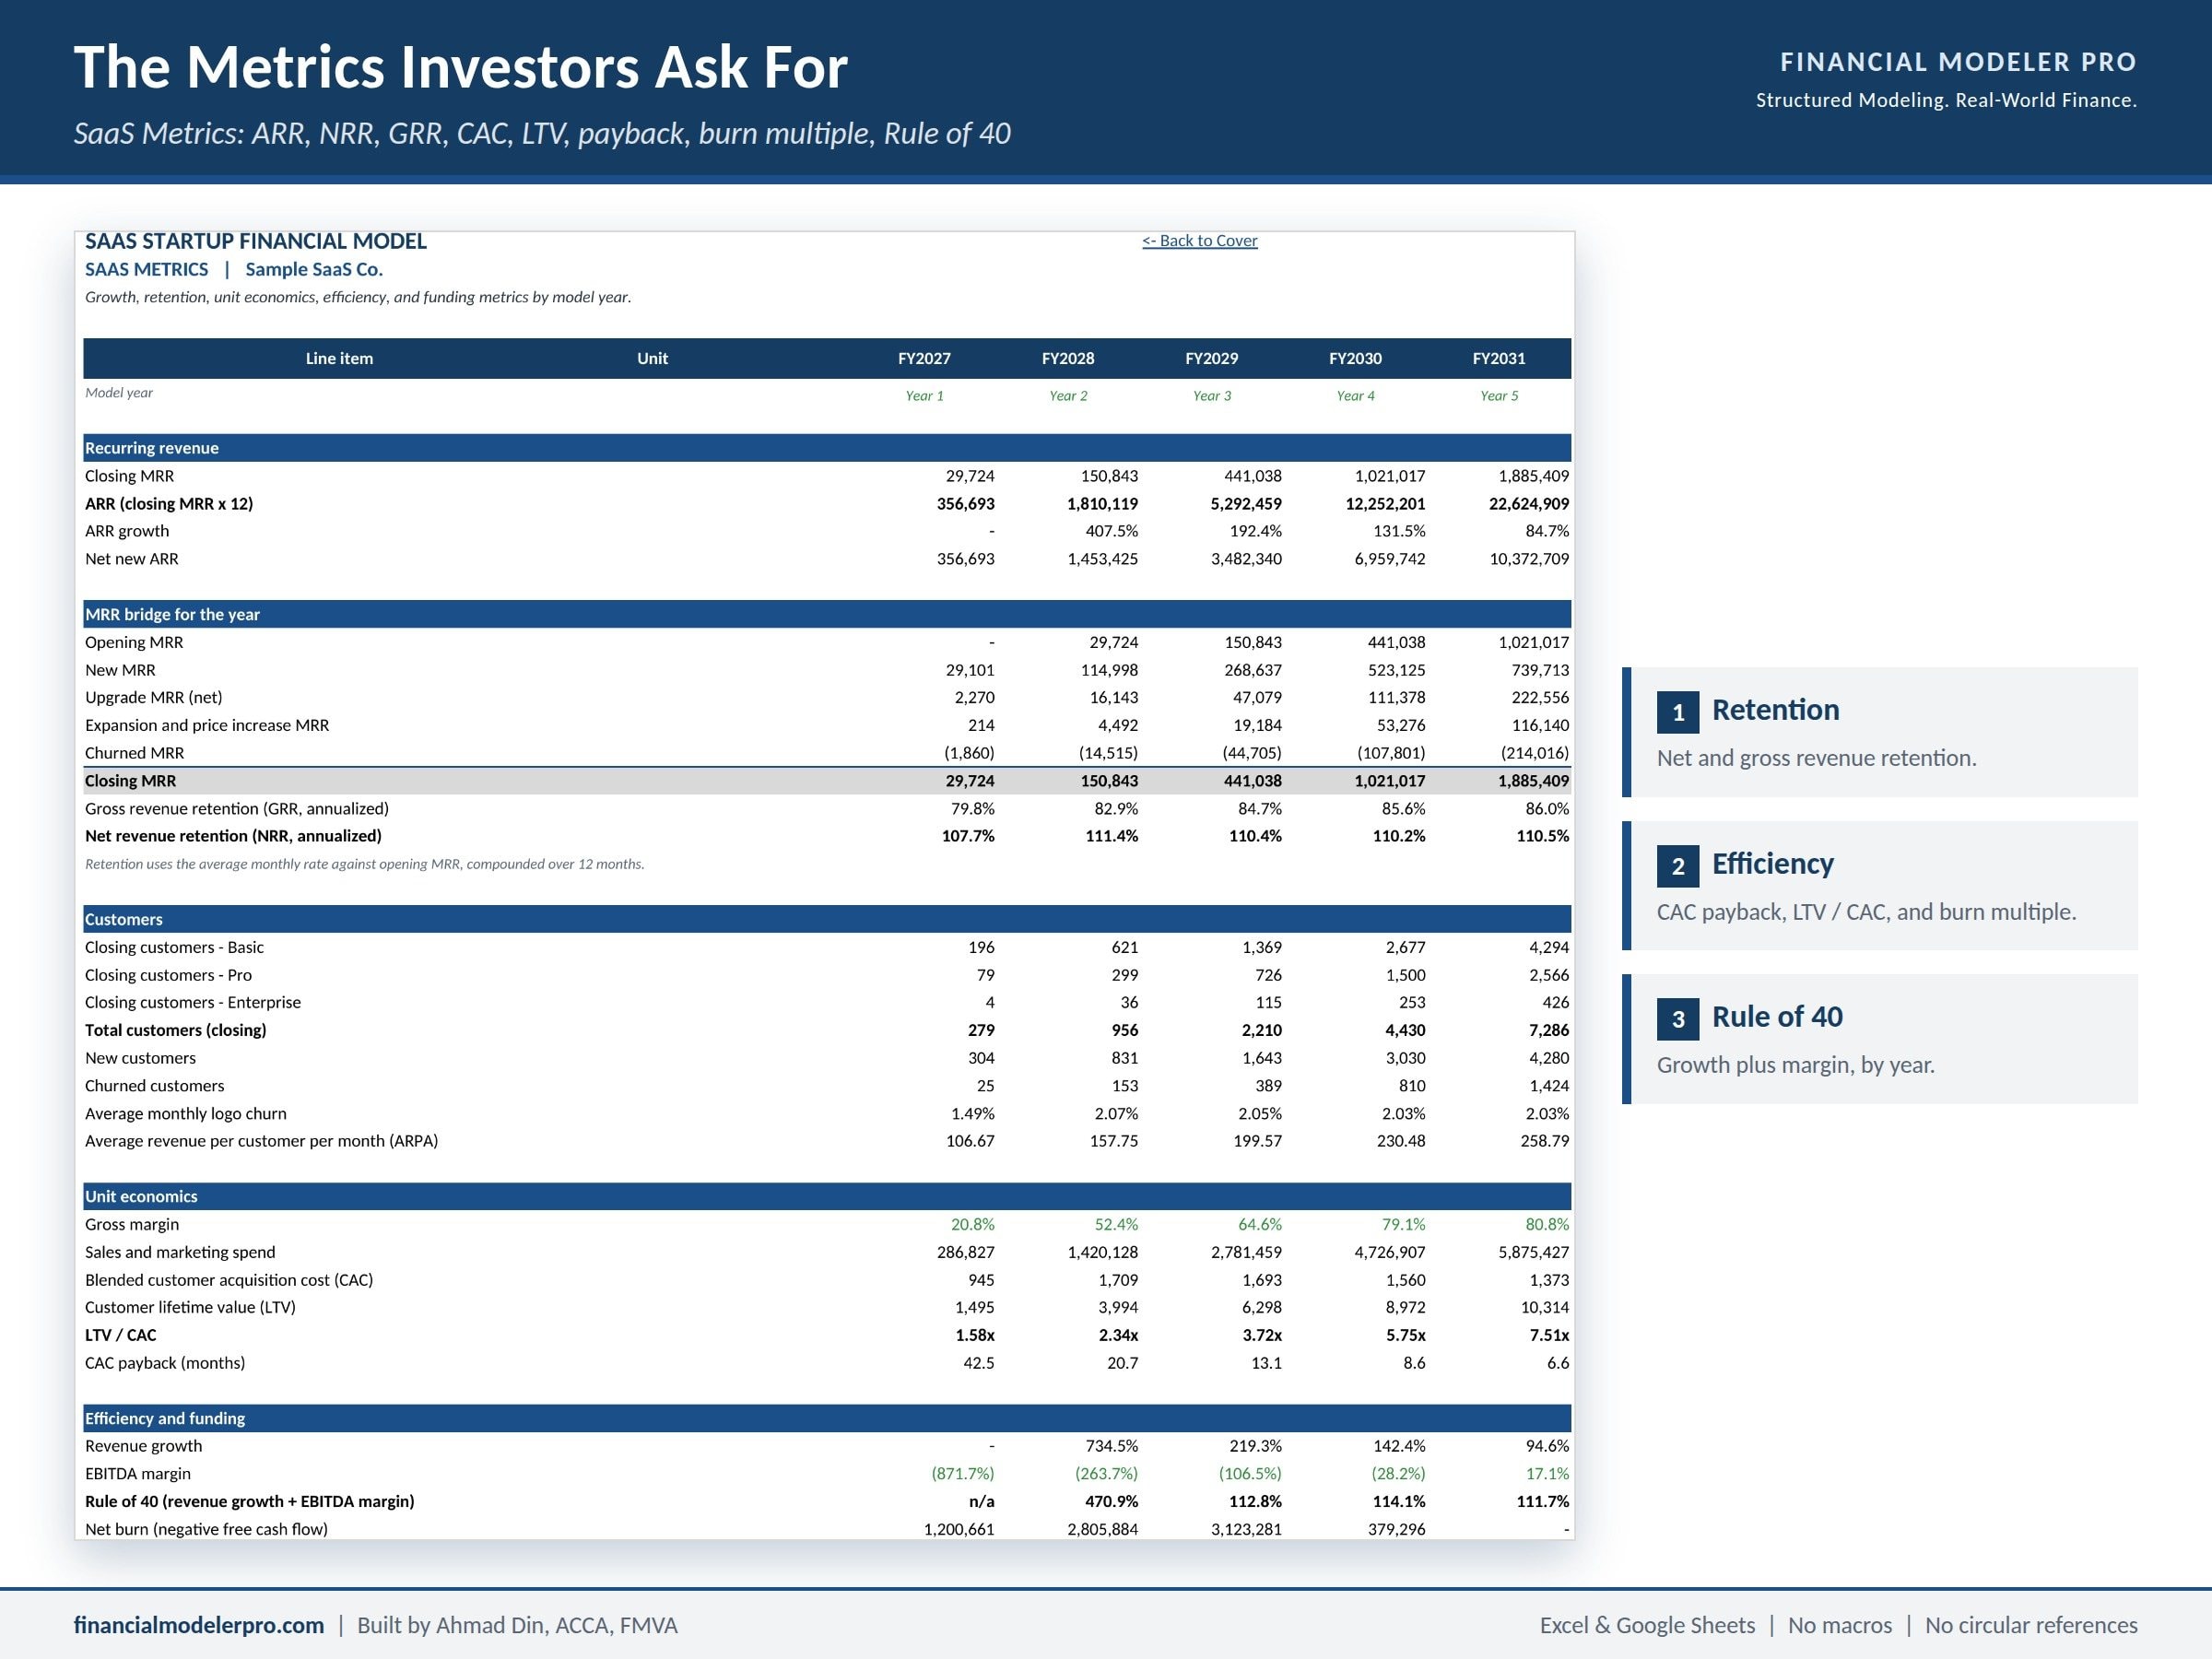
- Cap Table, Financials (monthly), Annual Financials, and SaaS Metrics
- Valuation, Sensitivity, and Checks
Main features
- 60 monthly periods with annual summaries, and a build phase before the product launches
- Three pricing plans, each with its own price, yearly price increase, annual billing share, and discount
- Churn, upgrades to the next plan, and expansion revenue per customer
- Customer engine with three sources: organic growth, paid marketing (budget and cost per customer), and deals per sales rep
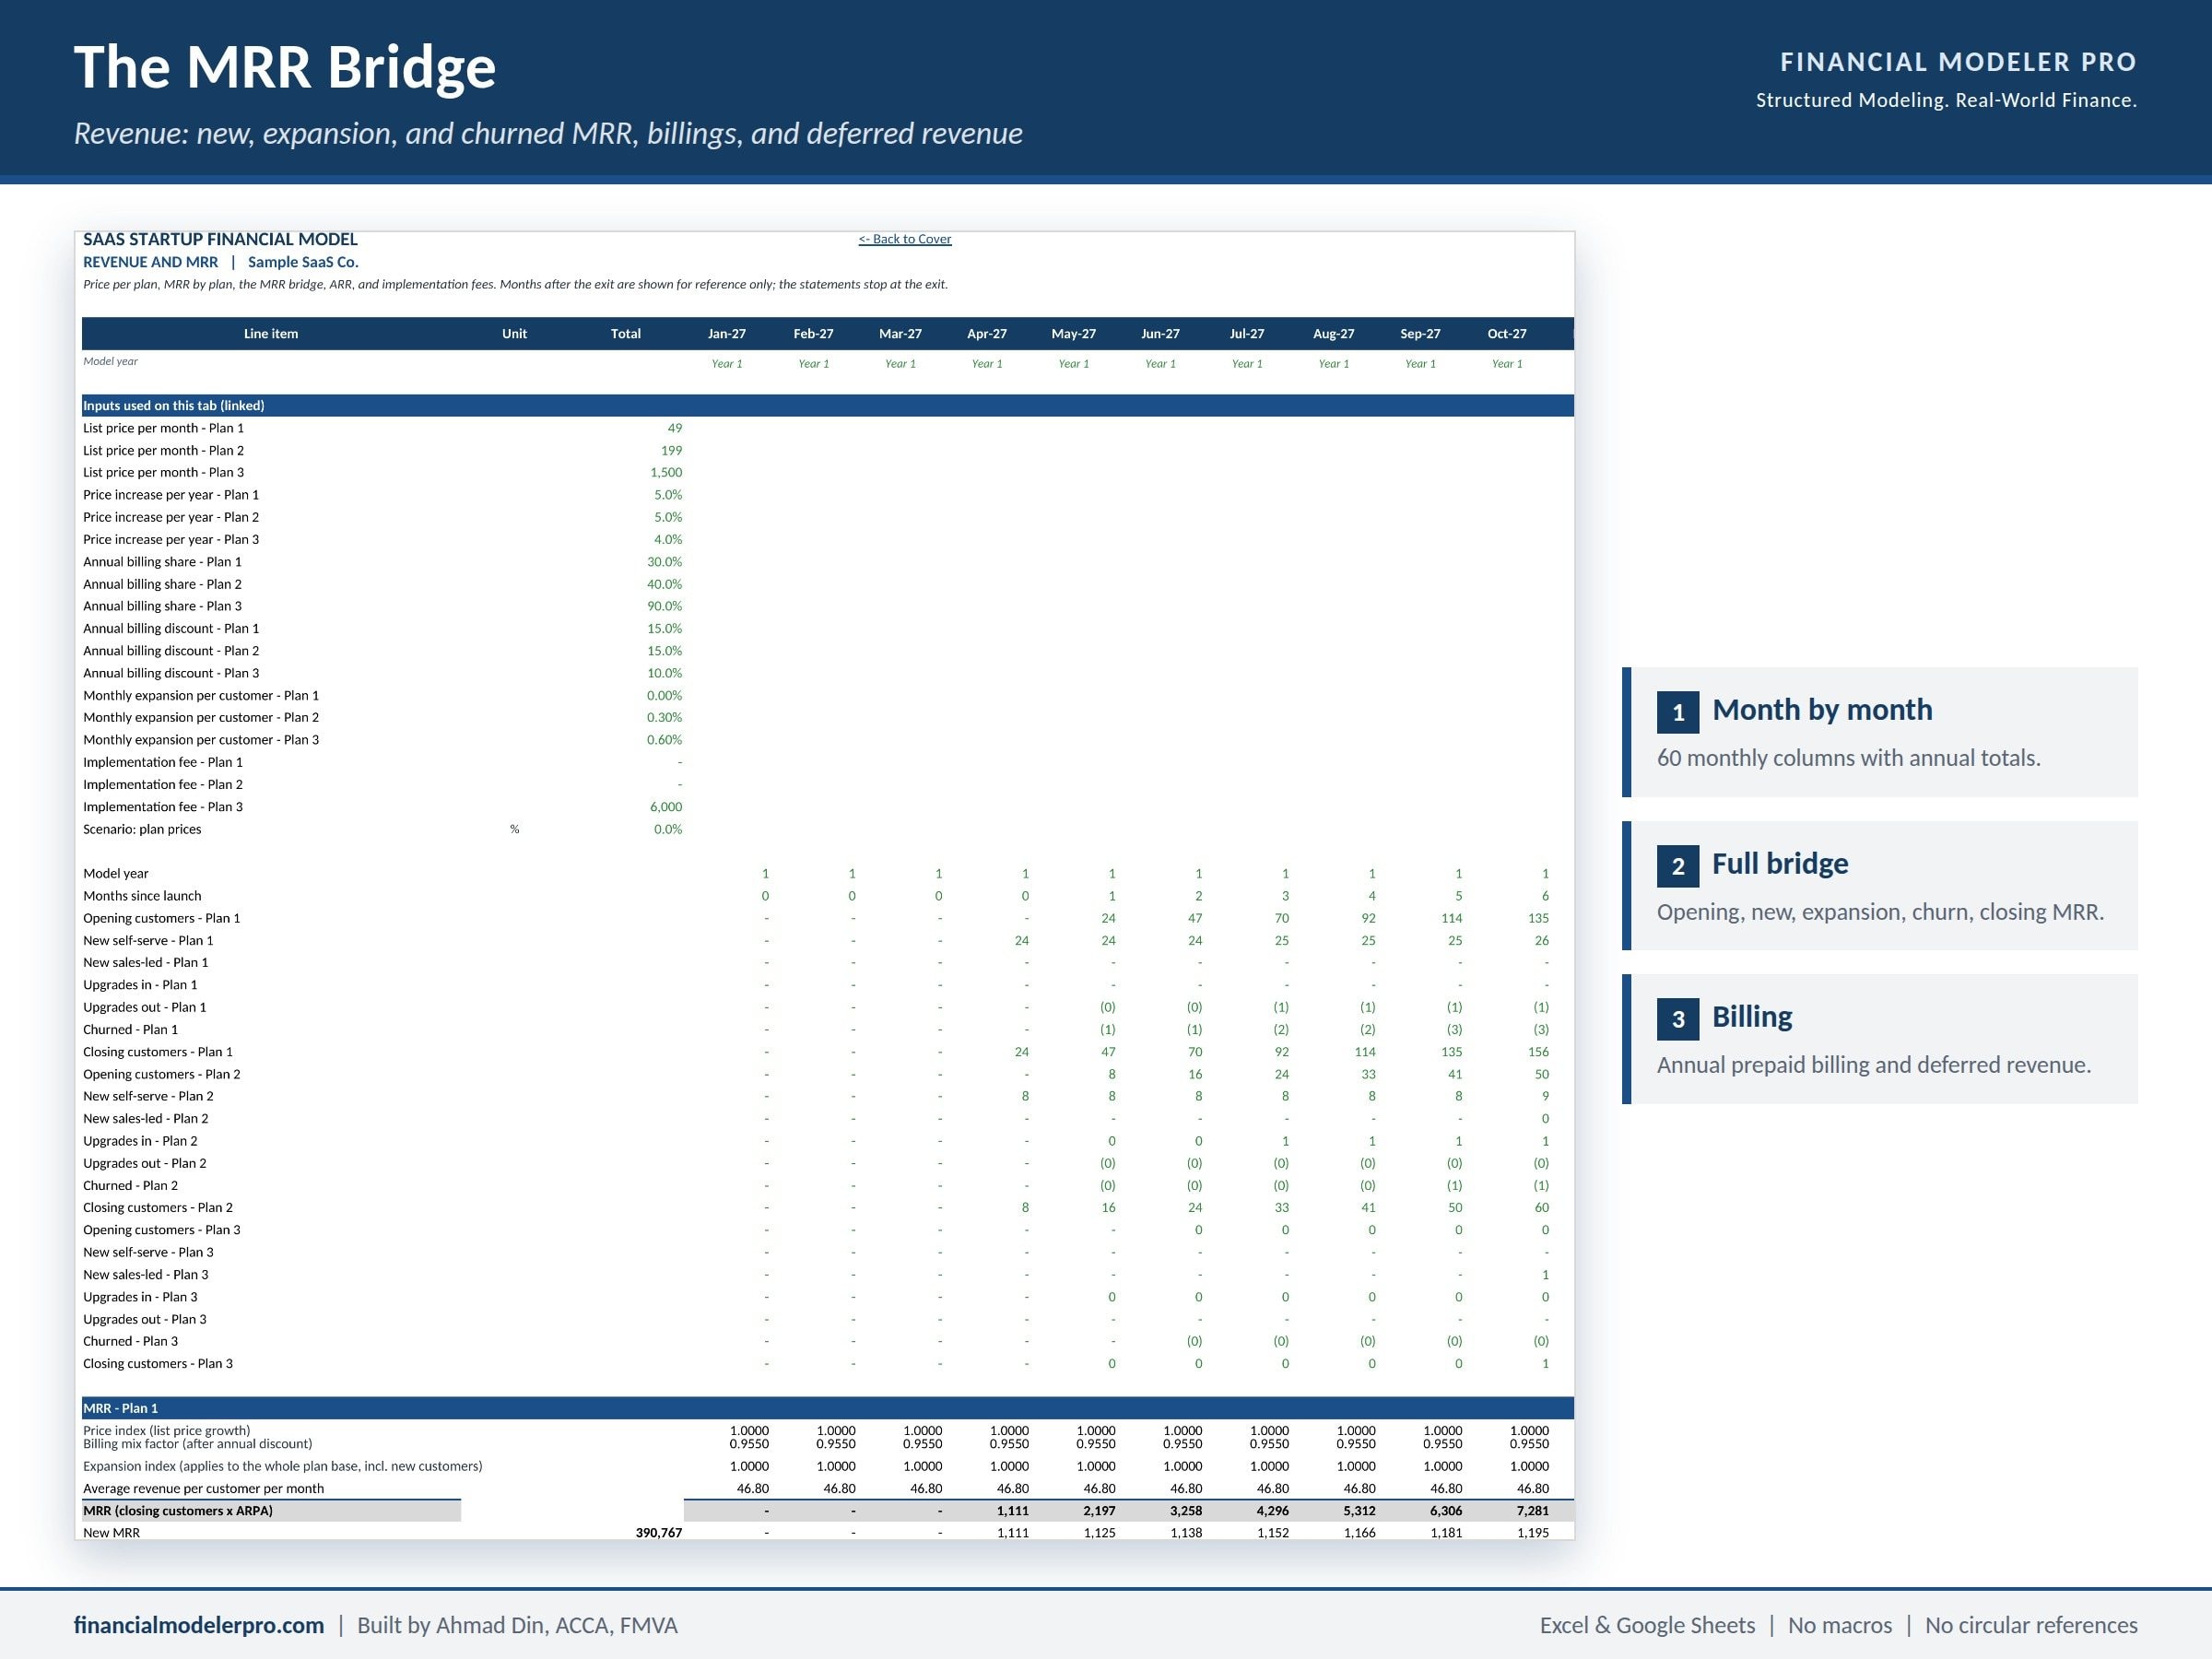
- Full MRR bridge: opening, new, expansion, churned, and closing
- Hiring plan for up to 22 roles by department and start month, with on-costs and sales quotas
- Deferred revenue from annual billing, working capital, and month-by-month cash runway
- Up to four funding rounds with pre-money values and an option pool, feeding a fully diluted cap table
- SaaS metrics: ARR, net and gross revenue retention, CAC, LTV, LTV / CAC, payback, burn multiple, and Rule of 40
- Three valuation methods: DCF, EV / ARR comparables, and the VC method, shown on a football field
- Exit proceeds, IRR, and multiple for founders and each investor round
- Base, Downside, and Upside scenarios switched from one cell, plus live sensitivity grids with no data tables
- Integrity checks that must read ALL OK before you rely on any number
How to work with the template
- Save a copy and read the Instructions tab. Set the company name, start date, and launch month on Company Inputs.
- Fill the three pricing plans and how customers arrive on Plan Inputs, then the team and costs on Team & Cost Inputs. You type in yellow cells only.
- Enter the funding rounds and the option pool, pick the scenario and the exit year, and confirm the Checks tab reads ALL OK.
- Read the Dashboard and SaaS Metrics tabs, then the Cap Table and Valuation.
All formulas are visible and no cell is locked. Each schedule tab starts with a block of links to the inputs it uses, so you can follow any number back to its source.
Why you need this model
Investors do not read a SaaS forecast line by line. They look for a handful of ratios and check whether they hang together: does the growth match the spend, does the retention support the valuation, does the cash last until the next round? This model produces those ratios from your own inputs, so the story in your deck and the numbers behind it agree. It also shows founders something a revenue forecast alone does not: how much of the company is left after each round.
Technical notes
- 60 monthly periods, with annual summaries
- Excel 2010 or later and Google Sheets
- No macros, no circular references, no external links, no merged cells
- Exit proceeds are shared pro rata to fully diluted ownership; liquidation preferences are not modelled
- Sample data is illustrative; replace it with your own
Licences
- Free PDF Preview: shows the layout and outputs before you buy
- Excel Model, Business Licence: for use inside your own company
- Excel Model, Consulting Licence: for use on client engagements
About the author
Built by Ahmad Din, ACCA, FMVA, AFM, a corporate finance and transaction advisory practitioner with 12+ years of experience across Saudi Arabia, the GCC, and Pakistan, and the founder of Financial Modeler Pro. Custom versions of this model are available on request through eFinancialModels.
Similar ProductsOther customers were also interested in...



 eFinancialModels
Electric Vehicle (EV) Charging Station Financial M...
With this comprehensive 5- or 10-year monthly tool, investors can assess the viability of setting up... Read more

Financial Model for Mobile App | Mobile App Busine...
The Mobile App Financial Plan Template in Excel allows you to develop financial projections when lau... Read more

 HenrySheykin
Food Truck Financial Model Excel Template
The Food Truck Financial Model helps entrepreneurs, founders, business owners, consultants, and anal... Read more

Green Hydrogen Production from Wind Energy Financi...
The Green Hydrogen from Wind Financial Model aims to comprehensively forecast a horizon of 40 years ... Read more

Simple Mutual Non-Disclosure Agreement Template
Protect your business secrets with ease using our Simple Mutual Non-Disclosure Agreement Template. S... Read more

Solar Energy Financial Model
The Solar Energy Financial Model Spreadsheet Template in Excel assists you in preparing a sophistica... Read more

 Peter Graf
The Customer-Centric Financial Model for Restauran...
Starting a restaurant without a financial plan is like driving a car blindfolded. You wouldn´t do i... Read more
You must log in to submit a review.