
0 ITEMS

Search Fund & Independent Sponsor Model | Multi-Acquisition Holdco with LP/GP Waterfall
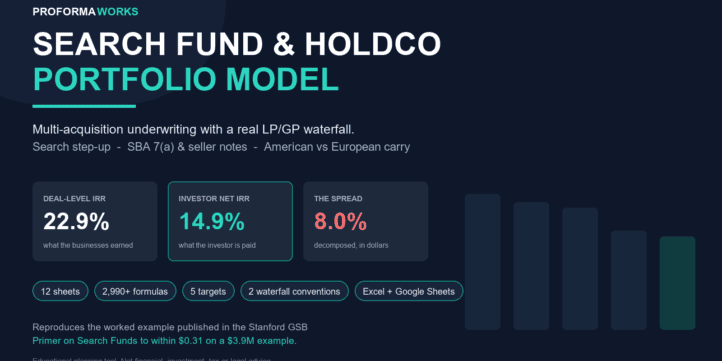
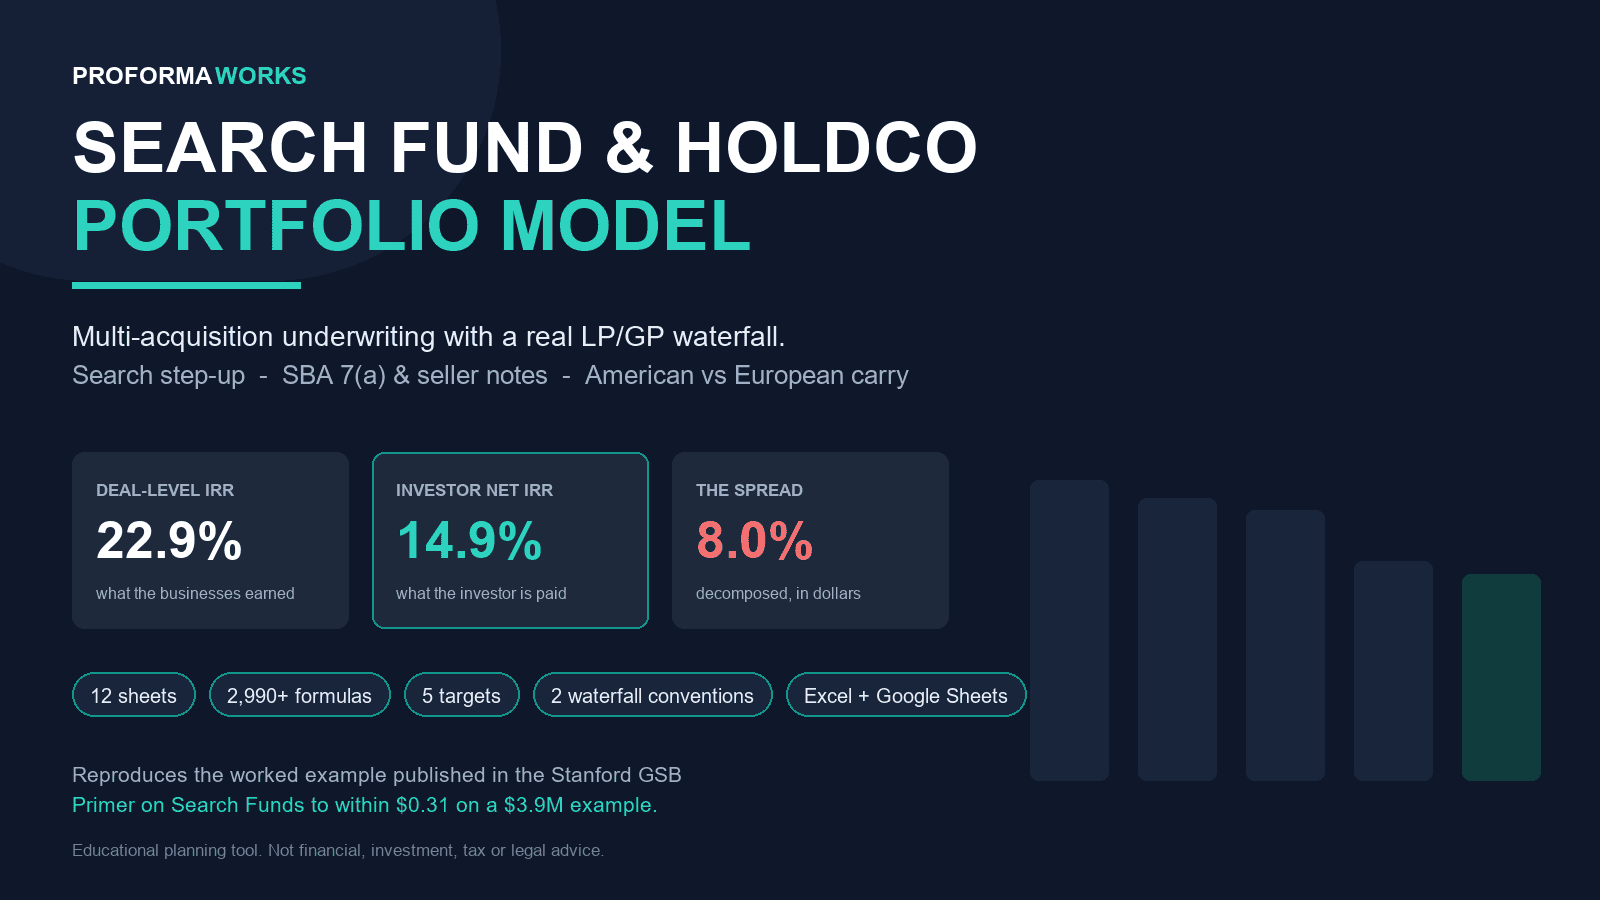
A portfolio of acquisitions is not the sum of five acquisitions. Models the search phase and its 150% step-up, both LP/GP waterfall conventions with a clawback switch, and an exact dollar bridge from the portfolio gross profit to the investor net.
You can underwrite one acquisition on a single sheet: price, debt, cash flow, coverage, exit. Do it five times and you still have not modelled a fund – because three things exist only above the deal level, and they are exactly where the investor money goes.
The search. Capital is spent for years before anything is bought, and some of it buys nothing at all. It then converts into equity at a step-up – typically 150 percent of what was invested – which is capital and preferred return standing in front of the promote. Switch the step-up off in the model and watch the sponsor carry rise: that difference is what it is worth.
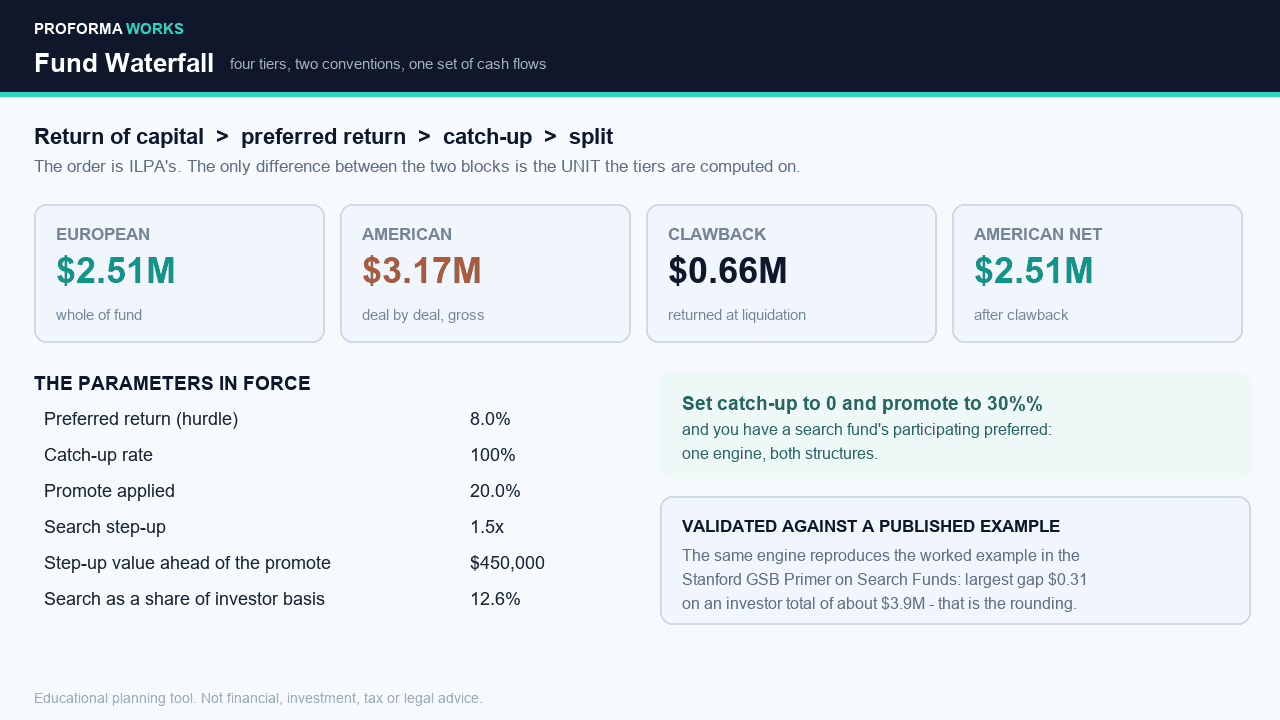
The waterfall. Return of capital, preferred return, catch-up, promote. Both conventions are computed on the same cash, every time the file recalculates: whole-of-fund (European) and deal-by-deal (American), with a clawback switch.
The order of events. Capital called late earns more on the same dollars. A promote paid early on a winner, before a loser is recognised, may never come back.
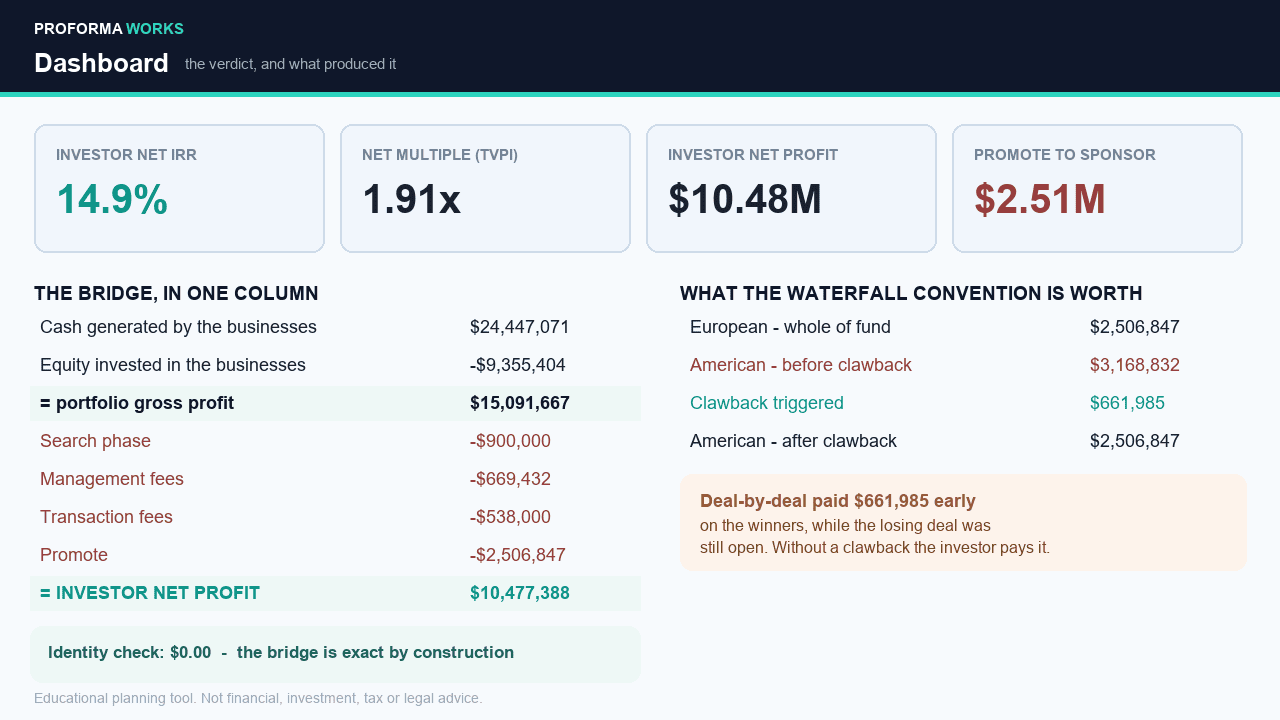
Two propositions you can test rather than take on trust. Deal-by-deal without a clawback, with one losing deal in the portfolio, pays the sponsor more than the whole-fund entitlement – and the excess is precisely what the investors lose. Deal-by-deal with a full clawback converges to the whole-fund result in total dollars, leaving a difference that survives only in timing, and therefore only in the IRR. Both are computed side by side in the default case.
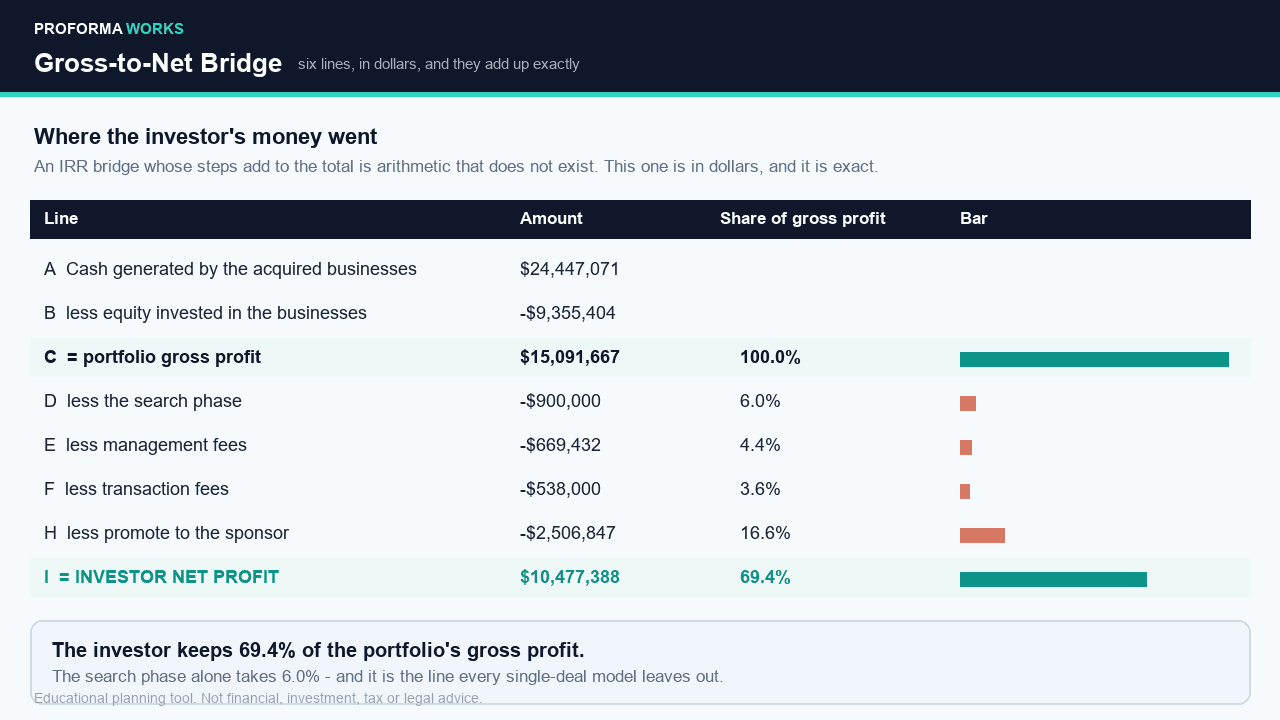
The output is a bridge in dollars that adds up exactly: cash generated by the businesses, less the equity invested in them, less the search phase, less management fees, less transaction fees, less the promote – leaving the investor net profit. In the default portfolio the businesses earn a 22.9 percent deal-level return and the investor is paid 14.9 percent net; the bridge tells you which of the five costs produced the 8.0 points of spread, and the identity check on the sheet reads zero. Beside it is a return ladder, presented without pretending the rungs add up, because an internal rate of return is not a sum of parts.
At the deal level: five targets, each with its own entry multiple, senior debt, growth, capex, cash taxes, exit and coverage ratio; a seller note with a standby period where interest accrues instead of being paid; and SBA 7(a) published caps checked against your inputs – 5 million dollar maximum loan, 75 percent guaranty, ten-year maximum maturity outside real estate. Amortising acquisition debt over twenty-five years makes almost any price work on paper, and for a goodwill deal that financing does not exist.
The search fund structure is modelled rather than approximated: the two-stage capital raise, the step-up on conversion, and the searcher equity in three tranches – one at closing, one vesting over four years of employment, one on performance hurdles that begin at a 20 percent net return to investors and top out around 35 percent.
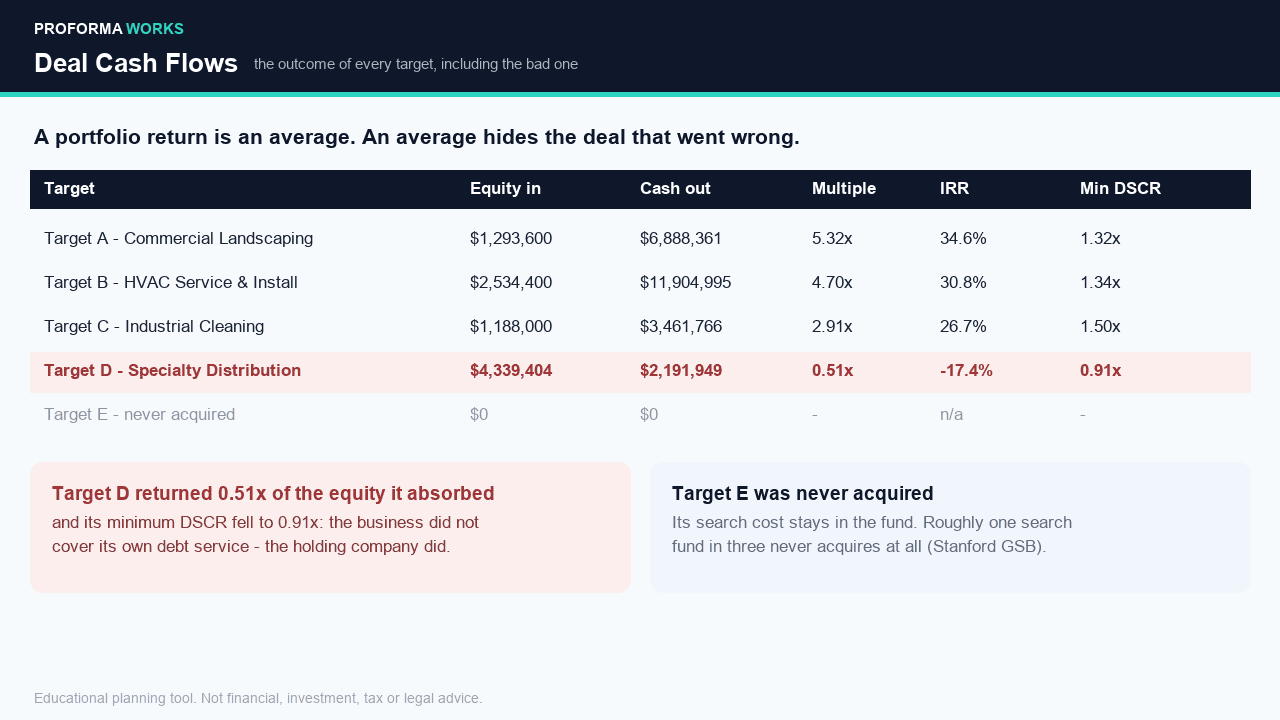
A default case that is deliberately uneven. Four acquisitions and one target that is worked and never closed. One of the four returns 0.51x of the equity it absorbed, with a minimum debt service coverage ratio of 0.91x – the arithmetic way of saying the business did not cover its own debt and the holding company had to. That is not pessimism: the published record says roughly one search fund in three never acquires, and roughly one acquisition in four has lost money for investors. Exit multiples are at or below entry multiples on every deal, because multiple expansion is the assumption that flatters every model that makes it.
Validated against a published worked example. The waterfall engine reproduces the example printed in the Stanford GSB 2026 Primer on Search Funds – one million dollars for 70 percent of the equity, an 8 percent compounding preference, a five million dollar exit after four years – to within 31 cents on an investor total of about 3.9 million, which is the rounding in the published text. The comparison is on its own sheet, so you can check it rather than trust it. And the combination that reproduces it, catch-up at zero and promote at 30 percent, is a participating preferred: one engine covers both a private equity waterfall and a search fund investor agreement.
Twelve sheets, 2,996 formulas. Excel and Google Sheets, no macros, no external links, no iterative calculation. Includes a 7-page user guide. Every benchmark carries its source and a reliability tag; where no benchmark exists – entry multiples, exit multiples, sponsor fee levels – the sheet says so instead of inventing one.
Educational planning tool. Not financial, investment, tax or legal advice. It does not predict returns and does not tell you what a business is worth.
Similar ProductsOther customers were also interested in...



 eFinancialModels
Electric Vehicle (EV) Charging Station Financial M...
With this comprehensive 5- or 10-year monthly tool, investors can assess the viability of setting up... Read more

Financial Model for Mobile App | Mobile App Busine...
The Mobile App Financial Plan Template in Excel allows you to develop financial projections when lau... Read more

 HenrySheykin
Food Truck Financial Model Excel Template
The Food Truck Financial Model helps entrepreneurs, founders, business owners, consultants, and anal... Read more

Green Hydrogen Production from Wind Energy Financi...
The Green Hydrogen from Wind Financial Model aims to comprehensively forecast a horizon of 40 years ... Read more

Simple Mutual Non-Disclosure Agreement Template
Protect your business secrets with ease using our Simple Mutual Non-Disclosure Agreement Template. S... Read more

Solar Energy Financial Model
The Solar Energy Financial Model Spreadsheet Template in Excel assists you in preparing a sophistica... Read more

 Peter Graf
The Customer-Centric Financial Model for Restauran...
Starting a restaurant without a financial plan is like driving a car blindfolded. You wouldn´t do i... Read more
You must log in to submit a review.