
0 ITEMS

Self Storage Development REFM Financial Model Excel Template
The Self-Storage Development Financial Model is a ready-to-use financial model template designed to help users plan, evaluate, and present a ground-up self-storage development project with greater confidence. Instead of starting from a blank spreadsheet, entrepreneurs, developers, business owners, consultants, analysts, and founders can work from a structured model built around the realities of acquiring land, funding construction, managing development costs, and selling completed storage assets. It helps organize the major financial planning questions lenders and investors typically want answered, including how much capital is required, when cash flow turns positive, what drives revenue, and whether the project can reach sustainable profitability. This template supports detailed planning across revenue assumptions, startup costs, development budgets, operating expenses, payroll, project timelines, and exit values. Users can customize assumptions for land acquisition, construction spend, corporate setup costs, staffing, financing, property sales, and ongoing overhead. Because self-storage development can involve years of negative cash flow before revenue is recognized from asset sales, the model is especially useful for understanding the cash burn period, estimating minimum funding needs, and preparing for capital calls, loan discussions, or investor presentations. The Self-Storage Development Financial Model also helps users evaluate profitability, break-even analysis, investor returns, and scenario-based decision-making. It provides a practical way to test low, base, and high outcomes by adjusting key variables such as sale prices, construction cost overruns, development timelines, interest rates, and project phasing. This makes it useful not only for preparing business plans and funding documents, but also for comparing development strategies before committing capital. Users can review projected financial performance over a five-year period and understand how decisions made early in the project may affect future returns. Built for professional use but designed to be editable, the template gives users a clear framework for turning assumptions into lender-friendly financial outputs. It includes dashboard views, charts, revenue detail, return metrics, bank-ready reports, and KPI tracking to support both internal analysis and external communication. Whether you are launching a new self-storage development company, evaluating a specific project, preparing a feasibility study, or building a funding case for lenders and equity partners, this financial model template helps convert a complex real estate development plan into a clear, organized, and decision-ready forecast.
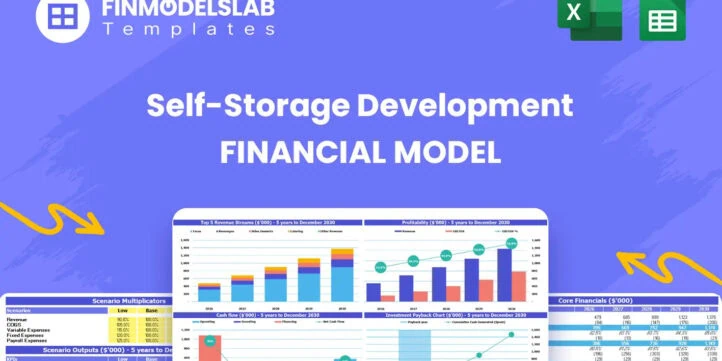


Financial Model Overview
The Self-Storage Development Financial Model gives entrepreneurs, developers, consultants, analysts, and business owners a structured way to evaluate a capital-intensive self-storage development strategy before launch, expansion, or funding discussions. Unlike a simple operating model for an existing facility, this financial model template is built around the full development lifecycle, including land acquisition, construction or renovation, corporate setup, staffing, project financing, sales of completed assets, and investor returns. It helps users connect key assumptions to five-year financial projections so they can understand cash requirements, revenue timing, profitability, break-even timing, and return potential.
For a self-storage development project, cash flow can remain negative for an extended period while properties are acquired and built, so a clear model is essential for planning construction financing, capital calls, lender conversations, and stakeholder reporting. The template is fully editable, compatible with Excel and Google Sheets, and designed to help users replace scattered assumptions with a professional financial planning tool that supports budgeting, feasibility analysis, funding preparation, and better decision-making.
All-in-One Dashboard
The all-in-one dashboard brings the core inputs and core outputs of the Self-Storage Development Financial Model into one practical view, making it easier to understand the project without moving through every worksheet. This component is useful because lenders, investors, founders, and internal decision-makers often need a fast summary of the forecast before reviewing the detailed schedules behind it. The dashboard may include inputs such as development start dates, acquisition assumptions, construction budgets, financing assumptions, sales timing, staffing levels, and operating cost drivers, then translate those assumptions into outputs such as projected revenue, EBITDA, cash position, funding requirement, break-even timing, and return metrics.
For a self-storage development plan, the dashboard is especially valuable because the business may experience heavy cash outflows before the first major sale occurs. By summarizing the most important figures in one place, this section helps users quickly see whether the plan is financially feasible, whether the funding strategy is realistic, and whether the development timeline supports the expected exit strategy. It also helps create a cleaner conversation with banks, equity partners, and stakeholders because users can explain the full project at a high level before presenting supporting detail.
Low, Base, and High Scenario Analysis
The low, base, and high scenario analysis section helps users evaluate how the self-storage development forecast may change under different market, cost, and timing conditions. This component allows users to test a conservative case, an expected case, and an optimistic case by adjusting assumptions such as land acquisition prices, construction cost overruns, project delays, sale values, financing costs, lease-up assumptions if applicable, and exit timing.
For a ground-up self-storage development project, scenario analysis is particularly important because small changes in construction costs or sales timing can create major changes in cash flow, funding requirements, and investor returns. A low scenario may show the impact of higher costs, slower sales, or reduced exit pricing, while a high scenario may show the upside if projects are completed faster or sold at stronger valuations. The outputs may include revised revenue projections, cash flow forecasts, profitability estimates, IRR, ROE, payback period, and minimum cash requirement.
This section is useful for planning because it helps users prepare for risk before capital is committed. It also supports better decision-making by showing which assumptions have the greatest influence on project success and by giving lenders and investors a clearer view of downside protection and upside potential.
Professional Charts
The professional charts section converts complex financial projections into visual outputs that are easier to review, explain, and present. Instead of relying only on rows of numbers, this component can show trends in revenue, cash flow, EBITDA, funding needs, cumulative investment, project profitability, and investor returns over the forecast period. For a self-storage development financial model, charts are especially useful because the timing of cash inflows and outflows is often uneven.
A chart can make it clear when cash is being deployed into land and construction, when the deepest funding gap occurs, and when property sale proceeds begin to improve the financial position. Users can rely on these visuals for internal planning meetings, lender discussions, investor presentations, and business plan exhibits.
Inputs behind the charts may include monthly development schedules, capital expenditures, sale dates, operating expenses, debt assumptions, and revenue forecasts, while outputs may include visual comparisons of low, base, and high scenarios or year-by-year performance. This section improves communication because it helps stakeholders understand the project trajectory quickly. It also strengthens decision-making by turning the forecast into a visual story that highlights timing, risk, and financial milestones.
ROE Components and DuPont Analysis
The ROE components and DuPont analysis section helps users understand what is driving the return on equity in the self-storage development project. Rather than showing only a final return percentage, this component breaks performance into underlying drivers such as profitability, asset efficiency, leverage, margins, and equity use. For developers and investors, this is valuable because a strong or weak return can be caused by several different factors.
A project may generate attractive returns because sale margins are high, because capital is deployed efficiently, because leverage improves equity performance, or because overhead remains controlled during the development period. Inputs may include projected net income, total equity invested, asset values, financing structure, development costs, and sale proceeds, while outputs may include ROE, equity multiple, profit margin, and related return components.
This section supports investor communication by showing how returns are created, not just what the final return might be. It also helps users compare development strategies, such as using more debt, phasing projects differently, selling properties earlier, or improving construction cost controls. By isolating the key return drivers, the DuPont-style analysis gives users a more disciplined way to evaluate whether the forecasted investor return is sustainable, realistic, and worth the level of risk involved.
Revenue Inputs
The revenue inputs section captures the assumptions that drive the sales forecast for developed self-storage assets. In this model, revenue is primarily connected to the development and sale of self-storage facilities, entitled land parcels, or individual units under a condo-style structure, depending on the user’s strategy. This component allows users to enter assumptions such as project names, expected sale dates, sale prices, facility sizes, revenue recognition timing, exit values, and any additional revenue sources that may apply. For a self-storage development business, revenue timing is critical because revenue may not be recognized until a property is completed and sold.
This means the model must connect development schedules to cash flow and profitability with precision. Outputs from this section may include monthly and annual revenue forecasts, project-level sale proceeds, cumulative revenue, and revenue timing by asset. The section is useful for planning because it forces users to define how and when the business will actually generate income, rather than assuming smooth recurring revenue from the start. It also helps with funding preparation because lenders and investors can see whether the projected sale proceeds are sufficient to support construction costs, repay financing, cover overhead, and generate the expected return on investment.
Bank-Ready Reports
The bank-ready reports section organizes financial outputs in a format that is easier for lenders, credit committees, investors, and stakeholders to review. A self-storage development project often requires outside capital, whether through construction loans, acquisition financing, equity investment, or staged capital contributions. This component helps users present the forecast in a lender-friendly structure by summarizing profit and loss projections, cash flow forecasts, balance sheet outputs, sources and uses of funds, funding requirements, and key performance metrics.
Inputs may come from the revenue schedule, development cost assumptions, operating expenses, payroll, debt terms, interest rates, and project timelines, while outputs can include five-year financial statements and clear summaries of capital needs. This section is useful because lenders generally want to see whether the project has enough capital to survive the construction period, when break-even is expected, how debt may be serviced or repaid, and how realistic the projected sale proceeds are. By bringing these outputs together in a professional format, the template helps users avoid presenting a messy workbook or disconnected calculations. It supports loan applications, investor packages, feasibility studies, and internal approvals by showing the financial story in a clean and credible way.
Revenue Breakdown
The revenue breakdown section provides a more detailed view of how total revenue is built across different projects, assets, sale types, or revenue streams. While the revenue inputs section captures the main assumptions, this component helps users analyze the resulting revenue composition and understand which assets contribute most to the overall forecast.
For a self-storage development model, this may include revenue from completed facility sales, entitled land sales, individual unit sales, or other monetization strategies that the user chooses to include. Inputs may include property-specific sale values, closing dates, project sizes, development phases, and expected revenue timing, while outputs may include revenue by project, revenue by year, revenue by sale category, and the share of total revenue generated by each asset.
This is useful for planning because a development pipeline may depend heavily on one or two major exits, creating concentration risk. By reviewing the revenue breakdown, users can see whether the forecast relies too much on a single property sale or whether revenue is spread across a balanced pipeline. It also helps users compare strategic options, such as selling a facility earlier, holding for a stronger exit price, adding more development sites, or changing the mix between full property sales and unit-level sales.
KPI Dashboard
The KPI dashboard section tracks the performance metrics that matter most for a self-storage development business and turns them into a concise management view. This component may include metrics such as total development cost, funding requirement, minimum cash balance, EBITDA, gross margin, project profit, return on equity, internal rate of return, equity multiple, break-even timing, payback period, and project-level profitability. Inputs are drawn from across the model, including construction budgets, acquisition costs, revenue assumptions, operating expenses, payroll, financing terms, and sale proceeds. Outputs are presented as key indicators that help users monitor whether the project is moving toward the expected financial outcome.
For a self-storage development project, a KPI dashboard is valuable because success depends on controlling multiple variables at once. Cost overruns, delays, changes in interest rates, or lower exit values can quickly change the investment case. By tracking KPIs in one place, users can identify potential problems earlier and make more informed decisions about phasing, financing, cost control, and sales strategy. The dashboard also makes it easier to communicate with investors and lenders because it highlights the project’s financial health without requiring them to interpret every detailed worksheet.
Startup and Development Cost Analysis
The startup and development cost analysis section organizes the initial investment and project-level capital requirements needed to launch and execute the self-storage development strategy. This component is especially important because the capital need is not limited to basic startup costs. Users may need to plan for corporate setup, office expenses, technology platforms, vehicles for site visits, professional fees, land acquisition, entitlement costs, architectural work, engineering, permits, site preparation, hard construction costs, contingencies, and financing costs. Inputs may include line-item budgets, project-level acquisition prices, construction estimates, soft cost percentages, contingency allowances, payment timing, and capital expenditure schedules.
Outputs may include total startup cost, total development cost by project, monthly capital outflows, sources and uses of funds, and the amount of funding required before the first property sale. This section is useful for budgeting because it helps users avoid underestimating the cash needed to reach completion. It also supports lender and investor conversations by showing exactly where capital will be used and how development costs connect to the overall return profile. For self-storage developers, this section can be one of the most important parts of the model because the accuracy of the capital budget directly affects cash flow, break-even timing, profitability, and financing needs.
Break-Even Analysis
The break-even analysis section helps users estimate when the self-storage development business or project reaches the point where cumulative revenue and profits are sufficient to offset prior costs and losses. In a ground-up development model, break-even may occur much later than in an operating business because land acquisition, construction, payroll, overhead, and financing costs are incurred before completed assets are sold.
This component uses assumptions from revenue timing, sale proceeds, development costs, operating expenses, payroll, financing, and cash flow to estimate the month and year when the project crosses into break-even territory. Outputs may include break-even date, months to break even, cumulative cash flow, cumulative profit, and the relationship between property sales and recovery of invested capital. This section is useful for decision-making because it shows how long the business must be funded before it becomes self-sustaining.
Similar ProductsOther customers were also interested in...



 Jason Varner
Mixed-Use Real Estate Model: Leverage / JV Options
A general real estate model to plan all assumptions for up to 7 'uses' for a given property. Include... Read more

Apartment Building / Self-Storage / Multi-Family A...
This real estate model works great for acquisitions of apartment buildings, multi-family properties,... Read more

 eFinancialModels
Real Estate Financial Model Templates Package
This is a collection of ready-made Excel financial model templates for real estate businesses and it... Read more

Real Estate Financial Model Bundle
This is a collection of financial model templates that provides the financial projections and valuat... Read more
 D'Errico Financial S...
Storage Facility Development Model
The Storage Facility Development model projects annual future cash flows from a storage facility fro... Read more

 Giorgos
Real Estate Acquisition Financial Models Bundle
A collection of six Real Estate Development Financial Models offered at a discounted price you can�... Read more
 HenrySheykin
Retail Development REFM Financial Model Excel Temp...
The Retail Development Financial Model Financial Model Template helps users evaluate the financial f... Read more
Condominium Development REFM Financial Model Excel...
The Condo Development Financial Model helps developers, investors, analysts, consultants, and busine... Read more
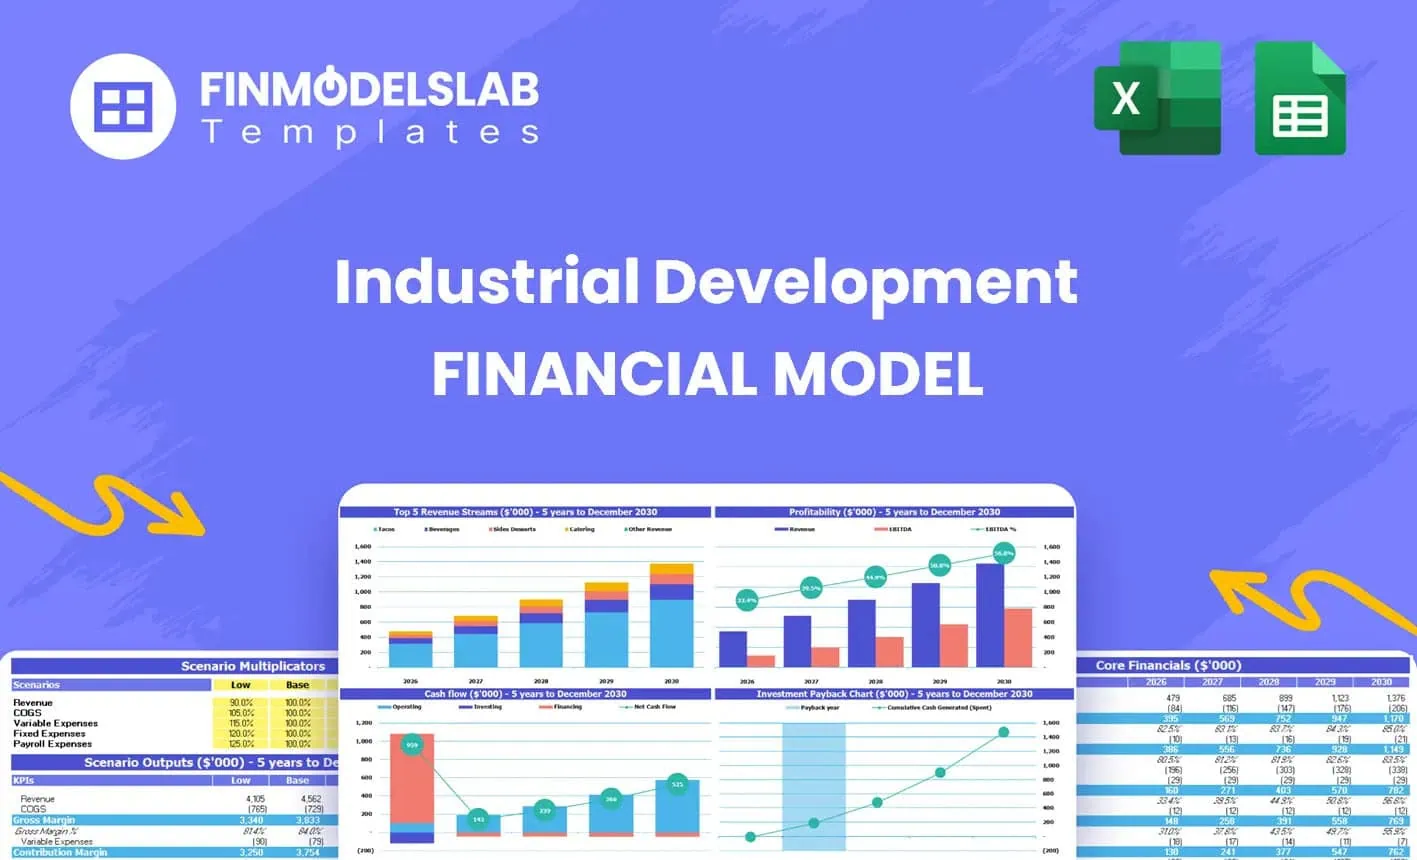
Industrial Development REFM Financial Model Excel ...
The Industrial Development Financial Model helps users evaluate a capital-intensive industrial prope... Read more
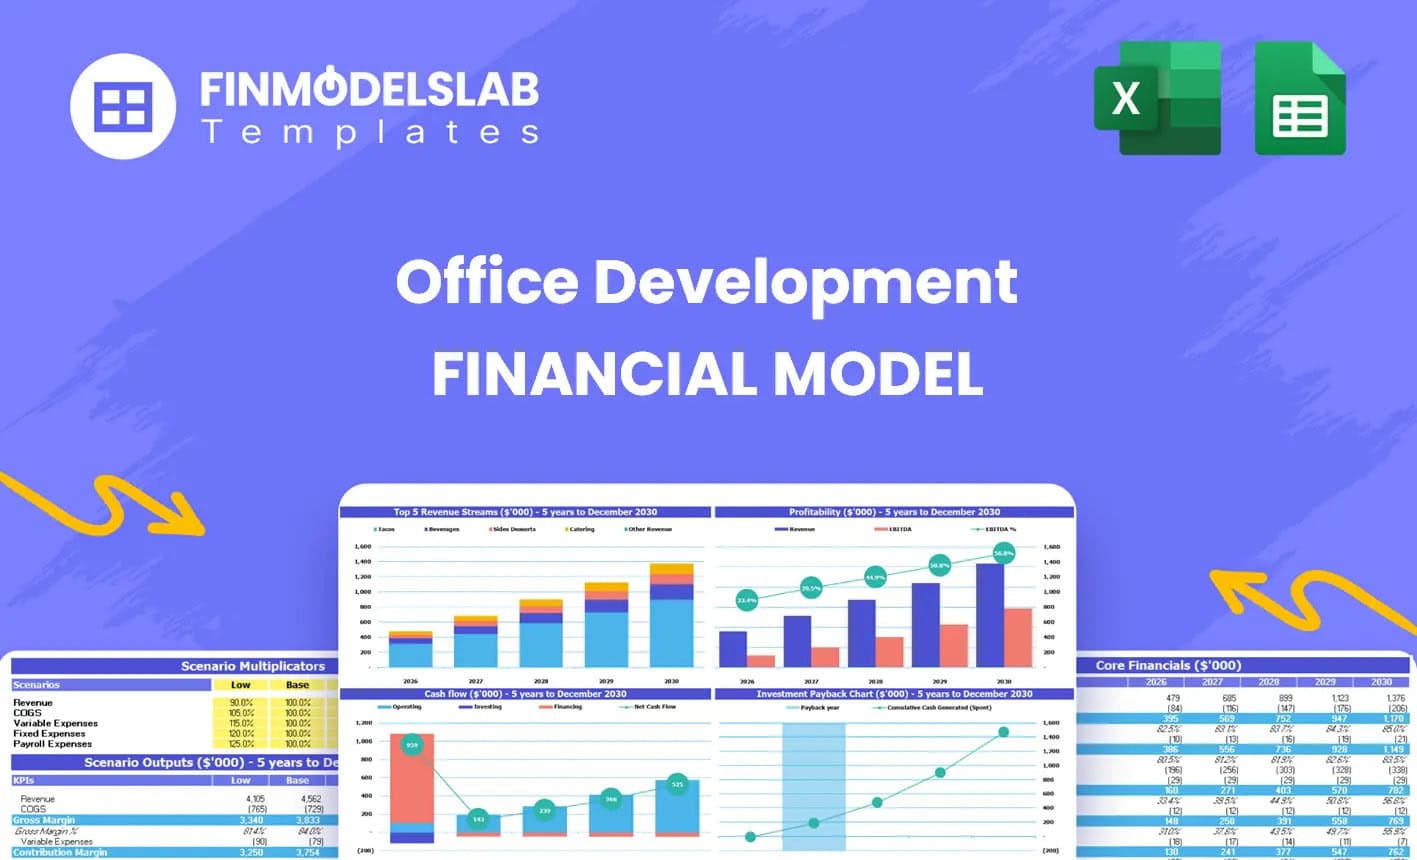
Office Development REFM Financial Model Excel Temp...
The Office Development Financial Model Financial Model Template helps users evaluate a commercial of... Read more
You must log in to submit a review.