
0 ITEMS

Industrial Development REFM Financial Model Excel Template
The Industrial Development Financial Model helps users evaluate a capital-intensive industrial property development business with a structured, editable financial forecast. It is designed for projects such as warehouses, factories, logistics hubs, industrial parks, renovated industrial buildings, and entitled land held for development and sale. Instead of starting from a blank spreadsheet, users can work from a ready-to-use model that connects project assumptions, development timelines, revenue events, construction budgets, operating expenses, payroll, cash flow, profitability, and investor returns in one planning file. This template is useful for entrepreneurs, developers, business owners, consultants, analysts, and founders preparing business plans, feasibility studies, lender packages, or investor presentations. Industrial development often requires large upfront investment before meaningful revenue is recognized, so the model helps users understand how acquisition costs, construction spend, financing terms, overhead, staffing, and exit prices affect the overall plan. It supports practical financial planning by showing when cash may be required, how long the business may operate before property sales occur, and whether the projected returns justify the risk. The model includes a five-year forecast framework with editable assumptions for revenue streams, startup costs, operating expenses, payroll, project-level inputs, cash flow, profitability, and break-even analysis. Users can test a base case, compare different market scenarios, and review outputs such as profit and loss, cash flow, balance sheet summaries, key performance indicators, and investor return metrics. This makes it easier to evaluate whether a development plan is financially viable, identify funding gaps, and prepare more credible financial documents for banks, partners, or equity investors. Built for decision-making, the Industrial Development Financial Model gives users a clearer view of how the business may perform under realistic assumptions. It can help answer important questions before committing capital, including how much funding is needed, which projects drive revenue, when profitability may begin, how sensitive returns are to delays or cost overruns, and what financial milestones stakeholders should monitor. The template is fully customizable, compatible with Excel and Google Sheets, and structured to save time while supporting a professional planning process.
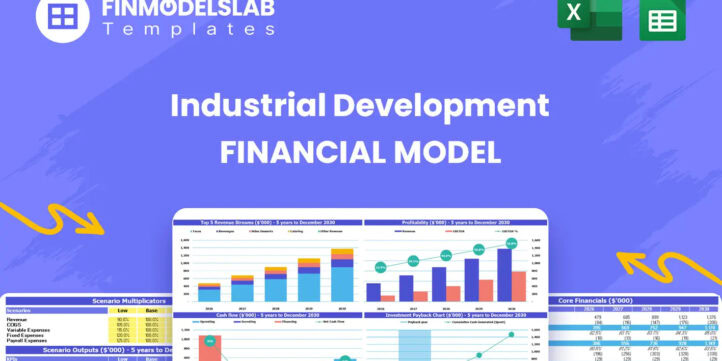


Industrial Development Financial Model Overview
The Industrial Development Financial Model is a ready-to-use financial model template built for planning, evaluating, and presenting an industrial real estate development business. It is designed for projects such as industrial parks, logistics hubs, warehouses, factories, renovated industrial buildings, and entitled land prepared for sale. Because industrial development usually involves large acquisition costs, long construction timelines, significant operating overhead, and delayed revenue recognition, a structured model is essential for understanding cash requirements and investment viability.
This template helps users enter their project assumptions, review five-year projections, analyze profitability, test scenarios, and prepare investor-ready or lender-friendly financial outputs. It is suitable for developers, entrepreneurs, consultants, analysts, business owners, and planning teams that need a practical way to forecast revenue, development costs, cash flow, returns, and funding needs before making major commitments.
All-in-One Dashboard
The all-in-one dashboard brings the model’s core inputs and outputs into one central view so users can understand the financial position of the industrial development plan without jumping between multiple worksheets. This component typically summarizes the main project assumptions, revenue expectations, cost structure, financing inputs, cash flow results, profitability measures, and return indicators in a clean, presentation-ready format.
Users can review key figures such as total development costs, forecasted property sales, operating expenses, EBITDA, net income, cash balance, funding gap, internal rate of return, return on equity, and payback period. For an industrial development company, this is especially useful because the business may show heavy cash outflows for several years before major property sales occur. The dashboard helps founders, analysts, lenders, and investors quickly see whether the plan is viable, where the largest risks are located, and which assumptions deserve closer review. It also supports faster decision-making by turning detailed calculations into an executive-level financial summary.
Low Base High Scenario Analysis
The Low Base High scenario analysis component allows users to compare how the industrial development business performs under different market and execution conditions. Industrial projects are exposed to risks such as rising construction costs, delayed permitting, longer sales cycles, higher interest rates, lower exit pricing, and changes in demand for logistics or manufacturing space. This section helps users adjust assumptions across a conservative case, a realistic base case, and an upside case to see how each scenario affects cash flow, profitability, investor returns, and funding requirements.
Inputs may include sale prices, construction timing, acquisition costs, debt terms, overhead levels, project completion dates, and absorption timelines. Outputs can show how the minimum cash balance changes, when break-even occurs, whether IRR improves or declines, and how much additional capital may be required. This is valuable for strategic planning because it helps users stress-test the business model before presenting it to lenders or investors. It also gives stakeholders a clearer understanding of downside exposure and upside potential, which is critical for a capital-intensive development venture.
Professional Charts
The professional charts component converts important financial outputs into visual reports that are easier to interpret and present. Industrial development financial models can contain a large amount of detail, including project costs, construction schedules, debt draws, revenue events, cash flow timing, operating expenses, and return metrics. Charts help simplify this information by showing trends and milestones in a visual format.
This section may include graphs for revenue growth, EBITDA, net profit, cash balance, cumulative funding needs, project sales timing, expense categories, and return performance. For a business plan, investor deck, or lender meeting, these visuals can make the difference between a dense spreadsheet and a clear financial story. Users can use the charts to explain why cash flow is negative during the build phase, when major property sales are expected, and how the business transitions toward profitability. The component is also useful for internal management because it helps teams identify unusual trends, compare actual performance against forecast assumptions, and communicate financial progress to partners or board members.
ROE Components and DuPont Analysis
The ROE components section uses a DuPont-style analysis to help users understand what drives return on equity within the industrial development business. Rather than looking only at a final ROE figure, this component breaks performance into underlying drivers such as profitability, asset efficiency, and leverage. In an industrial development model, return on equity can be heavily influenced by sale margins, timing of exits, debt structure, equity contributions, interest costs, and the amount of capital tied up in land, construction, and working capital.
Inputs may include net income, total assets, equity investment, financing levels, project sale proceeds, operating costs, and balance sheet assumptions. Outputs help users see whether returns are being supported by strong margins, efficient use of assets, or higher financial leverage. This is useful for investors and sponsors because it shows not only whether the plan generates a return, but why that return exists. It also helps management identify improvement levers, such as reducing acquisition costs, accelerating project turnover, increasing exit prices, controlling overhead, or optimizing the debt and equity mix.
Revenue Inputs
The revenue inputs component is where users define the assumptions that drive future income from industrial development projects. Unlike a recurring service business, industrial development often recognizes revenue in large, infrequent events when completed properties, renovated buildings, or entitled land parcels are sold. This section helps users organize those assumptions by project, sale timing, expected exit price, square footage, price per square foot, disposition schedule, market conditions, and potential sales strategy. It may also support assumptions for different revenue sources such as newly constructed warehouse sales, factory building sales, logistics hub exits, renovated industrial property dispositions, and land sales.
Because revenue timing has a major impact on cash flow and profitability, this component is central to the accuracy of the forecast. Users can update assumptions to reflect their own project pipeline, market research, broker guidance, feasibility studies, or investor expectations. The outputs then feed into the profit and loss statement, cash flow forecast, project return calculations, and dashboard. This helps users evaluate whether the projected sale proceeds are sufficient to cover development costs, debt obligations, overhead, and required investor returns.
Bank-Ready Reports
The bank-ready reports component organizes the financial model’s outputs into structured statements and summaries that can be used in funding discussions. Industrial development often depends on outside financing, including construction loans, land acquisition debt, working capital facilities, and equity contributions, so lenders need to see clear, consistent, and credible projections. This section may include forecasted profit and loss statements, cash flow statements, balance sheet summaries, debt schedules, capital expenditure forecasts, profitability measures, and project-level performance outputs.
Users can present monthly and annual projections to show how the business expects to fund construction, manage operating expenses, service debt, and repay or refinance obligations after project sales. The reports help demonstrate whether the development company can survive the pre-revenue period, maintain liquidity during construction, and generate sufficient proceeds at exit. This is valuable for business plans, loan applications, investor updates, board reporting, and internal financial reviews. By placing key financial statements in a lender-friendly format, the template helps users communicate the numbers professionally and reduce the time required to prepare funding documents.
Revenue Breakdown
The revenue breakdown component provides a more detailed view of the model’s income streams and shows how each project or property category contributes to total revenue. For an industrial development company, a single sale can materially change the financial results, so users need visibility into which assets are driving performance and when those sales are expected to occur. This section can separate revenue by project name, development type, sale date, building size, sales price, land disposition value, renovation exit value, or other relevant categories.
It may also help compare the contribution of warehouse projects, logistics hubs, factories, industrial parks, and entitled land sales. The outputs give users a clearer understanding of revenue concentration, timing risk, and dependence on specific transactions. This is useful for planning because it shows whether profitability is spread across multiple projects or reliant on one major sale. It also supports investor communication by explaining the commercial logic behind the forecast. When assumptions change, such as a delayed sale or revised exit price, the revenue breakdown helps users immediately identify how that change affects total sales, cash flow, margins, and returns.
KPI Dashboard and Benchmarking
The KPI dashboard and benchmarking component tracks the key performance indicators that matter most in industrial development and compares them against internal targets or market expectations. Relevant KPIs may include IRR, ROE, equity multiple, EBITDA margin, gross margin, payback period, minimum cash balance, debt exposure, development cost per square foot, sale price per square foot, operating margin, and break-even timing. Users can use this section to evaluate whether the project is performing at a level that is likely to satisfy investors, lenders, and strategic partners.
Benchmarking is especially important because industrial real estate returns must be assessed against construction risk, market cycles, financing costs, and alternative investment opportunities. If the model shows weak returns, excessive cash burn, or a long payback period, the KPI dashboard can help identify where assumptions need to improve. This component is also useful for monitoring performance after launch, as actual results can be compared with the forecast to determine whether project execution remains on track. For presentations, the dashboard gives stakeholders a concise summary of financial health and investment attractiveness.
Startup and Development Cost Planning
The startup and development cost planning component helps users estimate the capital required to launch the development company and prepare projects for execution. Industrial development involves both corporate setup costs and project-specific costs, and separating these categories is important for budgeting and funding. Corporate startup costs may include office setup, legal formation, professional fees, technology systems, market data tools, vehicles, insurance, initial marketing, and administrative setup. Development costs may include land acquisition, due diligence, permitting, architecture, engineering, site preparation, construction, contractor payments, utilities, contingency, financing fees, and other hard and soft costs.
Inputs in this section allow users to define upfront expenditures, timing of cash outflows, one-time launch costs, and recurring pre-development obligations. Outputs help estimate how much funding is required before meaningful revenue begins and how much capital must be available during the build phase. This is useful for entrepreneurs and developers because underestimating startup and development costs can create serious liquidity problems. A detailed cost plan also strengthens funding discussions by showing investors and lenders that the project budget has been considered in a structured and realistic way.
Break-Even and Funding Requirements
The break-even and funding requirements component helps users determine when the industrial development business may become financially self-sustaining and how much capital may be needed before that point. In this type of business, break-even is often tied directly to the timing of the first major property sale, because operating expenses, payroll, overhead, interest, and construction spending may create large losses during the early years.
Inputs may include monthly operating expenses, payroll, construction draws, debt service, project sale timing, gross margins, overhead assumptions, and available funding sources. Outputs can show the estimated break-even month, cumulative cash deficit, minimum cash balance, required equity, required debt, and potential funding gap. This component is especially useful for decision-making because it helps users understand whether the project can survive delays, cost overruns, or weaker exit pricing. It also helps founders and sponsors plan capital raises, negotiate financing facilities, phase projects more carefully, and communicate funding needs with confidence. By identifying the point at which revenue covers costs and cash flow stabilizes, the model gives users a practical view of risk, runway, and capital strategy.
File types:
Excel – Single-User: .xlsx
Excel – Multi-User: .xlsx
Similar ProductsOther customers were also interested in...


 HenrySheykin
Condominium Development REFM Financial Model Excel...
The Condo Development Financial Model helps developers, investors, analysts, consultants, and busine... Read more
Retail Development REFM Financial Model Excel Temp...
The Retail Development Financial Model Financial Model Template helps users evaluate the financial f... Read more
Self Storage Development REFM Financial Model Exce...
The Self-Storage Development Financial Model is a ready-to-use financial model template designed to ... Read more
Office Development REFM Financial Model Excel Temp...
The Office Development Financial Model Financial Model Template helps users evaluate a commercial of... Read more
Condo Hotel Financial Model Excel Template
The Condo Hotel Financial Model helps users turn a condo hotel concept, launch plan, or investment o... Read more

 anthony
Acquisition Model for Commercial Property
This is the Quintessential Commercial Property Acquisition Model that allows you to compare up to 20... Read more
The Realtors Quintessential ALL-IN-ONE Toolkit
Professional Realtors need a professional Toolkit which allows them to operate at a higher level. Th... Read more

 Eastwich Advisors
Multifamily Rehab Model (Includes Investor Returns...
Introducing the Multifamily Rehab Flip Model with Investor Returns Waterfall - a comprehensive tool ... Read more

 Giorgos
Office Building Development – 10 Year Financial ...
Financial model presenting a development scenario for an Office Building including construction, ope... Read more

Residential Building Development Model (Sale, Rent...
Financial model presenting a development scenario for a Residential Building with units available fo... Read more
You must log in to submit a review.