
0 ITEMS

Legal Services Financial Model Excel Template
The Legal Services Financial Model Financial Model Template helps entrepreneurs, law firm founders, consultants, analysts, and business owners turn a legal practice concept into a structured five-year financial forecast. Instead of starting from a blank spreadsheet, users can work from a ready-to-use model designed around the economics of legal services, including billable hours, client acquisition, service mix, retainers, staffing, operating expenses, startup costs, cash flow, and profitability. It gives users a practical framework for understanding whether a legal services business can generate enough revenue to support its cost structure, growth plans, and funding requirements. This template is built for people preparing business plans, investor materials, lender submissions, internal budgets, or strategic planning documents for a law firm or legal consulting practice. Users can adjust revenue assumptions such as hourly rates, average hours per service, marketing budget, customer acquisition cost, and recurring retainer clients. The model also supports planning for payroll, partner compensation, administrative staff, technology, rent, professional tools, marketing, insurance, and other operating expenses that influence the financial performance of a legal services business. The Legal Services Financial Model helps users evaluate key financial questions before launching or expanding. It can be used to estimate how much initial capital may be needed, how quickly the firm may reach break-even, how cash flow behaves month by month, and how profitability changes under different growth assumptions. By connecting revenue assumptions, startup investments, staffing decisions, and expense planning in one model, it helps users see the financial impact of decisions before committing resources. Designed to be editable and presentation-ready, the template works for both early-stage legal practices and established firms planning growth, new service lines, or funding conversations. It includes structured outputs that help users review financial statements, monitor performance, assess investor metrics, and make more informed decisions. Whether the goal is to secure financing, validate a legal business plan, compare scenarios, or manage financial planning more professionally, this financial model template provides a clear and organized foundation.
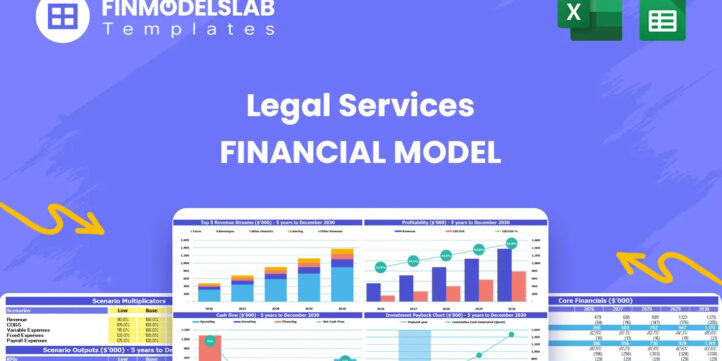


Legal Services Financial Model Overview
The Legal Services Financial Model Financial Model Template is a ready-to-use planning tool for building a structured five-year forecast for a law firm, legal consultancy, or professional legal services business. It is designed to help founders, attorneys, managing partners, consultants, analysts, and business plan writers estimate revenue, startup investment, operating expenses, cash flow, profitability, and funding needs without building a financial model from scratch. The template is especially useful for legal services businesses because it connects the real drivers of law firm economics, including client acquisition, billable hours, hourly rates, retainer relationships, staffing, partner compensation, marketing spend, and recurring overhead. Users can edit assumptions, test different outcomes, review financial statements, and prepare professional outputs for investors, lenders, partners, or internal decision-making. By organizing the numbers in a clear and connected structure, the model helps users move from assumptions to actionable financial insight.
All-in-One Dashboard
The all-in-one dashboard brings the most important inputs and outputs of the Legal Services Financial Model into one central view, making it easier to understand the overall financial position of the legal services business. This component is designed to summarize key assumptions and results such as revenue, expenses, EBITDA, net profit, cash position, funding needs, and growth trends. Users can update core assumptions in the model, including customer acquisition cost, marketing budget, service pricing, billing volume, payroll, and cost structure, then review how those assumptions flow through the financial forecast. For a law firm founder or business planning consultant, the dashboard reduces the need to search through multiple tabs to find the main financial story. It helps users quickly identify whether the business plan is financially viable, whether the firm has enough cash to operate, and whether forecasted profitability supports growth or funding discussions. This makes the dashboard useful for both day-to-day planning and stakeholder presentations.
Low Base High Scenario Analysis
The low, base, and high scenario analysis component helps users evaluate how different assumptions may affect the legal services business under conservative, expected, and optimistic conditions. In a law firm model, small changes in client acquisition, hourly rates, billable hours, retainer conversion, staffing levels, and marketing efficiency can significantly impact revenue, cash flow, and profitability. This section allows users to test different versions of the forecast rather than relying on one fixed outcome. A low scenario may reflect slower client growth, higher acquisition costs, lower utilization, or delayed collections, while a high scenario may reflect stronger demand, improved billing rates, more retainer clients, or better operating leverage. The outputs help users compare revenue, margins, cash balances, and profitability across scenarios. This is valuable for funding preparation because investors and lenders often want to understand downside risk and upside potential. It also supports better decision-making by showing which assumptions are most important to the firm’s financial success.
Professional Charts
The professional charts component converts financial outputs into clear visual summaries that are easier to interpret and present. Legal services forecasts can include many moving parts, such as service revenue, payroll, operating expenses, cash flow, EBITDA, profit margins, and balance sheet changes. Charts help users understand these trends without manually analyzing every row of the spreadsheet. This section may display revenue growth over time, expense trends, profit development, cash flow movement, and other key outputs that help explain the firm’s financial trajectory. For business plan presentations, lender meetings, investor updates, or partner discussions, visual reporting can make the forecast more persuasive and easier to follow. Users can rely on the charts to communicate how the practice is expected to scale, when profitability improves, and whether cash flow remains healthy during growth. This component is especially useful for turning a detailed financial model into a presentation-ready planning document that supports professional communication with stakeholders.
ROE Components and DuPont Analysis
The ROE components section uses DuPont-style analysis to help users understand what drives return on equity in the legal services business. Instead of looking only at a single profitability figure, this component breaks performance into connected financial drivers such as profit margin, asset efficiency, and leverage. For a law firm, return on equity may be influenced by billing rates, staffing efficiency, operating expense control, capital investment, cash management, and the amount of owner or investor funding used to support the business. Users can review how operational decisions affect investor-level returns and whether the firm is generating an attractive return relative to the capital invested. The section may use inputs from the income statement, balance sheet, and equity assumptions to calculate return metrics and show how they evolve over the forecast period. This is useful for investors, partners, and founders because it links day-to-day operating performance with ownership returns. It also helps identify whether stronger returns come from better margins, higher revenue productivity, or more efficient use of capital.
Revenue Inputs
The revenue inputs component is where users define the commercial assumptions that drive the legal services forecast. In a law firm or legal consulting business, revenue typically depends on the number of clients acquired, marketing spend, customer acquisition cost, service mix, hourly billing rates, average hours per engagement, and recurring monthly retainers. This section allows users to adjust assumptions for services such as business incorporation, litigation support, contract review, and monthly legal advisory retainers. By entering pricing, billing volume, client conversion, and service allocation assumptions, users can create a more realistic forecast that reflects their actual business strategy. The model can then translate those assumptions into monthly and annual revenue projections. This component is useful because revenue forecasting is one of the most important parts of a legal services business plan. It helps users test whether marketing investment generates enough clients, whether service pricing supports the cost structure, and whether recurring retainers can improve revenue predictability and cash flow stability.
Bank-Ready Reports
The bank-ready reports component organizes the financial forecast into outputs that are suitable for lenders, financing partners, and other external stakeholders. Legal services businesses often need funding for launch costs, office setup, technology, working capital, marketing, and early payroll before revenue becomes consistent. Lenders typically want to review structured financial statements, repayment capacity, cash flow projections, and the assumptions behind the business plan. This component helps users present financial information in a lender-friendly format, including projected profit and loss, cash flow, balance sheet, and supporting metrics. It can show whether the firm is expected to remain liquid, generate enough operating cash, and cover its fixed obligations. For business owners and consultants preparing loan applications or funding packages, these reports save time and improve the professionalism of the submission. They also help users anticipate lender questions by clearly connecting startup costs, revenue assumptions, payroll, expenses, profitability, and cash flow into one financial planning framework.
Revenue Breakdown
The revenue breakdown component provides a more detailed view of how income is generated across different legal services revenue streams. Rather than showing only total revenue, this section separates income by service type, allowing users to see how each area contributes to overall performance. A legal services firm may earn revenue from business formation work, litigation support, contract review, advisory retainers, consulting, compliance assistance, or other legal engagements. Each stream may have different pricing, billing hours, margins, frequency, and growth potential. This component helps users identify which services are driving revenue, which are most scalable, and which may require additional staffing or marketing support. It also helps with strategic decisions, such as whether to prioritize high-value litigation work, increase recurring retainer clients, or expand transactional legal services. The outputs can support service mix planning, pricing strategy, sales targets, and staffing decisions. For investors and partners, a clear revenue breakdown demonstrates that the forecast is based on specific business drivers rather than a single generic sales assumption.
KPI Dashboard
The KPI dashboard component focuses on performance metrics that help users monitor the health and efficiency of the legal services business. While the all-in-one dashboard provides a broad financial snapshot, the KPI dashboard highlights measurable indicators that are particularly useful for managing and benchmarking a law firm. These may include client acquisition cost, revenue per client, average billing rate, billable hours, EBITDA margin, cash balance, payback period, return on equity, revenue growth, and profitability ratios. Users can compare forecasted performance against internal targets or industry-style benchmarks to understand whether the business is on track. This section is valuable because legal services businesses depend heavily on productivity, utilization, client acquisition efficiency, and margin control. A firm may show revenue growth but still face cash pressure or weak profitability if payroll, marketing, or overhead expands too quickly. The KPI dashboard helps users spot these issues earlier and supports better decisions about pricing, hiring, marketing budgets, client mix, and expansion timing.
Startup Cost and Operating Expense Planning
The startup cost and operating expense planning component helps users estimate both the initial investment required to launch the legal services business and the recurring costs needed to operate it. Startup costs may include office furniture, computer hardware, legal software, website development, licenses, deposits, branding, initial marketing, professional tools, and working capital. Ongoing operating expenses may include rent, utilities, insurance, subscriptions, technology platforms, marketing, accounting, administrative support, professional development, and other overhead. Payroll planning may also be included, covering founding partner compensation, associate attorneys, paralegals, legal assistants, administrative staff, and benefits. This section is useful because many law firm forecasts underestimate the cash needed before revenue becomes stable. By separating one-time capital expenditures from recurring monthly expenses, the model gives users a clearer view of funding needs and cash runway. It also helps users evaluate tradeoffs, such as leasing versus buying equipment, outsourcing support functions, or delaying certain hires until revenue volume justifies the cost.
Break-Even Analysis
The break-even analysis component helps users determine when the legal services business is expected to cover its fixed and variable costs and begin generating profit. For a law firm, break-even depends on several connected assumptions, including billable hours, hourly rates, retainer revenue, client volume, payroll, rent, marketing costs, professional expenses, and other overhead. This section translates those assumptions into a practical milestone by showing how much revenue is needed to offset the firm’s cost structure. Users can review when the business may reach break-even under the forecast and test how changes in pricing, client acquisition, staffing, or overhead affect the timeline. This is especially useful for founders, investors, and lenders because it indicates how quickly the practice may become financially self-sustaining. It also supports operational planning by helping users set minimum sales targets, manage spending before profitability, and decide whether additional funding or working capital is needed. A clear break-even view turns the forecast into a decision tool for launch planning, growth strategy, and risk management.
File types:
Excel – Single-User: .xlsx
Excel – Multi-User: .xlsx
Similar ProductsOther customers were also interested in...



 HenrySheykin
Law Firm Financial Model Excel Template
The Law Firm Financial Model Template helps users turn a legal practice concept into a structured fi... Read more
Business Brokerage Financial Model Excel Template
The Business Brokerage Financial Model helps entrepreneurs, brokerage owners, consultants, analysts,... Read more

Financial Advisors Agency Financial Model Excel Te...
The Financial Advisor Financial Model is a ready-to-use financial model template built for planning,... Read more

Mortgage Bank Financial Model Excel Template
The Mortgage Bank Financial Model helps users turn a mortgage banking concept, expansion plan, or fu... Read more
Offshore Bank Financial Model Excel Template
The Financial Model Template helps founders, banking entrepreneurs, consultants, analysts, and busin... Read more
Savings Bank Financial Model Excel Template
The Savings Bank Financial Model helps entrepreneurs, bank founders, consultants, analysts, and busi... Read more
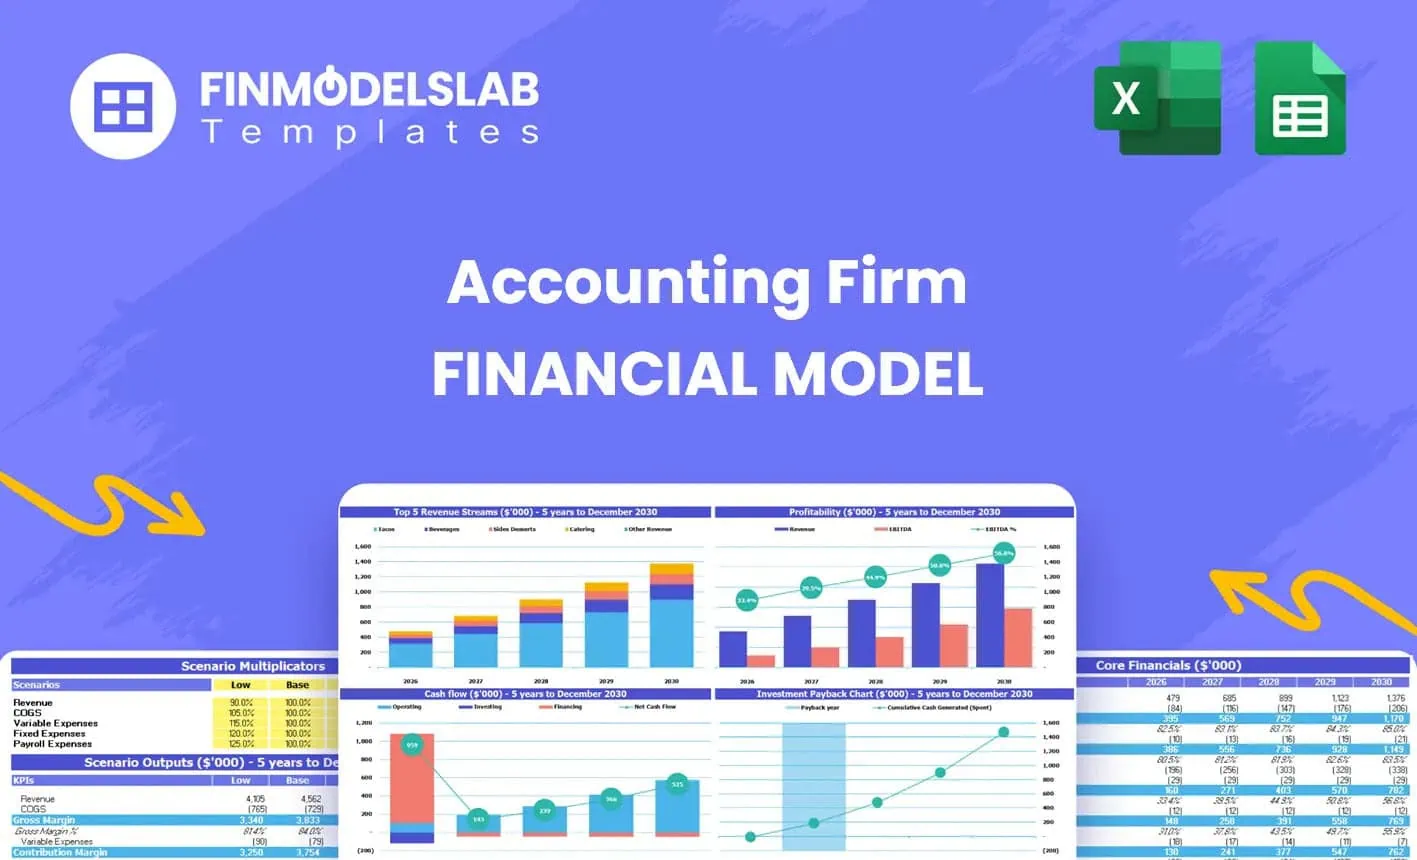
Bookkeeping Agency Financial Model Excel Template
The Accounting Firm Financial Model Template helps founders, practice owners, consultants, analysts,... Read more

 MENA Research Partne...
Alternative Investment Company Valuation Template
Alternative Investment Company Valuation: All-In-One Model for Private Equity, Asset Management, and... Read more

 Giorgos
Accounting Firm – 10 Year Financial Model
10-year financial model for an accounting firm providing forecasts, profitability analysis, and insi... Read more

 David
David
Financial Advisor / Financial Planner Financial Pr...
5-Year 3-Statement Excel projection model for Financial Advisor / Financial Planner business generat... Read more
You must log in to submit a review.