
0 ITEMS

Offshore Bank Financial Model Excel Template
The Financial Model Template helps founders, banking entrepreneurs, consultants, analysts, and business planners turn a bank launch or expansion concept into a structured five-year financial forecast. Instead of starting from a blank spreadsheet, users can work from a ready-to-use model built around the financial logic of a banking business, including loans, deposits, interest income, non-interest income, operating expenses, payroll, capital needs, cash flow, and profitability.
It is designed to support financial planning, business plan writing, investor discussions, lender conversations, and internal decision-making. This template is especially useful for anyone preparing a new bank, community bank, commercial bank, digital banking concept, or banking-related business plan.
It gives users a practical way to document revenue assumptions, estimate startup costs, forecast staff growth, plan operating expenses, and understand how changes in loan portfolio growth, deposit funding, pricing, interest spreads, and fee income can affect performance. The model helps connect commercial assumptions with financial outcomes, making it easier to evaluate whether the business can scale sustainably.
The Bank Financial Model includes editable inputs and automated calculations so users can customize the forecast to match their own market, launch strategy, capital structure, and growth expectations. It supports planning for revenue drivers such as net interest income and fee-based income while also organizing expenses such as salaries, technology, branch costs, marketing, compliance, and other recurring overhead.
Users can review projected profit and loss, cash flow, balance sheet movement, break-even analysis, and return metrics to better understand the financial path from launch to profitability. Built for practical business use, the template helps users test assumptions, compare scenarios, prepare professional reports, and present the financial story clearly to stakeholders.
It can support funding preparation, board discussions, strategic planning, valuation conversations, and operational budgeting. By combining revenue modeling, expense planning, payroll forecasting, cash flow visibility, profitability analysis, and decision-making outputs in one organized file, this financial model template gives buyers a more disciplined way to plan, assess, and present a bank business opportunity.


Bank Financial Model Overview
The Bank Financial Model Financial Model Template is a ready-to-use planning tool designed to help entrepreneurs, founders, consultants, analysts, and business owners forecast the financial performance of a banking business. It brings together the core financial drivers of a bank, including loan growth, deposit funding, net interest income, non-interest income, startup investment, operating costs, payroll, cash flow, balance sheet movement, profitability, and return metrics.
The template is built to support five-year planning and can be customized for a new bank launch, a community bank concept, a commercial banking operation, a digital banking strategy, or an expansion plan for an existing financial institution.
By entering assumptions in the input areas, users can generate structured outputs such as profit and loss forecasts, cash flow projections, balance sheet summaries, break-even timing, debt schedules, dashboards, charts, and investor-ready reports. This makes the model useful for business planning, funding preparation, board presentations, lender discussions, investor review, and internal decision-making.
All-in-One Dashboard
The all-in-one dashboard gives users a centralized view of the model’s most important inputs and outputs, making it easier to understand the bank’s financial position without reviewing every supporting schedule manually.
This section is designed to summarize core assumptions such as revenue drivers, loan portfolio growth, deposit assumptions, expense levels, staffing plans, and capital needs, while also displaying key outputs such as revenue, EBITDA, net profit, cash flow, funding requirements, break-even timing, and selected performance indicators. For a bank business, a dashboard is especially valuable because financial performance depends on many connected variables, including interest spreads, asset growth, cost of funds, operating efficiency, and liquidity.
By bringing these figures into one organized view, the dashboard helps users quickly evaluate whether the business plan is financially coherent, whether the cost structure is manageable, and whether the projected growth strategy requires additional capital. It is useful for management reviews, investor conversations, internal planning, and quick scenario discussions because it translates a complex banking forecast into a clear executive summary.
Low Base High Scenario Analysis
The low, base, and high scenario analysis section allows users to compare how the bank may perform under different operating conditions. Instead of relying on one fixed forecast, users can model a conservative case, an expected case, and an optimistic case by adjusting assumptions such as loan origination volume, deposit growth, interest rate spreads, fee income, marketing effectiveness, staffing levels, operating costs, and capital requirements. This is particularly important for banking financial planning because small changes in loan growth, funding costs, default assumptions, or operating efficiency can have a meaningful effect on profitability and liquidity.
The scenario structure helps users evaluate the range of possible outcomes before committing capital, hiring staff, opening branches, launching technology platforms, or expanding lending activity. It also supports stronger investor and stakeholder communication because it shows that the plan has been tested against uncertainty rather than presented as a single rigid projection. By comparing downside, expected, and upside cases, users can identify risk areas, prepare contingency plans, and make more informed decisions about funding, growth pace, and operational priorities.
Professional Charts
The professional charts section turns the model’s financial outputs into visual reports that are easier to review, explain, and present. The charts may illustrate revenue growth, net interest income trends, expense movement, EBITDA progression, profitability, cash balance, loan portfolio expansion, deposit funding, return metrics, and other key financial indicators.
For a bank business plan, charts are useful because they help stakeholders quickly see the relationship between asset growth, income generation, operating costs, and capital needs. A lender, investor, board member, or internal decision-maker may not want to inspect every spreadsheet line, but clear visuals can communicate the financial story in seconds.
This section helps users present performance trends in a polished format, making the financial model more suitable for pitch decks, strategy meetings, funding applications, and management reviews. The charts also support internal decision-making by highlighting whether the business is scaling efficiently, when profitability improves, how cash flow changes over time, and whether operating leverage develops as the bank’s loan and deposit base grows.
ROE Components and DuPont Analysis
The ROE components and DuPont analysis section helps users evaluate the drivers behind return on equity, one of the most important performance measures for a banking business. Rather than looking only at a final ROE percentage, this section breaks the return profile into underlying components such as profitability, asset utilization, leverage, margins, and capital structure.
For banks, ROE is closely connected to how efficiently the institution converts assets into earnings, how well it manages costs, how appropriately it uses equity capital, and how effectively it balances risk and return. Inputs may include net income, total assets, equity, revenue, expense ratios, loan portfolio size, and balance sheet assumptions. The outputs help users understand whether returns are being driven by strong margins, efficient operations, asset growth, financial leverage, or a combination of factors.
This is valuable for investor presentations, capital planning, and strategic decision-making because it shows not only whether the bank generates returns, but also why those returns occur. It can help users identify whether they should focus on improving net interest margin, increasing fee income, controlling overhead, optimizing capital levels, or refining lending strategy.
Revenue Inputs and Assumptions
The revenue inputs and assumptions section is where users define the commercial drivers that power the bank’s forecast. For a banking model, revenue is typically driven by net interest income from earning assets such as mortgages, commercial loans, small business loans, consumer loans, auto loans, and investment securities, as well as non-interest income from fees and other banking services.
This section allows users to customize assumptions related to loan portfolio growth, product mix, interest rates, yields, deposit costs, fee income, account activity, customer acquisition, and other revenue-related drivers. Clear revenue inputs are essential because they determine how quickly the bank can scale income and whether the projected balance sheet can support the desired profitability path.
By organizing these assumptions in one editable section, the template makes it easier to test different growth strategies, adjust pricing, refine the product mix, and align revenue expectations with market realities. The section also supports funding discussions because investors and lenders often want to see how the revenue forecast was built, not just the final revenue number.
Bank-Ready Reports
The bank-ready reports section provides structured financial outputs that are suitable for review by investors, lenders, advisors, executives, and other stakeholders. These reports may include projected profit and loss statements, cash flow statements, balance sheet summaries, debt schedules, operating summaries, and financial performance reports over a five-year planning period.
For a bank business, well-organized financial reports are critical because stakeholders need to understand revenue generation, capital requirements, liquidity, expenses, profitability, balance sheet growth, and funding needs in a professional format. This section helps users move from assumptions to presentation-ready outputs without manually building each statement from scratch. It also improves consistency because the financial reports are connected to the same underlying assumptions, reducing the risk of conflicting numbers across planning documents.
The reports can support business plan development, investor submissions, loan applications, internal reviews, board updates, and strategic planning. By presenting the model’s outputs in a clear and lender-friendly format, this section helps users communicate the financial plan with credibility and structure.
Revenue Breakdown
The revenue breakdown section gives users a detailed view of how total revenue is generated across the bank’s different income streams. Rather than presenting one combined revenue figure, this section separates the contribution of major earning assets and fee-based revenue categories so users can see which products and services drive performance.
It may include mortgages, commercial and small business loans, consumer loans, auto loans, investment securities, transaction fees, account fees, advisory fees, service charges, and other non-interest income sources depending on the user’s strategy. This level of detail is valuable because the financial profile of a bank can change significantly depending on its product mix. A loan-heavy strategy may produce different margins, capital needs, and risk exposure than a strategy with more fee-based income or securities income.
The revenue breakdown helps users evaluate concentration risk, compare the profitability of different revenue streams, and identify opportunities to strengthen income diversity. It also supports more defensible forecasting because users can explain how revenue is built from specific drivers rather than relying on broad top-down assumptions.
KPI Dashboard and Performance Benchmarks
The KPI dashboard and performance benchmarks section helps users track important banking performance metrics and compare projected results against practical targets or industry-style expectations. Key performance indicators may include net interest margin, return on equity, return on assets, efficiency ratio, loan growth, deposit growth, cost-to-income ratio, cash position, capital adequacy indicators, EBITDA, net profit margin, and other operating metrics.
For a banking business, KPIs are essential because profitability alone does not tell the full story. A bank may show revenue growth while still facing liquidity pressure, high operating costs, weak returns, or inefficient capital usage. This section brings performance measurements into a concise format so users can monitor the health of the business over time.
Benchmarking also helps users pressure-test assumptions by comparing projected margins, expense levels, staffing productivity, and growth rates against reasonable expectations. The KPI dashboard is useful for management reporting, investor updates, board meetings, and planning reviews because it highlights whether the bank is moving toward sustainable performance or whether adjustments are needed in pricing, staffing, lending, funding, or expense control.
Startup Costs and Capital Requirements
The startup costs and capital requirements section helps users estimate the initial investment needed before the bank can operate effectively and support early growth. A banking business can require significant upfront spending on branch build-out, technology systems, core banking software, digital platforms, IT infrastructure, licenses, compliance setup, legal and professional services, marketing, recruitment, deposits, reserves, and working capital.
This section allows users to separate one-time capital expenditures from recurring operating expenses, which is important for understanding the true funding requirement at launch. It may also help users evaluate how much capital is needed to cover early losses, support loan origination, maintain liquidity, and meet growth targets before the bank reaches stable profitability.
By organizing startup costs into clear categories, the model helps founders and planners avoid underestimating launch funding needs. It is useful for investor presentations, capital raise planning, loan applications, internal budgeting, and go-to-market preparation. The section also supports better decision-making by showing which upfront investments are essential, which can be phased over time, and how initial capital choices affect cash flow and runway.
Break-Even and Profitability Timing
The break-even and profitability timing section helps users determine when the bank is expected to cover its operating costs and begin generating sustainable profit. This component connects revenue growth, interest income, fee income, cost of funds, payroll, marketing, technology expenses, branch overhead, and other operating costs to calculate the point at which the business moves from loss-making to profitable. For a new bank or expanding financial institution, break-even analysis is important because early periods may include heavy startup spending, slower initial revenue generation, and significant staffing or technology investment.
The section helps users identify the month or year when revenue is projected to exceed costs, as well as the assumptions that most influence that milestone. Users can test whether profitability improves through faster loan growth, stronger deposit acquisition, higher fee income, lower operating expenses, delayed hiring, improved margins, or more efficient capital deployment. This makes the break-even section useful for planning, fundraising, risk management, and stakeholder communication because it clearly shows how long the business may need financial support before it becomes self-sustaining.
File types:
Excel – Single-User: .xlsx
Excel – Multi-User: .xlsx
Similar ProductsOther customers were also interested in...


 HenrySheykin
Mortgage Bank Financial Model Excel Template
The Mortgage Bank Financial Model helps users turn a mortgage banking concept, expansion plan, or fu... Read more
Legal Services Financial Model Excel Template
The Legal Services Financial Model Financial Model Template helps entrepreneurs, law firm founders, ... Read more
Savings Bank Financial Model Excel Template
The Savings Bank Financial Model helps entrepreneurs, bank founders, consultants, analysts, and busi... Read more

 MENA Research Partne...
Alternative Investment Company Valuation Template
Alternative Investment Company Valuation: All-In-One Model for Private Equity, Asset Management, and... Read more
 Eastwich Advisors
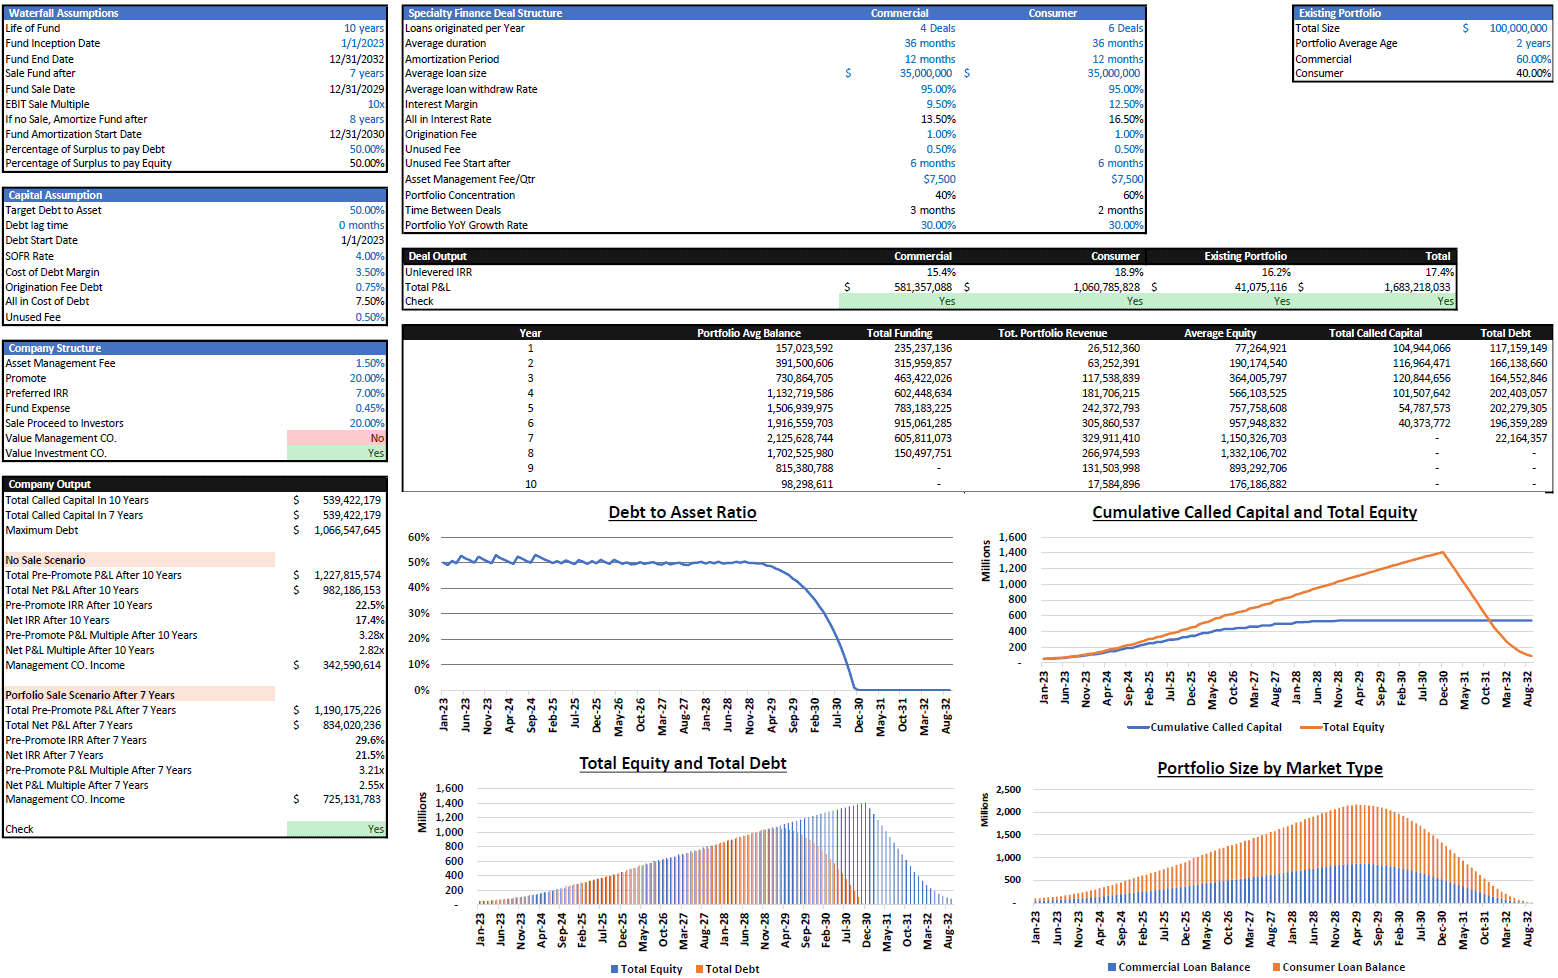
Debt Fund Excel Model
Explore the Debt Fund Excel Model, a comprehensive tool for evaluating new credit fund opportunities... Read more

Crypto Token Valuation Model
A cutting-edge crypto token valuation model, designed to provide comprehensive insights and analytic... Read more

Online Bank Financial Model Excel Template
The Online Bank Financial Model Financial Model Template helps founders, fintech entrepreneurs, cons... Read more

Retail Bank Financial Model Excel Template
The Retail Bank Financial Model Financial Model Template helps users build a structured five-year fo... Read more

 Anuj
Anuj
Private Equity Fund Model (Investor Cashflows)
The Private Equity Fund Cashflows Model helps LPs and GPs analyze fund cash flows, returns, and dist... Read more

 David
David
Asset Management Business Financial Projection 3 S...
3-Statement 5 year rolling financial projection Excel model with valuation for existing/startup Asse... Read more
You must log in to submit a review.