
0 ITEMS

White Labeling Financial Model Excel Template
The White Labeling Financial Model helps entrepreneurs, founders, consultants, analysts, and business owners turn a private label or white label product concept into a structured financial forecast. Instead of starting with a blank spreadsheet, users can work from a ready-to-use financial model template designed around the economics of white-labeled products, including unit volumes, pricing, product lines, cost of goods sold, staffing, operating expenses, startup costs, cash flow, profitability, and investment needs. It is built to support practical financial planning before launch, expansion, fundraising, lender discussions, or internal decision-making. This template is especially useful for businesses planning to sell or manufacture white-labeled products across multiple categories, such as skincare, supplements, essential oils, apparel, electronics, or other branded goods produced for resale. It gives users a framework for testing revenue assumptions, adjusting sales prices, estimating production volume, reviewing margins, and understanding how operational scale affects profitability. The model also helps organize startup capital requirements, payroll planning, fixed expenses, variable costs, and monthly cash flow so users can see whether the business can support growth without running into liquidity problems. For funding preparation, the White Labeling Financial Model provides a professional structure for presenting key financial outputs to investors, lenders, partners, or stakeholders. Users can evaluate expected profitability, break-even timing, cash flow dynamics, return metrics, and multiple operating scenarios in one connected model. Because the assumptions are editable, the template can be adapted to different white label business models, product mixes, pricing strategies, supplier terms, and sales channels while still maintaining a clear forecasting structure. The template is designed to save time, improve planning discipline, and support better decision-making. It helps users compare possible outcomes, identify cost pressures, estimate when the business may become profitable, and prepare a more credible business plan or funding document. Whether you are launching a new private label brand, building a white label manufacturing operation, expanding a reseller business, or advising a client, this financial model template gives you a practical tool for forecasting the financial path of the business over time.
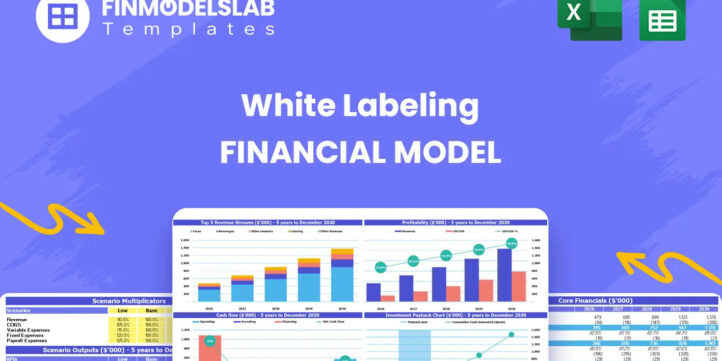


Financial Model Overview
The White Labeling Financial Model is a ready-to-use financial model template built for entrepreneurs, founders, business owners, consultants, analysts, and planners who need to evaluate the financial potential of a white label or private label product business. It provides a structured way to forecast revenue, cost of goods sold, operating expenses, startup investment, profitability, cash flow, and return metrics across a multi-year planning period. White labeling businesses often rely on several moving parts at once, including product sourcing, manufacturing or assembly, branding, fulfillment, pricing, client demand, supplier terms, and production volume. This model brings those assumptions together in one editable framework so users can replace guesswork with a more organized planning process. It is useful for validating a launch plan, preparing investor or lender materials, comparing growth scenarios, estimating funding needs, and making day-to-day decisions about pricing, product mix, staffing, and operating scale.
All-in-One Dashboard
The all-in-one dashboard gives users a central view of the most important inputs and outputs in the White Labeling Financial Model. It is designed to connect core assumptions such as product pricing, unit volume, cost structure, payroll, operating expenses, capital investment, and funding needs with the resulting financial outputs, including revenue, gross profit, EBITDA, net income, cash position, and investment returns. For a white label business, this is valuable because decisions about product mix and production scale can quickly affect margins and cash flow. A dashboard view helps users avoid jumping between disconnected worksheets and instead see how changes in assumptions flow through the model. Entrepreneurs can use it to review the overall financial plan, consultants can use it to explain the forecast to clients, and investors or lenders can use it to understand the business at a glance. Because the dashboard is built for practical decision-making, it helps users identify whether the plan is financially balanced, whether expenses are aligned with growth, and whether the business can support the startup capital and working capital required to operate.
Low Base High Scenario Analysis
The low, base, and high scenario analysis component helps users compare how the white labeling business may perform under different market conditions. Instead of relying on a single forecast, the model allows users to test a conservative case, an expected case, and a more optimistic case by adjusting key drivers such as sales volume, price per unit, production capacity, supplier costs, payroll requirements, marketing spend, and operating expenses. This is especially important in white label and private label businesses because demand can vary by product category, client acquisition speed, seasonality, supplier pricing, and channel performance. The low scenario can help users understand downside risk and cash flow pressure, while the high scenario can show the potential impact of faster adoption or stronger margins. The base case provides a realistic operating plan for budgeting and funding discussions. This component is useful for risk management, investor presentations, lender conversations, and internal planning because it shows how sensitive the business is to changes in revenue growth and cost assumptions. It also helps users prepare contingency plans before problems appear in actual operations.
Professional Charts
The professional charts component converts key financial data into presentation-ready visuals that make the forecast easier to understand. White labeling businesses can involve complex financial relationships, including revenue growth across product lines, changing gross margins, startup investment, operating leverage, EBITDA improvement, cash balance movement, and return metrics. Charts help simplify these outputs so users can quickly communicate the story behind the numbers. This section may include visual summaries of revenue, profitability, expenses, cash flow, margin trends, and other performance indicators that are relevant to investors, lenders, internal teams, or strategic partners. For a founder preparing a business plan, charts can make the financial section more persuasive and easier to explain. For consultants and analysts, they provide a polished way to summarize conclusions without manually building separate visuals. The charts also support decision-making by making trends easier to spot, such as when revenue growth begins to outpace fixed costs or when cash flow turns positive. Because they are connected to the model’s assumptions, the visuals update as users refine their inputs, making them useful throughout planning, revision, and presentation stages.
ROE Components and DuPont Analysis
The ROE components section uses DuPont-style analysis to help users understand what is driving return on equity in the white labeling business. Rather than showing a single return figure without context, this component breaks performance into underlying factors that may include profitability, asset efficiency, and leverage. For a white label operation, return on equity can be influenced by gross margin, operating expense discipline, capital investment, inventory or working capital needs, debt structure, and the ability to scale production without adding excessive overhead. This section helps users examine whether returns are being generated from healthy margins, efficient use of assets, or financial leverage. It can also highlight weaknesses in the forecast, such as strong sales growth that does not translate into attractive returns because of high production costs or heavy operating expenses. Investors and stakeholders often want to know not only whether a business can grow, but whether it can convert that growth into efficient returns. DuPont analysis provides a more detailed view of financial performance and helps users make better decisions about pricing, cost controls, asset purchases, funding structure, and long-term growth strategy.
Revenue Inputs
The revenue inputs component is where users define the commercial assumptions that drive the white labeling forecast. This section may include unit sales volumes, sales prices per unit, annual growth rates, product categories, channel assumptions, production capacity, client demand, and timing of revenue ramp-up. In a white label business, revenue is typically driven by how many units are produced or sourced and the price charged for each product or contract. The model can be adapted for multiple product lines, such as skincare products, supplements, essential oils, apparel printing, electronics assembly, or other private label goods. By entering assumptions at the product level, users can create a forecast that reflects the actual structure of their business rather than a generic sales estimate. The revenue inputs section is useful because it forces the user to think through the practical drivers behind growth, including how many clients or orders are needed, what pricing strategy will be used, and how quickly production can scale. These assumptions then feed into revenue forecasts, margin calculations, cash flow projections, and profitability outputs, making this one of the most important planning areas in the model.
Bank-Ready Reports
The bank-ready reports component organizes the financial outputs into a format suitable for lender reviews, funding discussions, business plans, and stakeholder presentations. These reports may include projected profit and loss statements, cash flow forecasts, balance sheet outputs, key assumptions, debt service considerations, profitability metrics, and summary financial tables. A white labeling business may need funding for startup costs, production equipment, inventory, technology development, staff, marketing, or working capital, and lenders typically want to see whether the business can generate enough cash to cover operating obligations and repayment requirements. This component helps users present the forecast in a more professional and lender-friendly way. It connects operating assumptions with financial statements so users can explain how revenue, cost of goods sold, payroll, fixed expenses, capital expenditures, and financing decisions affect the overall plan. Bank-ready reports also support credibility because they show that the business has been reviewed from multiple financial angles, not just revenue potential. For entrepreneurs and advisors, this can save time when preparing loan applications, investor decks, partner proposals, or internal approval documents.
Revenue Breakdown
The revenue breakdown component gives users a detailed view of how total revenue is generated across individual white label product streams. Instead of showing only a single top-line number, this section separates revenue by product category, business line, service type, or sales channel so users can see which parts of the business are contributing most to growth. This is important for white labeling because different products can have very different price points, margin profiles, order volumes, supplier costs, production requirements, and scalability. For example, a high-volume product may generate large revenue but lower margins, while a premium or specialized product may produce stronger profitability with fewer units. The revenue breakdown helps users identify which product lines deserve more investment, which products may need repricing, and which assumptions may be too aggressive. It can also support inventory planning, supplier negotiations, marketing allocation, and production scheduling. By linking revenue streams to the broader financial forecast, this component helps users understand not only how much revenue the business may generate, but where that revenue comes from and how each stream affects profitability and cash flow.
KPI Dashboard
The KPI dashboard tracks the performance metrics that matter most for managing and evaluating a white labeling business. It may include revenue growth, gross margin, EBITDA margin, net profit margin, cash balance, operating expense ratio, return on equity, payback period, break-even timing, average selling price, unit economics, and other benchmarks connected to the model. This section is useful because financial statements can be detailed, but decision-makers often need a concise way to monitor whether the business is moving in the right direction. For founders, the KPI dashboard can support monthly reviews and strategic planning. For consultants and analysts, it provides a simple way to communicate performance drivers to clients. For investors and lenders, it highlights whether the business is scaling efficiently and whether assumptions are reasonable compared with expected industry performance. The dashboard can also help users identify warning signs, such as declining margins, rising overhead, delayed cash generation, or weak returns. Since the KPIs are based on the model’s inputs and outputs, users can update assumptions and immediately see how key metrics change, making this component useful for both planning and ongoing review.
Startup Cost Breakdown
The startup cost breakdown component helps users estimate the initial investment required before the white labeling business begins generating meaningful revenue. Startup costs may include business formation, legal setup, branding, product development, prototype work, supplier onboarding, initial inventory, office setup, furnishings, IT equipment, client portal development, software, licenses, deposits, launch marketing, and working capital reserves. For a white label operation, upfront costs can be significant because the business may need to establish product quality standards, secure supplier relationships, build customer-facing systems, and prepare production or fulfillment processes before the first major sales cycle. This section separates one-time startup expenses from recurring operating costs so users can understand the true amount of funding needed to launch. It also helps prevent undercapitalization, which is a common risk for product-based businesses. By organizing startup costs in a clear format, the model supports funding requests, investor discussions, and internal budgeting. Users can adjust each line item to reflect their own business plan, compare required capital against available funding, and determine whether launch timing or scope should be modified to reduce financial risk.
Break-Even Analysis
The break-even analysis component helps users estimate when the white labeling business may become self-sustaining by comparing cumulative revenue against fixed costs, variable costs, startup investment, and ongoing operating expenses. This section may use assumptions such as unit pricing, gross margin, production volume, cost of goods sold, payroll, rent, software, marketing spend, administrative costs, and other overhead to determine the point at which the business covers its cost structure. For a white label business, break-even timing is especially important because early months may involve setup costs, slower sales ramp-up, supplier minimums, marketing investment, and staffing expenses before revenue reaches scale. The break-even analysis gives founders and stakeholders a clear target for the level of sales activity needed to move from losses to profitability. It can also help users test strategies for reaching break-even faster, such as increasing prices, prioritizing higher-margin product lines, reducing variable costs, negotiating supplier terms, controlling payroll growth, or launching with a narrower product range. This component is valuable for business planning, funding preparation, and decision-making because it turns profitability into a measurable milestone rather than a vague expectation.
File types:
Excel – Single-User: .xlsx
Excel – Multi-User: .xlsx
Similar ProductsOther customers were also interested in...

 HenrySheykin
Private Labeling Financial Model Excel Template
The Private Labeling Financial Model Financial Model Template helps entrepreneurs, founders, busines... Read more
Online Clothing Store Financial Model Excel Templa...
The Online Clothing Store Financial Model helps founders, entrepreneurs, business owners, consultant... Read more
Dropshipping Financial Model Excel Template
The Dropshipping Business Financial Model helps entrepreneurs, founders, consultants, analysts, and ... Read more
C2B Financial Model Excel Template
The C2B Platform Financial Model Financial Model Template helps users evaluate the financial potenti... Read more
C2C Financial Model Excel Template
The C2C Platform Financial Model helps founders, entrepreneurs, consultants, analysts, and business ... Read more
E-com Simple Financial Model Excel Template
The E-Commerce Business Financial Model Template helps founders, online store owners, consultants, a... Read more
Wholesaling E-Commerce Financial Model Excel Templ...
The Wholesale Business Financial Model helps entrepreneurs, founders, business owners, consultants, ... Read more
Surprise Subscription Box Financial Model Excel Te...
The Subscription Box Financial Model Template helps entrepreneurs, founders, analysts, consultants, ... Read more
Book Subscription Box Financial Model Excel Templa...
The Book Subscription Box Financial Model helps founders and planners turn a monthly book box idea i... Read more
B2C Financial Model Excel Template
The B2C Business Financial Model Financial Model Template helps entrepreneurs, founders, business ow... Read more
You must log in to submit a review.