
0 ITEMS

Private Labeling Financial Model Excel Template
The Private Labeling Financial Model Financial Model Template helps entrepreneurs, founders, business owners, consultants, and analysts turn a private label manufacturing or co-packing concept into a structured financial forecast. Instead of building a spreadsheet from scratch, users can work from a ready-to-use model designed around the economics of private label production, including product lines, production volumes, pricing, cost of goods sold, staffing, capital investment, operating expenses, cash flow, and profitability. It gives users a practical way to evaluate whether a private label business can scale profitably and how much funding may be required before launch or expansion. This template is especially useful for people preparing business plans, investor materials, lender submissions, internal budgets, or strategic growth plans. Private labeling often requires upfront spending on equipment, tooling, facility setup, quality control, inventory, packaging, and working capital, so a clear financial model is essential before committing capital. The template helps users document revenue assumptions, estimate startup costs, forecast operating expenses, plan payroll, analyze margins, and understand how production volume affects profit. It also supports better decision-making by showing how changes in pricing, raw material costs, customer demand, or staffing levels can impact cash flow and long-term performance. The model is built to provide up to five years of financial projections, giving users a longer-term view of revenue growth, EBITDA, net income, cash position, and funding needs. It includes editable assumptions and pre-built formulas so users can customize the forecast for skincare, supplements, food products, household goods, pet products, essential oils, or other private label categories. Whether the business is launching its first product line, expanding manufacturing capacity, adding new customers, or preparing for investor discussions, the model helps organize the numbers into a professional and investor-ready format. By connecting revenue drivers, cost structure, startup investment, cash flow, profitability, break-even analysis, and performance metrics in one place, the Private Labeling Financial Model Financial Model Template helps users move from rough estimates to a more disciplined financial planning process. It is designed for practical use in Excel or Google Sheets and can support funding conversations, operational planning, pricing decisions, scenario testing, and ongoing financial management for a private label business.
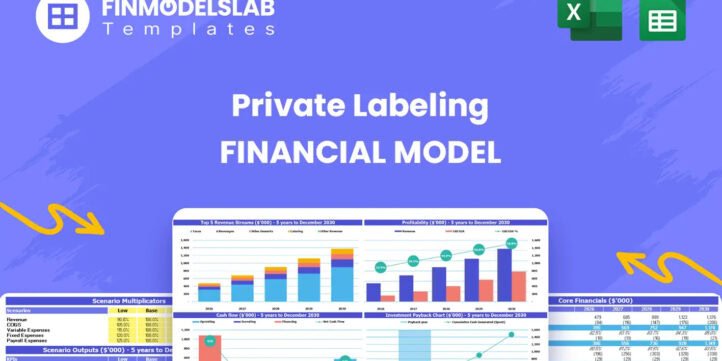


Financial Model Overview
The Private Labeling Financial Model Financial Model Template gives founders, entrepreneurs, business owners, consultants, and analysts a structured way to evaluate the financial potential of a private label manufacturing or co-packing business. Private labeling can be highly attractive because it allows brands to sell finished goods without building every capability from the ground up, but the economics can become complex quickly. Users need to understand product pricing, unit volumes, raw material costs, packaging, labor, equipment, quality control, warehousing, customer contracts, cash collection, and working capital requirements. This template brings those assumptions into one editable model so users can forecast revenue, startup investment, operating expenses, margins, cash flow, profitability, investor returns, and funding needs over a multi-year period. It is designed to help users replace scattered estimates with a professional planning tool that can support business plans, investor presentations, lender conversations, internal budgeting, and operational decision-making.
All-in-One Dashboard
The all-in-one dashboard gives users a central view of the core inputs and core outputs that drive the Private Labeling Financial Model. Rather than forcing users to search through multiple sheets to understand performance, the dashboard summarizes the most important business assumptions and financial results in one practical workspace. Inputs may include product line assumptions, pricing, production volumes, cost of goods sold, operating expense categories, staffing levels, capital expenditures, working capital assumptions, and financing structure. Outputs may include revenue, gross profit, EBITDA, net income, cash balance, return metrics, break-even timing, and other key financial indicators. This component is useful because private label businesses are driven by many moving parts, and a centralized dashboard helps users quickly see how decisions about pricing, scale, production efficiency, and investment affect the overall forecast. For planning and funding purposes, it also provides a clear starting point for reviewing the business model with investors, lenders, advisors, or internal stakeholders.
Low Base High Scenario Analysis
The low, base, and high scenario analysis section helps users test how the private label business may perform under different market and operating conditions. A base case can reflect the expected plan, while the low case can show what happens if sales volume grows more slowly, raw material costs increase, labor becomes more expensive, or customer acquisition takes longer than expected. The high case can show the upside potential if larger client contracts are secured, production scales faster, pricing improves, or manufacturing efficiency increases. Inputs may include unit sales, price per unit, cost of goods sold, payroll growth, overhead assumptions, capital investment timing, and customer demand. Outputs can show how each scenario affects revenue, gross margin, EBITDA, net income, cash flow, cash runway, funding needs, and investor returns. This is especially valuable for private labeling because the business can be sensitive to volume, utilization, and input costs. Scenario planning helps users prepare for risk, communicate assumptions clearly, and make better decisions before committing to equipment, hiring, inventory, or financing.
Professional Charts
The professional charts section converts the model’s financial projections into clear visual reports that are easier to review and present. Private label financial forecasts often contain detailed monthly and annual calculations, but stakeholders usually need a concise way to understand the story behind the numbers. This component may visualize revenue growth, gross profit, EBITDA, net income, cash balance, operating expenses, product mix, cost structure, break-even progress, and other important trends. Users can rely on the charts to identify whether the business is scaling efficiently, whether margins are improving, whether cash remains stable, and whether profitability is developing as planned. The value of this section is both analytical and presentation-focused. It helps users spot trends that may be difficult to see in rows of numbers, and it also supports investor-ready communication by turning complex financial data into clean, readable visuals. For a founder pitching a private label operation, professional charts can make the financial plan easier to explain and more credible in discussions with investors, banks, partners, or management teams.
ROE Components and DuPont Analysis
The ROE components and DuPont analysis section helps users understand the drivers behind return on equity rather than looking at a single return figure in isolation. In a private label business, return on equity can be influenced by profitability, asset efficiency, leverage, inventory requirements, equipment investment, and the pace at which production capacity is utilized. This component may break return on equity into underlying factors such as net profit margin, asset turnover, and equity multiplier, allowing users to see whether returns are being driven by operating performance, capital efficiency, or financing structure. Inputs can come from the income statement, balance sheet, and financing assumptions, while outputs provide a more detailed view of how effectively the business converts invested capital into returns. This is useful for investor discussions because private label manufacturing can require meaningful upfront investment in equipment, tooling, lab setup, production lines, and working capital. DuPont analysis helps users evaluate whether the business is improving because margins are expanding, assets are being used more productively, or leverage is changing, giving decision-makers a more complete view of financial performance.
Revenue Inputs
The revenue inputs section is where users define the commercial assumptions that power the financial forecast. For a private labeling business, revenue is typically driven by the number of product lines, expected production volume, selling price per unit, customer demand, contract size, repeat orders, and production capacity. Users can model products such as skincare creams, protein bars, essential oil blends, eco-friendly detergents, pet supplements, or any other private label category by adjusting pricing, units sold, and growth assumptions. This section may also allow users to separate revenue assumptions by product type, customer segment, or production line, making it easier to reflect the specific business plan. The outputs flow into projected sales, gross revenue, revenue growth, product mix, and profitability calculations. A strong revenue input structure is essential because small changes in price or volume can materially affect gross profit, cash flow, and break-even timing. This component helps users build a more realistic forecast, test customer demand assumptions, evaluate pricing strategy, and present a transparent revenue model to investors or lenders.
Bank-Ready Reports
The bank-ready reports section organizes the model’s financial outputs into a format suitable for lenders, investors, advisors, and other stakeholders who need to review the financial viability of the business. Private label businesses often require external funding for manufacturing equipment, facility setup, working capital, raw materials, packaging inventory, quality control systems, and early operating losses, so professional reporting is important. This component may include projected income statements, cash flow statements, balance sheets, debt schedules, financing assumptions, profitability summaries, and key financial metrics. Inputs from the revenue forecast, expense plan, payroll schedule, capital expenditure plan, and financing structure are automatically connected to produce lender-friendly outputs. The value of this section is that it helps users present the business in a more credible and organized way. Banks and investors typically want to see how the business will generate revenue, cover operating expenses, service debt, maintain liquidity, and reach profitability. Bank-ready reports help answer those questions clearly and reduce the need for users to manually reformat projections for funding conversations.
Revenue Breakdown
The revenue breakdown section provides a more detailed view of how sales are generated across different revenue streams, products, or private label manufacturing categories. Instead of only showing total revenue, this component helps users understand which product lines contribute the most to sales, which categories may carry higher prices, and how the mix of products affects overall business performance. Inputs may include units produced and sold by product, selling price per unit, annual growth rates, contract volume, customer order size, and any assumptions about product launches or expansion into additional categories. Outputs can include revenue by product line, percentage contribution by category, year-over-year growth, average selling price impact, and total sales performance over the forecast period. This is useful because private label companies may have very different margin profiles across product types. A skincare product, supplement, food item, household product, or co-packed specialty item may require different raw materials, packaging, labor, and quality standards. By breaking revenue into specific streams, users can make better pricing decisions, prioritize higher-value products, and evaluate whether the overall revenue mix supports sustainable profitability.
KPI Dashboard
The KPI dashboard helps users monitor the performance metrics that matter most for a private labeling financial plan. While the all-in-one dashboard provides a broad overview, the KPI dashboard focuses specifically on performance indicators that can be tracked and benchmarked over time. These may include revenue growth, gross margin, EBITDA margin, net profit margin, cash balance, burn rate, payback period, return on equity, internal rate of return, production volume, cost of goods sold as a percentage of revenue, labor cost ratio, and operating expense ratios. Users can connect these metrics to industry benchmarks or internal targets to see whether the business is performing within a reasonable range. This section is valuable for both planning and management because private label businesses depend on disciplined execution. A company may generate strong sales but still struggle if margins are too thin, production costs rise, customer payment terms create cash pressure, or overhead grows too quickly. The KPI dashboard helps users identify trends early, explain performance to stakeholders, and make informed decisions about pricing, hiring, procurement, production efficiency, and growth strategy.
Startup Costs and CAPEX Planning
The startup costs and CAPEX planning section helps users estimate the initial investment required to launch or expand a private label manufacturing operation. Private labeling can require significant upfront spending before the first customer order is fulfilled, especially when the business includes production lines, quality control equipment, tooling, molds, delivery vehicles, facility improvements, software systems, licenses, deposits, packaging setup, initial raw materials, and working capital. This component allows users to separate one-time startup expenses from recurring operating expenses so they can understand how much cash is needed before revenue begins and how those investments affect the five-year forecast. Inputs may include equipment purchases, manufacturing line setup, laboratory equipment, facility buildout, legal and licensing costs, launch marketing, initial inventory, technology, and contingency reserves. Outputs may include total startup capital required, timing of cash outflows, depreciation assumptions, funding needs, and the impact of capital expenditures on cash flow and balance sheet projections. This section is useful for budgeting, investor conversations, lender applications, and internal planning because it helps users avoid underestimating the true cost of launching a private label operation.
Break-Even Analysis
The break-even analysis section helps users determine when the private label business is expected to cover its costs and begin generating cumulative profit. This is one of the most important questions for founders, investors, and lenders because private label operations often experience early losses while production ramps up, customers are acquired, and fixed costs are absorbed. Inputs may include sales volume, average selling price, gross margin, fixed operating expenses, payroll, cost of goods sold, startup costs, financing costs, and monthly cash flow assumptions. Outputs can show the break-even month, revenue required to break even, units required to break even, cumulative profit or loss, and the relationship between volume, margin, and overhead. This component helps users understand whether the current plan is realistic and what levers can improve the path to profitability. For example, users may test the impact of higher-margin product lines, better supplier pricing, reduced overhead, delayed hiring, larger customer contracts, or improved production efficiency. Break-even analysis is especially useful for decision-making because it gives users a clear profitability milestone and helps them evaluate whether the business can support its cost structure within a reasonable timeframe.
File types:
Excel – Single-User: .xlsx
Excel – Multi-User: .xlsx
Similar ProductsOther customers were also interested in...

 HenrySheykin
Online Clothing Store Financial Model Excel Templa...
The Online Clothing Store Financial Model helps founders, entrepreneurs, business owners, consultant... Read more
White Labeling Financial Model Excel Template
The White Labeling Financial Model helps entrepreneurs, founders, consultants, analysts, and busines... Read more
C2B Financial Model Excel Template
The C2B Platform Financial Model Financial Model Template helps users evaluate the financial potenti... Read more
Dropshipping Financial Model Excel Template
The Dropshipping Business Financial Model helps entrepreneurs, founders, consultants, analysts, and ... Read more
E-com Simple Financial Model Excel Template
The E-Commerce Business Financial Model Template helps founders, online store owners, consultants, a... Read more
Wholesaling E-Commerce Financial Model Excel Templ...
The Wholesale Business Financial Model helps entrepreneurs, founders, business owners, consultants, ... Read more
C2C Financial Model Excel Template
The C2C Platform Financial Model helps founders, entrepreneurs, consultants, analysts, and business ... Read more
E-Commerce Software Financial Model Excel Template
The E-Commerce Platform Financial Model Financial Model Template helps founders, entrepreneurs, cons... Read more
Surprise Subscription Box Financial Model Excel Te...
The Subscription Box Financial Model Template helps entrepreneurs, founders, analysts, consultants, ... Read more
Book Subscription Box Financial Model Excel Templa...
The Book Subscription Box Financial Model helps founders and planners turn a monthly book box idea i... Read more
You must log in to submit a review.