
0 ITEMS

Pharmacy Financial Model Excel Template
The Pharmacy Financial Model template helps entrepreneurs, pharmacy owners, consultants, analysts, and business plan writers turn a retail pharmacy concept into a structured financial forecast. Instead of relying on a generic spreadsheet, this model is designed around the real economics of a pharmacy, including prescription volume, over-the-counter sales, wellness products, clinical services, reimbursement timing, inventory costs, payroll, operating expenses, and opening capital requirements. It gives users a practical way to estimate revenue potential, startup costs, profitability, cash flow, and funding needs before launching, expanding, or presenting the business to stakeholders. Built for business planning, funding preparation, and internal decision-making, the template connects the main operating assumptions that drive pharmacy performance. Users can adjust daily store visitors, buyer conversion rates, repeat customer behavior, average order values, product mix, cost of goods sold, PBM fees, staffing levels, supplier costs, and other variables to see how changes affect projected results. This makes it useful for independent pharmacy startups, acquisition planning, retail drugstore expansion, or feasibility studies where accurate financial planning is essential. The model supports a complete five-year forecast with revenue assumptions, startup costs, operating expenses, payroll planning, cash flow projections, profitability analysis, break-even analysis, and investor-focused outputs. It helps users understand whether the pharmacy can support its cost structure, when it may become profitable, how much capital may be required, and which assumptions have the greatest impact on financial performance. Pre-built formulas, editable fields, and organized reports reduce the time needed to build a forecast from scratch while still allowing full customization for a specific business strategy. This Pharmacy Financial Model is also useful for presentations to lenders, investors, partners, and internal teams. The template includes dashboards, scenario planning, charts, KPI views, revenue breakdowns, bank-ready reports, and financial metrics that make the forecast easier to explain and defend. Whether you are preparing a pharmacy business plan, evaluating a new location, testing growth options, or reviewing funding requirements, this ready-to-use financial model template provides a clear framework for smarter budgeting, planning, and decision-making.
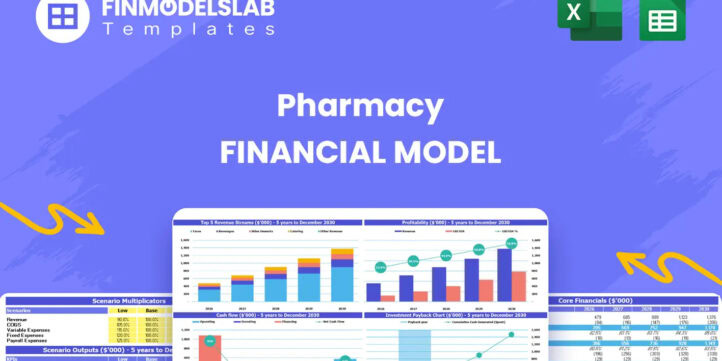


Financial Model Overview
The Pharmacy Financial Model template is a ready-to-use planning tool designed to help users forecast the financial performance of a retail pharmacy, independent drugstore, or pharmacy business expansion. It brings together the assumptions that matter most in pharmacy operations, including prescription revenue, over-the-counter product sales, wellness supplements, immunizations and clinical services, inventory costs, PBM fees, reimbursement timing, staffing, rent, startup investment, and working capital. The model is useful because pharmacies often face complex cash flow dynamics, high inventory requirements, regulated operating needs, and multiple revenue streams that cannot be evaluated properly with a generic spreadsheet. This template gives entrepreneurs, pharmacy owners, consultants, analysts, and funding applicants a structured way to estimate revenue, costs, profitability, cash flow, and capital needs over a multi-year forecast. It is fully editable, compatible with Excel and Google Sheets, and formatted for business planning, lender discussions, investor presentations, and internal decision-making. By organizing the core assumptions and outputs in one model, the Pharmacy Financial Model helps users move from guesswork to a more disciplined financial planning process.
All-in-One Dashboard
The all-in-one dashboard gives users a central view of the most important inputs and outputs in the Pharmacy Financial Model. It is designed to make the model easier to navigate by bringing together key assumptions, financial results, and performance indicators in one place. Users can review headline figures such as projected revenue, gross profit, EBITDA, net income, cash balance, payback timing, and investment return without searching through every worksheet. The dashboard may also summarize pharmacy-specific drivers such as daily store visitors, conversion rates, repeat customers, order frequency, average order value, revenue stream mix, and cost assumptions. This component is valuable for planning and decision-making because it allows founders, managers, consultants, and investors to quickly understand how the pharmacy is expected to perform. If an assumption changes, the dashboard reflects the impact through connected calculations, helping users identify whether the business plan remains financially viable. It is especially useful during stakeholder meetings because it converts detailed spreadsheet calculations into a more accessible executive summary. For a pharmacy business, where inventory, staffing, customer volume, and reimbursement timing can all affect results, a consolidated dashboard helps users monitor the relationship between operating assumptions and financial outcomes. It supports faster review, clearer communication, and more confident decisions when preparing a pharmacy business plan, funding package, or internal budget.
Low, Base, and High Scenario Analysis
The low, base, and high scenario analysis section helps users test how different operating conditions may affect the pharmacy’s financial performance. Instead of relying on a single forecast, the model allows users to compare a conservative case, a realistic base case, and an optimistic growth case. Inputs may include daily store traffic, customer conversion rate, repeat purchase behavior, prescription volume, average order value, clinical service uptake, product margins, payroll levels, inventory costs, and reimbursement delays. The outputs show how these changing assumptions influence revenue, gross margin, EBITDA, cash flow, break-even timing, and funding needs. This component is useful because pharmacy planning involves uncertainty. A new location may attract fewer visitors than expected, insurance reimbursements may take longer, supplier costs may rise, or staffing needs may increase. Scenario analysis helps users understand the downside risk before committing capital and also shows what could happen if marketing, customer retention, or service expansion performs better than expected. For investors and lenders, multiple scenarios make the forecast more credible because they demonstrate that management has considered both opportunity and risk. For owners and operators, the section supports contingency planning by showing which assumptions have the largest impact on profitability and liquidity. This makes the Pharmacy Financial Model more practical for strategic planning, budgeting, and funding preparation.
Professional Charts
The professional charts section converts the pharmacy’s financial projections into clear visual reports that are easier to understand and present. These charts may display revenue growth, gross profit trends, operating expenses, EBITDA, net income, cash balance, payback timeline, and other performance indicators over the forecast period. Instead of presenting stakeholders with only rows of spreadsheet data, users can rely on visual summaries to communicate the financial story of the pharmacy. This is particularly useful when preparing investor decks, lender materials, business plan appendices, or internal management reviews. Inputs from the model, such as revenue assumptions, expense categories, payroll, inventory costs, and cash flow projections, feed the chart outputs automatically, reducing manual formatting work and helping maintain consistency across the forecast. For a pharmacy, visual analysis can make it easier to explain how prescription growth, over-the-counter sales, wellness products, and clinical services contribute to total revenue. It can also show how margins improve as the business scales or how cash balances change as startup investment is deployed. Professional charts help users identify trends, compare years, and highlight financial milestones. They also make the model more presentation ready, which is valuable when a founder or consultant needs to communicate complex financial data to people who may not want to inspect detailed spreadsheet tabs. This component improves both analysis and communication.
ROE Components and DuPont Analysis
The ROE components and DuPont analysis section helps users evaluate the pharmacy’s return on equity by breaking it into the underlying drivers of financial performance. Rather than showing return on equity as a single output, this component helps explain why the return is changing and what parts of the business model are contributing to the result. DuPont analysis typically connects profitability, asset efficiency, and financial leverage, which may include net profit margin, asset turnover, and equity multiplier. For a pharmacy, this can be especially useful because the business may require significant inventory investment, dispensing equipment, retail fixtures, working capital, and leasehold setup costs. The model can help users see whether equity returns are driven by strong operating margins, efficient use of assets, or the level of financing used in the business. Inputs may include net income, revenue, total assets, owner equity, liabilities, and balance sheet assumptions generated by the financial forecast. Outputs help founders, investors, and analysts understand whether the pharmacy is producing attractive returns relative to the capital invested. This component is valuable for funding conversations because investors often want to know not only whether the business is profitable, but also whether it uses capital efficiently. It also helps management evaluate operational improvements, such as reducing inventory holding costs, improving sales per square foot, increasing high-margin product lines, or managing debt responsibly. By decomposing return on equity, the Pharmacy Financial Model provides a more analytical view of long-term financial quality.
Revenue Inputs
The revenue inputs section is one of the core planning areas of the Pharmacy Financial Model because it defines how the pharmacy is expected to generate sales. This component allows users to build the forecast from operational drivers rather than entering only a top-line revenue number. Inputs may include daily store visitors, customer conversion rates, the percentage of repeat customers, monthly order frequency, average transaction value, prescription volume, over-the-counter purchases, wellness supplement sales, immunization demand, and clinical service revenue. Users can adjust assumptions over time to reflect marketing efforts, customer loyalty, new service launches, local competition, seasonal changes, or growth in pharmacy awareness. The outputs generated from these assumptions flow into the revenue forecast, profit and loss statement, cash flow projections, KPI dashboard, and scenario analysis. This section is valuable because pharmacy revenue is usually diversified across multiple product and service lines, each with different margins, purchase frequency, and growth potential. Prescription drugs may drive traffic, while wellness products and clinical services may improve margin performance. By making revenue assumptions transparent and editable, the model helps users explain how sales are expected to develop and whether the forecast is realistic. It also supports decision-making by allowing users to test how changes in customer traffic, conversion, repeat orders, or average order value affect total revenue and profitability. For business plans and funding documents, clear revenue inputs make the forecast more credible and easier to defend.
Bank-Ready Reports
The bank-ready reports section provides structured financial outputs that can support loan applications, funding discussions, and stakeholder review. Lenders and financial partners typically need more than a revenue forecast; they want to see organized financial statements, assumptions, cash flow projections, profitability metrics, debt service capacity, and evidence that the business can manage its obligations. This component helps present the Pharmacy Financial Model in a lender-friendly format by summarizing the outputs that matter most for financing decisions. Inputs from the revenue forecast, startup cost plan, operating expense budget, payroll assumptions, inventory costs, working capital needs, and financing assumptions are converted into reports that may include income statements, cash flow statements, balance sheet summaries, EBITDA, net income, monthly cash balances, and key ratios. For a pharmacy, this is especially important because initial capital needs may include inventory, dispensing equipment, retail fixtures, technology, licenses, deposits, and opening working capital. A lender will want to understand how these funds are used and how the pharmacy will generate enough cash to repay financing. Bank-ready reports reduce the time required to prepare professional financial documentation and help users communicate the business case in a clear, consistent way. They are useful for founders seeking startup loans, owners planning expansion financing, consultants preparing client deliverables, or analysts supporting feasibility studies. This component strengthens the practical value of the template for real-world funding preparation.
Revenue Breakdown
The revenue breakdown section gives users a detailed view of how different product and service lines contribute to total pharmacy revenue. Instead of treating the pharmacy as one single sales category, the model can separate streams such as prescription drugs, over-the-counter remedies, wellness supplements, immunizations, and clinical services. Each stream may have its own assumptions for pricing, volume, growth, margin, and customer demand. This component helps users understand which revenue sources are expected to drive the business and how the sales mix changes over time. The outputs can show the percentage contribution of each stream, annual and monthly revenue by category, and the impact of product mix on gross profit. This is important because not all pharmacy sales have the same economics. Prescription revenue may be high volume but affected by reimbursement rates and PBM fees, while wellness supplements or clinical services may offer different margin opportunities. By breaking revenue into categories, users can identify whether the pharmacy is overly dependent on one source of income or whether growth can be improved by expanding higher-margin offerings. This section supports pricing decisions, inventory planning, staffing decisions, marketing priorities, and investor communication. It also helps users compare performance against industry benchmarks and refine the pharmacy’s commercial strategy. For a pharmacy business plan, a clear revenue breakdown makes the forecast more transparent and shows that the model has been built around the actual operating structure of the business.
KPI Dashboard
The KPI dashboard section tracks the key performance indicators that help users monitor the health and efficiency of the pharmacy business. While financial statements show overall results, KPIs help explain what is happening inside the business and whether operations are moving in the right direction. This component may include metrics such as revenue growth, gross margin, EBITDA margin, net profit margin, cash balance, customer conversion rate, repeat customer share, average order value, order frequency, sales by revenue stream, inventory-related metrics, return on equity, payback period, and break-even timing. Inputs come from the underlying forecast assumptions and financial statements, while outputs are displayed in a performance-focused format for quick review. For pharmacy owners and managers, KPIs make it easier to identify operational strengths and weaknesses. If revenue is growing but margins are declining, the dashboard may point to product mix, wholesale costs, PBM fees, or staffing pressure. If customer traffic is high but buyer conversion is low, management may need to improve merchandising, service quality, or promotional strategy. For consultants and analysts, KPI tracking helps translate detailed financial projections into management insights. For investors and lenders, it provides a concise view of whether the business can scale, control costs, and maintain liquidity. The KPI dashboard is useful throughout the life of the forecast, from initial planning to ongoing performance review, because it keeps attention focused on the drivers that matter most.
Startup Cost and Operating Expense Planning
The startup cost and operating expense planning section helps users estimate the capital required to open or prepare a pharmacy for operations and then project the recurring costs needed to run it. Startup inputs may include initial inventory purchases, pharmacy dispensing equipment, retail fixtures and shelving, POS systems, network setup, leasehold improvements, licenses, permits, professional fees, deposits, pre-opening marketing, insurance, software, and working capital reserves.
Similar ProductsOther customers were also interested in...


 HenrySheykin
Medicine Store Financial Model Excel Template
The Drugstore Financial Model helps entrepreneurs, pharmacy owners, consultants, analysts, and busin... Read more

 Giorgos
Pharmacy Store – 5 Year Financial Model
Financial Model providing an advanced 5-year financial plan for a startup or operating Pharmacy Stor... Read more

Vitamins Subscription Box Financial Model Excel Te...
The Vitamin Subscription Box Financial Model helps entrepreneurs, founders, consultants, analysts, a... Read more
Blood Bank Center Financial Model Excel Template
The Blood Bank Financial Model helps users turn a blood bank, blood collection facility, or blood ce... Read more

Chinese Medicine Center Financial Model Excel Temp...
The Traditional Chinese Medicine Clinic Financial Model helps entrepreneurs, clinic owners, consulta... Read more

 eFinancialModels
Pharma Biotech Valuation Model Template (Risk-Adju...
The Pharma Biotech Valuation Model Template calculates the risk-adjusted DCF Value of a Pharma or Bi... Read more

Pharma Biotech Financial Model incl. Risk-Adjusted...
Financial Model analyzing a Biopharmaceutical Company using a Risk-Adjusted NPV Valuation Methodolog... Read more

 City Finance
Medical Spa (MediSpa) Financial Model 5 Year 3 Sta...
Comprehensive, editable, MS Excel spreadsheet for tracking Medical Spa company finances, including y... Read more
Grocery Store Financial Model Excel Template
The Grocery Store Financial Model helps entrepreneurs, founders, consultants, analysts, and retail b... Read more
You must log in to submit a review.