
0 ITEMS

Medicine Store Financial Model Excel Template
The Drugstore Financial Model helps entrepreneurs, pharmacy owners, consultants, analysts, and business plan writers build a structured forecast for a retail pharmacy or drugstore. Instead of relying on a generic retail spreadsheet, this financial model template is designed around the economics that matter for a drugstore, including prescription sales, over-the-counter products, health and wellness items, beauty and personal care revenue, inventory costs, staffing, rent, startup costs, cash flow, and profitability. It gives users a practical way to turn operating assumptions into a clear financial plan for launch, expansion, funding, or internal decision-making. The template helps users estimate how the business may perform over time by connecting core revenue assumptions with the cost structure required to operate the store. Users can adjust store visitors, buyer conversion rates, repeat purchasing behavior, product mix, pricing, cost of goods sold, payroll, fixed expenses, capital expenditures, and working capital needs. These assumptions flow into projected financial outputs, allowing users to review potential revenue, gross margin, EBITDA, profit, cash balances, and funding requirements before committing capital or presenting the plan to stakeholders. Built for both startup planning and pharmacy expansion analysis, the Drugstore Financial Model supports practical financial planning with editable inputs and automated calculations. It can help users evaluate startup costs, operating expenses, payroll needs, inventory requirements, cash flow timing, profitability trajectory, and break-even analysis. The model is useful for preparing investor discussions, bank loan applications, internal budgets, and business plan financials because it organizes the numbers in a professional format that is easier to explain, update, and share. For decision-making, the template helps users test how different assumptions affect performance. Entrepreneurs can compare conservative, base, and upside cases, review visual charts, track KPIs, and understand how revenue streams contribute to overall performance. Business owners can use it to identify pricing gaps, manage cost pressure, estimate payback timing, and assess whether the drugstore can reach sustainable profitability. By starting with a ready-to-use financial model, users save time while gaining a more complete view of what it may take to launch, fund, and operate a drugstore successfully.
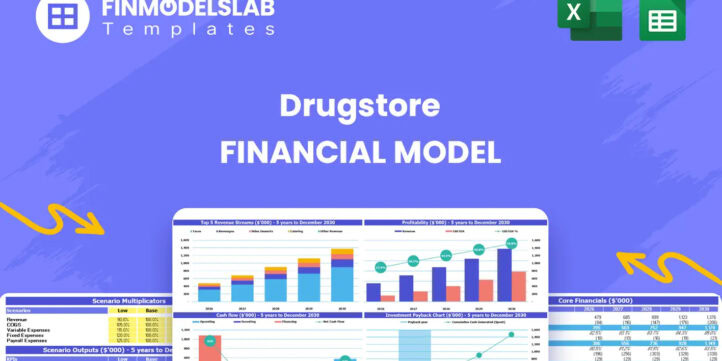


Financial Model Overview
The Drugstore Financial Model is a ready-to-use financial model template designed for planning, launching, funding, or expanding a retail pharmacy or drugstore business. It is built around the financial drivers that matter most in this industry, including prescription drug sales, over-the-counter products, health and wellness items, beauty and personal care revenue, customer traffic, repeat purchases, inventory turnover, cost of goods sold, staffing, rent, startup investment, and cash flow. The template gives entrepreneurs, pharmacy owners, consultants, analysts, and business plan writers a structured way to turn assumptions into projections for revenue, expenses, profitability, funding needs, and long-term financial performance. Instead of starting from a blank spreadsheet, users can work from a professional model that connects editable assumptions with automated outputs, helping them prepare investor discussions, lender submissions, internal budgets, and strategic decisions with greater confidence.
All-in-One Dashboard
The all-in-one dashboard brings the model’s core inputs and core outputs into one organized view so users can understand the business at a glance. It is designed to connect the most important assumptions, such as store visitors, conversion rates, customer purchase behavior, prescription sales share, front-end retail sales, pricing, cost of goods sold, payroll, rent, and startup investment, with the key outputs that decision-makers need to review. This section may show revenue, gross profit, EBITDA, net income, cash position, break-even timing, payback period, and other summary metrics in a practical format. For a drugstore, where small changes in prescription volume, product mix, inventory margin, or staffing can materially affect profitability, the dashboard helps users quickly see whether the overall plan is financially viable. It is useful for planning meetings, investor presentations, funding discussions, and internal reviews because it condenses a detailed model into a decision-ready summary without requiring users to search through every worksheet or calculation.
Low, Base, and High Scenario Analysis
The low, base, and high scenario analysis section helps users evaluate how the drugstore may perform under different operating conditions. A low scenario can be used to test weaker customer traffic, lower conversion rates, slower repeat purchases, higher supplier costs, increased rent, or more conservative prescription volumes. A base scenario can reflect the expected business plan, while a high scenario can model stronger customer acquisition, better product mix, improved margins, or faster expansion. The value of this component is that it allows users to stress-test the pharmacy business plan before making major commitments. A lender or investor will often want to understand what happens if revenue is delayed, expenses rise, or cash flow tightens, and this section helps answer those questions in a structured way. By comparing outcomes across multiple scenarios, users can identify risk points, estimate working capital needs, prepare contingency plans, and understand which assumptions have the greatest impact on profitability, liquidity, and return on investment.
Professional Charts
The professional charts section converts financial projections into visual reports that are easier to interpret and present. Instead of reviewing only spreadsheet rows and columns, users can see revenue growth, expense trends, profitability, cash flow movement, EBITDA progression, margin changes, and other important metrics in chart form. For a drugstore financial plan, visuals are especially useful because stakeholders need to understand how prescription sales, over-the-counter products, health and wellness items, and beauty or personal care categories contribute to the overall growth story. Charts can help show whether revenue is scaling faster than operating expenses, whether cash balances remain healthy, and whether profitability improves over time. This component is valuable for pitch decks, loan meetings, board discussions, and management reviews because it simplifies complex financial information into a format that is easier to explain. It also helps users spot trends, compare periods, and identify potential issues that might be missed when reviewing raw numbers alone.
ROE Components and DuPont Analysis
The ROE components and DuPont analysis section helps users understand the drivers behind return on equity and overall capital efficiency. Rather than showing return on equity as a single number, this component breaks performance into underlying elements such as profitability, asset efficiency, and leverage. For a drugstore, this can help users evaluate whether shareholder returns are being driven by strong margins, efficient use of assets, appropriate financing structure, or a combination of factors. Inputs may include net income, revenue, total assets, equity, debt levels, and financial statement outputs generated elsewhere in the model. The section is useful for founders and investors because it connects operational performance with investment performance. A drugstore may appear profitable, but DuPont analysis can show whether that profitability is supported by sustainable operations or by excessive leverage. This makes the model more useful for funding preparation, investor conversations, and strategic decision-making, especially when evaluating expansion, refinancing, or capital allocation.
Revenue Inputs
The revenue inputs section is where users define the commercial assumptions that drive the drugstore’s sales forecast. It may include daily store visitors, weekday and weekend traffic patterns, conversion rates, new customer purchases, repeat customer frequency, average selling prices, revenue mix by category, and growth assumptions over time. For a drugstore, this section should reflect both pharmacy-related revenue and front-end retail revenue, including prescription drugs, over-the-counter products, health and wellness products, beauty items, personal care products, and other merchandise categories. Because revenue is one of the most sensitive parts of the forecast, editable inputs are essential. Users can adjust prescription pricing, sales mix, repeat purchase frequency, and customer growth to match their location, target market, competitive environment, and business strategy. This component is useful because it makes the forecast transparent. Instead of relying on a single top-line sales estimate, users can see exactly which assumptions create the revenue forecast and can update them as new market data, supplier terms, or operating results become available.
Bank-Ready Financial Reports
The bank-ready financial reports section organizes the model’s outputs into lender-friendly financial statements and summaries. It may include projected profit and loss statements, cash flow forecasts, balance sheet projections, EBITDA summaries, debt service visibility, working capital estimates, and other financial outputs commonly reviewed by banks, investors, and stakeholders. For a drugstore seeking startup financing, working capital support, equipment financing, or expansion funding, this section is especially important because funders want to see whether the business can generate enough cash to cover operating expenses, inventory purchases, payroll, rent, loan payments, and owner obligations. The reports help translate operational assumptions into professional financial statements, making it easier to support a business plan or funding request. They also help users review whether the forecast is internally consistent, whether cash flow remains positive, and whether the business has a credible path to profitability. This component saves time by providing structured financial outputs that can be shared with advisors, lenders, or investors without rebuilding reports from scratch.
Revenue Breakdown
The revenue breakdown section gives users a detailed view of how each revenue stream contributes to total sales. For a drugstore, this is critical because not all sales categories behave the same way or produce the same margins. Prescription drugs may represent a major share of revenue, while over-the-counter products, health and wellness items, beauty and personal care products, and other front-end categories may carry different growth rates, pricing assumptions, customer behavior, and gross margins. This section helps users separate the revenue forecast by category so they can see which parts of the business are driving growth and which areas may need more attention. Inputs may include product mix percentages, average transaction values, category growth assumptions, customer purchase frequency, and price changes over time. The outputs can help users evaluate sales concentration, identify opportunities to improve high-margin categories, and assess whether the business is too dependent on a single revenue source. For planning and decision-making, this level of detail makes the forecast more credible and more actionable.
KPI Dashboard and Performance Benchmarks
The KPI dashboard and performance benchmarks section helps users monitor the drugstore’s operating and financial health using key performance indicators. It may track metrics such as revenue per customer, average transaction value, conversion rate, repeat customer contribution, gross margin, EBITDA margin, payroll as a percentage of revenue, rent burden, inventory-related cost ratios, cash balance, payback period, return on equity, and other benchmarks relevant to retail pharmacy operations. This component is useful because financial statements show results, but KPIs explain performance. For example, if profitability is lower than expected, the user can review whether the issue comes from weak traffic, low conversion, poor product mix, high COGS, inefficient staffing, or excessive overhead. Benchmarks also make the model more useful for investor and lender conversations because they help users compare assumptions against industry expectations and defend the logic behind the forecast. The dashboard supports ongoing management after launch as well, giving owners and analysts a practical way to compare actual results against the plan and adjust decisions quickly.
Startup Costs and Capital Expenditure Planning
The startup costs and capital expenditure planning section helps users estimate how much money may be required before the drugstore begins operating. This component can include store build-out and renovation, pharmacy dispensing equipment, shelving and display fixtures, point-of-sale systems, signage, security systems, deposits, licenses, permits, technology setup, opening inventory, professional fees, pre-launch marketing, and initial working capital. For a drugstore, startup investment can be significant because the business often requires a suitable retail location, compliant pharmacy equipment, inventory depth, trained staff, and operating cash before sales fully ramp up. This section helps users separate one-time capital expenditures from recurring operating expenses, making the funding plan more accurate. It can also support discussions with banks, investors, landlords, and equipment financing providers because it shows exactly where initial capital will be used. By organizing launch costs in a clear format, the model helps users avoid underestimating funding needs, plan a realistic opening budget, and understand how startup investment affects cash flow and payback timing.
Break-Even Analysis
The break-even analysis section helps users identify when the drugstore may generate enough revenue to cover its total costs. It connects sales assumptions, gross margins, cost of goods sold, payroll, rent, utilities, marketing, administrative expenses, and other operating costs to determine the point at which the business moves from loss-making to profitable. For a drugstore, break-even analysis is especially valuable because prescription volume, front-end retail sales, inventory margins, and staffing levels all influence how quickly the store can become financially sustainable. Users can adjust customer traffic, product mix, pricing, COGS, and fixed expenses to see how these changes affect the break-even date or required sales volume. This component is useful for startup planning because it helps founders understand the minimum performance needed to support the business. It is also important for funding documents because investors and lenders often want to know how long the business may need support before it can stand on its own. By highlighting the path to profitability, the break-even section supports better pricing, staffing, marketing, and cash planning decisions.
File types:
Excel – Single-User: .xlsx
Excel – Multi-User: .xlsx
Similar ProductsOther customers were also interested in...


 HenrySheykin
Pharmacy Financial Model Excel Template
The Pharmacy Financial Model template helps entrepreneurs, pharmacy owners, consultants, analysts, a... Read more

 Giorgos
Pharmacy Store – 5 Year Financial Model
Financial Model providing an advanced 5-year financial plan for a startup or operating Pharmacy Stor... Read more

Vitamins Subscription Box Financial Model Excel Te...
The Vitamin Subscription Box Financial Model helps entrepreneurs, founders, consultants, analysts, a... Read more
Blood Bank Center Financial Model Excel Template
The Blood Bank Financial Model helps users turn a blood bank, blood collection facility, or blood ce... Read more

Chinese Medicine Center Financial Model Excel Temp...
The Traditional Chinese Medicine Clinic Financial Model helps entrepreneurs, clinic owners, consulta... Read more

 eFinancialModels
Pharma Biotech Valuation Model Template (Risk-Adju...
The Pharma Biotech Valuation Model Template calculates the risk-adjusted DCF Value of a Pharma or Bi... Read more

Pharma Biotech Financial Model incl. Risk-Adjusted...
Financial Model analyzing a Biopharmaceutical Company using a Risk-Adjusted NPV Valuation Methodolog... Read more

 City Finance
Medical Spa (MediSpa) Financial Model 5 Year 3 Sta...
Comprehensive, editable, MS Excel spreadsheet for tracking Medical Spa company finances, including y... Read more
Medical Practice Financial Model Excel Template
The Medical Practice Financial Model helps users turn a clinic concept, expansion plan, or healthcar... Read more
You must log in to submit a review.