
0 ITEMS

Wine Bar Financial Model Excel Template
The Wine Bar Financial Model helps entrepreneurs, founders, consultants, analysts, and hospitality business owners turn a wine bar concept into a structured financial forecast. Instead of building a spreadsheet from scratch, users can work from a ready-to-use model designed around the key drivers of a wine bar, including customer volume, average check size, revenue mix, cost of goods sold, payroll, operating expenses, startup costs, cash flow, and profitability. The template gives users a practical way to test assumptions, understand funding needs, and prepare financial projections for a business plan, investor discussion, bank application, or internal decision-making process. Built for both startup planning and expansion analysis, the template connects commercial assumptions with financial outputs over a five-year forecast period. Users can input their own pricing, traffic expectations, weekday and weekend patterns, beverage and food sales mix, staffing plan, rent, utilities, marketing costs, supplier costs, and capital investment requirements. The model then helps translate those assumptions into projected revenue, profit and loss, cash flow, balance sheet, return metrics, and visual reports. This makes it easier to understand whether the wine bar can cover fixed and variable costs, how quickly it may reach break-even, and what level of sales performance may be required to support sustainable profitability. The Wine Bar Financial Model is useful for anyone preparing a wine bar business plan, pitching to investors, applying for financing, evaluating a lease, planning a launch budget, or comparing different operating strategies. It supports decision-making by showing how changes in covers, average spend, cost percentages, staffing levels, and growth assumptions affect cash flow and profit. Users can evaluate conservative, base, and optimistic cases, review investor-friendly outputs, and use charts and dashboards to communicate the financial story more clearly to lenders, partners, advisors, or internal teams. Because the model is fully editable and compatible with Microsoft Excel and Google Sheets, it can be adapted to different locations, formats, menus, and operating styles. Whether the business is a neighborhood wine bar, a premium tasting lounge, a small plates and wine concept, or a hospitality venue with events and beverage-focused revenue, the template provides a structured framework for financial planning. It helps users organize assumptions, forecast results, identify risk points, monitor break-even potential, and make more informed decisions before committing capital.
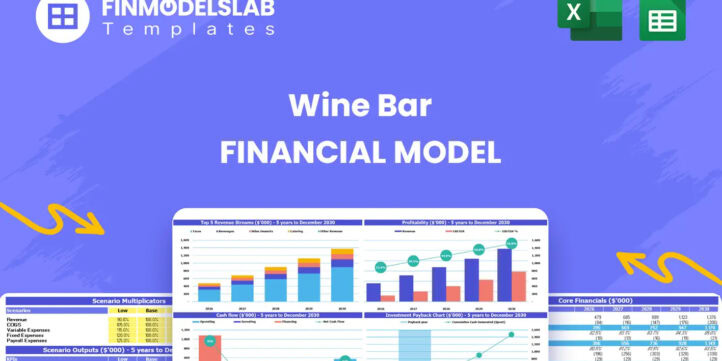


Financial Model Overview
The Wine Bar Financial Model is a ready-to-use financial model template designed to help entrepreneurs, hospitality operators, consultants, analysts, and business planners evaluate the financial potential of a wine bar before launch, expansion, or funding preparation. It brings together the core assumptions behind a wine bar business, including covers, average check size, wine and food revenue streams, cost of goods sold, payroll, operating expenses, startup investment, cash flow, profitability, and investor returns. By organizing these assumptions into a structured five-year forecast, the model helps users move beyond rough estimates and build a more credible financial plan that can support business plans, funding discussions, lender reviews, partner conversations, and internal decision-making. The template is fully editable, so users can replace the pre-populated assumptions with their own local pricing, lease terms, staffing structure, menu strategy, supplier costs, marketing plan, and growth expectations. It is built to make financial planning more practical for non-financial users while still providing the financial outputs that investors, banks, and stakeholders expect to see.
All-in-One Dashboard
The all-in-one dashboard gives users a central view of the most important inputs and outputs in the Wine Bar Financial Model. This component is designed to reduce the need to search through multiple worksheets by summarizing core assumptions and results in one easy-to-review area. Users can see how key planning inputs, such as customer traffic, average spend, revenue assumptions, cost structure, and investment requirements, connect to outputs such as revenue, EBITDA, cash balance, break-even timing, payback period, and return metrics. For a wine bar, this is especially useful because the business depends on several moving parts, including weekday traffic, weekend demand, beverage mix, food pairing sales, and operating cost control. The dashboard helps founders and managers quickly understand whether the current assumptions are producing a viable financial outlook and whether the business can generate enough sales to support rent, payroll, inventory, marketing, and debt or investor expectations. It is also helpful for presentations because it provides a concise financial snapshot that can be shared with partners, lenders, or investors without overwhelming them with detailed spreadsheet tabs. By combining essential inputs and headline results, this component supports faster review, clearer communication, and better financial decision-making.
Low Base High Scenario Analysis
The low, base, and high scenario analysis component helps users compare how the wine bar may perform under different business conditions. Instead of relying on a single forecast, users can create a conservative case, a realistic base case, and an optimistic upside case by adjusting key assumptions such as daily covers, average check size, sales growth, cost of goods sold, labor efficiency, marketing spend, and occupancy costs. This is important for a wine bar because performance can vary depending on location, seasonality, local competition, customer adoption, event bookings, tourism patterns, and the effectiveness of promotional activity. A low case may show what happens if customer traffic ramps up more slowly than expected or if costs are higher than planned. A base case can represent the operating plan used for budgeting and funding discussions. A high case can show the upside from stronger weekend traffic, higher premium wine sales, private tastings, corporate events, or successful membership and loyalty initiatives. The component helps users see the direct impact of assumption changes on revenue, profit margins, cash flow, and funding requirements. This makes it valuable for risk planning, investor conversations, loan applications, and management decisions because it demonstrates that the user has considered uncertainty and can respond to both challenges and growth opportunities.
Professional Charts
The professional charts component converts the financial forecast into presentation-ready visuals that make the model easier to understand and communicate. Rather than asking stakeholders to interpret rows of numbers, the charts can show revenue trends, expense behavior, cash flow movement, profitability progression, margin development, and other key financial patterns over time. For a wine bar business plan, charts are especially useful because investors and lenders often want to see whether revenue is growing consistently, whether margins improve as the business scales, and whether cash balances remain strong enough to cover operating needs. Visual reporting can also help founders spot issues quickly, such as rising payroll costs, weak profitability, seasonal cash pressure, or a slower path to break-even. The chart outputs can be used in pitch decks, loan packages, board updates, internal management meetings, and strategic planning sessions. Because the Wine Bar Financial Model is editable, the charts update as assumptions change, allowing users to immediately see the effect of revised pricing, traffic, staffing, cost, or growth expectations. This component is useful not only for presentation but also for analysis, because it turns financial projections into a clearer story about how the wine bar is expected to develop from launch through maturity.
ROE Components and DuPont Analysis
The ROE components and DuPont analysis section helps users understand the drivers behind return on equity rather than simply looking at a single return figure. This component breaks down return performance into underlying factors, such as profitability, asset efficiency, and leverage, giving users a more detailed view of how the wine bar generates value for owners or investors. In a hospitality business, return on equity can be affected by margins, capital investment, equipment needs, leasehold improvements, working capital, financing structure, and operating efficiency. By using a DuPont-style approach, the model helps users identify whether returns are being driven by strong profit margins, effective use of assets, or the level of debt and equity financing used to fund the business. This can be especially valuable when reviewing the initial capital required for renovations, kitchen equipment, bar setup, furniture, technology, signage, inventory, and working capital. Investors can use the analysis to assess whether the business offers an acceptable return profile relative to its risk, while owners can use it to evaluate how operational improvements may increase value. For example, improving margins through better supplier terms, increasing table turnover, raising average check size, or optimizing labor scheduling may all influence return performance. This component supports more informed investment analysis and helps users explain the financial logic behind the wine bar opportunity.
Revenue Inputs
The revenue inputs component is where users define the commercial assumptions that drive the top line of the Wine Bar Financial Model. For a wine bar, revenue is typically influenced by customer volume, average check size, daily operating schedule, weekday and weekend traffic patterns, menu mix, beverage sales, food pairings, events, private tastings, and seasonal demand. This section allows users to enter or adjust assumptions for covers, pricing, growth rates, and sales categories so that projected revenue reflects the planned operating concept. A casual neighborhood wine bar may use different assumptions than a premium tasting lounge, a small plates concept, or a venue focused on events and curated wine experiences. The value of this component is that it connects real operating decisions to financial outcomes. Users can test how increasing weekend check sizes, adding higher-margin tasting flights, offering lunch service, extending evening hours, or hosting private events may affect revenue. They can also evaluate whether projected customer traffic is realistic for the location, seating capacity, marketing plan, and local market. Because revenue assumptions flow through to profitability, cash flow, break-even timing, and investor returns, this section is one of the most important parts of the model. It helps users build a more defensible forecast and avoid relying on unsupported sales estimates.
Bank-Ready Reports
The bank-ready reports component provides structured financial outputs that can be used for lender reviews, investor conversations, business plan appendices, and stakeholder presentations. This section typically includes the key financial statements and summaries that external reviewers expect, such as profit and loss projections, cash flow forecasts, balance sheet outputs, and supporting financial metrics. For a wine bar seeking financing, these reports are essential because lenders want to understand how the business will generate revenue, control expenses, service debt, maintain liquidity, and reach profitability. Investors and partners also need a clear view of projected performance, capital requirements, and financial risks. The reports are designed to present information in a professional format, helping users communicate assumptions and results with greater confidence. They can support applications for startup loans, working capital lines, equipment financing, lease negotiations, or equity investment. Since the reports are generated from the underlying assumptions in the model, updates to inputs such as rent, payroll, startup costs, average check size, wine inventory costs, or loan terms can flow into the financial statements. This makes the component valuable for preparing multiple versions of a plan, responding to lender questions, and keeping financial documents consistent throughout the funding process.
Revenue Breakdown
The revenue breakdown component provides a more detailed view of how total sales are generated across the wine bar’s different revenue streams. Rather than treating revenue as one simple number, this section helps users separate and analyze categories such as beverage sales, wine by the glass, bottles, tasting flights, food pairings, lunch, dinner, private events, tastings, and other possible income sources. This is important because each revenue stream may have different margins, seasonality, customer behavior, and growth potential. Beverage sales may have a different cost profile than food sales, while events or tastings may generate higher average spend but require additional staffing or promotional effort. By reviewing revenue at a category level, users can better understand which parts of the business contribute most to sales and profitability. The component helps users evaluate menu strategy, pricing decisions, product mix, and promotional priorities. For example, if premium wine flights generate strong margins, the business may decide to emphasize curated tastings. If food pairings support higher check sizes, the operator may expand small plate offerings. If private events add meaningful revenue during slower periods, the wine bar may invest in event marketing. This section supports better forecasting and more strategic decision-making by showing not only how much revenue is expected, but where that revenue is expected to come from.
KPI Dashboard
The KPI dashboard focuses on the performance metrics that help users monitor the operational and financial health of the wine bar. While the all-in-one dashboard provides a broad overview, the KPI dashboard is more focused on measurable indicators that can be tracked against goals, benchmarks, and operating performance. Relevant KPIs may include average check size, daily covers, revenue per customer, gross margin, cost of goods sold percentage, payroll as a percentage of revenue, EBITDA margin, cash balance, break-even status, payback period, and return metrics. For a wine bar, these KPIs are useful because small changes in traffic, pricing, inventory cost, or labor scheduling can have a significant impact on profitability. The dashboard can help users compare projected performance against industry benchmarks or internal targets, making it easier to identify areas that need attention. If payroll is too high relative to revenue, the operator can review staffing levels and shift scheduling. If beverage margins are below expectations, the user can revisit supplier pricing, pour costs, menu pricing, or product mix. If average check size is below target, management can test upselling strategies, premium offerings, food pairings, or event packages. This component supports ongoing performance management, investor reporting, and operational decision-making by turning the financial forecast into a set of actionable business metrics.
Startup Costs and Funding Requirements
The startup costs and funding requirements component helps users estimate how much capital is needed before the wine bar can open and operate with adequate working capital. This section may include lease deposits, renovations, build-out, bar installation, kitchen equipment, refrigeration, furniture, glassware, point-of-sale systems, licenses and permits, initial inventory, branding, signage, pre-opening payroll, launch marketing, professional fees, insurance, contingency reserves, and opening cash balance. For a wine bar, startup investment can be substantial because the customer experience depends heavily on the space, ambiance, equipment, service readiness, and initial wine inventory. This component separates one-time launch costs from ongoing operating expenses so users can clearly understand what must be funded upfront versus what will be paid during normal operations. It is useful for entrepreneurs preparing funding requests because it shows lenders and investors how capital will be used. It also helps owners avoid underestimating the cost of opening, which is a common risk in hospitality planning. By linking startup costs to cash flow and financing assumptions, the model can help determine whether the business needs owner equity, investor capital, a bank loan, equipment financing, or a working capital reserve. This component supports budgeting, funding strategy, and launch planning by giving users a clearer view of the total investment required.
Break-Even and Payback Analysis
The break-even and payback analysis component helps users understand when the wine bar may become financially self-sustaining and how long it may take to recover the initial investment. Break-even analysis compares projected revenue against fixed and variable costs to estimate the point at which the business can cover its monthly operating expenses. This is especially important for a wine bar because early-stage performance may depend on building awareness, developing repeat customers, refining the menu, and optimizing staffing levels.
Similar ProductsOther customers were also interested in...


 HenrySheykin
Cigar Lounge Financial Model Excel Template
The Cigar Lounge Financial Model helps entrepreneurs, business owners, consultants, analysts, and fo... Read more
Juice Bar Financial Model Excel Template
The Juice Bar Financial Model helps entrepreneurs, founders, consultants, analysts, and business own... Read more

Tapas Bar Financial Model Excel Template
The Tapas Bar Financial Model helps entrepreneurs, restaurant founders, business owners, consultants... Read more

Snack Bar Financial Model Excel Template
The Snack Bar Financial Model helps entrepreneurs and planners turn a food service concept into a st... Read more

Beer Bar Financial Model Excel Template
The Craft Beer Bar Financial Model helps entrepreneurs, founders, bar owners, consultants, and analy... Read more

Sports Bar Financial Model Excel Template
The Sports Bar Financial Model Financial Model Template helps entrepreneurs, founders, business owne... Read more

Sandwich Bar Financial Model Excel Template
The Sandwich Shop Financial Model is a ready-to-use financial model template designed to help entrep... Read more
Karaoke Bar Business Plan Financial Model Excel Te...
The Karaoke Bar Financial Model helps entrepreneurs, business owners, consultants, founders, and ana... Read more
All Day Bar & Restaurant Financial Model Excel...
The All-Day Restaurant Financial Model helps users turn a food and beverage concept into a structure... Read more
 Giorgos
All-day Restaurant and Bar – 5 Year Financial Mo...
Financial Model providing advanced financial planning & analysis for an All-day Restaurant &... Read more
You must log in to submit a review.