
0 ITEMS

Sports Bar Financial Model Excel Template
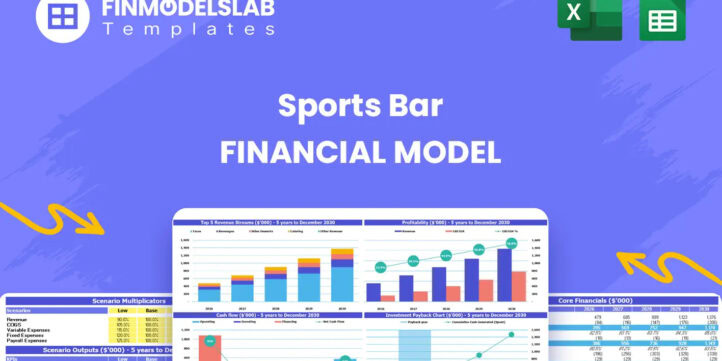
The Sports Bar Financial Model Financial Model Template helps entrepreneurs, founders, business owners, consultants, and analysts build a structured financial plan for launching or expanding a sports bar. Instead of starting from a blank spreadsheet, users can work from a ready-made model designed around hospitality and bar operations, including customer traffic, average check size, food and beverage sales, payroll, operating expenses, startup costs, cash flow, and profitability. It gives users a practical way to translate a sports bar concept into a financial forecast that can support business planning, funding discussions, and day-to-day decision-making. This template is especially useful for anyone preparing a sports bar business plan, investor presentation, loan application, or internal budget. The model helps users document revenue assumptions, estimate midweek and weekend customer demand, plan menu and beverage sales, evaluate staffing needs, and understand how fixed and variable costs affect margins. It also supports more disciplined financial planning by connecting assumptions to projected financial statements, so users can see how changes in pricing, customer volume, cost of goods sold, or payroll influence cash flow and net profitability. The Sports Bar Financial Model is built to help users evaluate whether the business can become financially sustainable before major capital is committed. It includes forecasting tools for startup costs, operating expenses, payroll, revenue streams, cash flow, profitability, break-even analysis, and investment returns. Users can test different assumptions, compare scenarios, review key performance indicators, and identify the sales levels needed to cover costs. This makes the template valuable not only for launch planning, but also for managing an existing sports bar, reviewing expansion opportunities, or assessing performance against financial targets. Because the template is editable and compatible with Excel and Google Sheets, users can customize it for their own location, menu mix, seating capacity, event strategy, supplier costs, labor structure, and funding plan. The professional layout and investor-ready outputs help present the numbers clearly to lenders, partners, advisors, and stakeholders. By organizing the most important financial drivers in one model, it saves time, improves financial clarity, and supports better decision-making throughout the planning process.


Financial Model Overview
The Sports Bar Financial Model Financial Model Template gives entrepreneurs, operators, consultants, and analysts a structured way to evaluate the financial potential of a sports bar before launch, expansion, or funding preparation. A sports bar has several moving parts that need to be modeled carefully, including daily customer traffic, weekday and weekend demand patterns, food and beverage revenue, menu mix, staffing, rent, utilities, supplier costs, startup investment, working capital, and ongoing cash flow. This template brings those assumptions together in a ready-to-use financial model so users can forecast revenue, expenses, profitability, cash flow, investment returns, and funding needs without building a spreadsheet from scratch. It is designed to support practical business planning, lender discussions, investor presentations, internal budgeting, and strategic decision-making for a sports bar concept or an existing hospitality operation.
All-in-One Dashboard
The all-in-one dashboard gives users a central view of the most important inputs and outputs in the Sports Bar Financial Model. It is designed to help users enter or review core assumptions such as customer volume, average check size, revenue mix, cost structure, staffing levels, startup costs, and financing assumptions, then quickly understand how those inputs affect revenue, profit, cash flow, and return metrics. This component is useful because a sports bar owner or advisor often needs a fast summary of business performance without searching through multiple sheets. The dashboard helps connect operational assumptions with financial outcomes, making it easier to review whether the business can support its rent, payroll, inventory purchases, debt service, and desired profit margin. For planning and stakeholder communication, it provides a practical starting point for reviewing the overall forecast and identifying which assumptions have the greatest impact on the model.
Low, Base, and High Scenario Analysis
The low, base, and high scenario analysis component allows users to compare different versions of the sports bar forecast under changing business conditions. A single forecast can create a false sense of certainty, especially in hospitality, where sales can vary based on location, competition, seasonality, local events, marketing effectiveness, staffing execution, and consumer spending. This section lets users test conservative, expected, and optimistic assumptions for drivers such as daily covers, average check size, event attendance, food and beverage sales mix, operating costs, gross margin, and growth rates. The model then shows how each scenario affects revenue, EBITDA, cash flow, profitability, and funding needs. This is useful for entrepreneurs preparing a business plan because it shows the range of possible outcomes instead of relying on one fixed projection. It also helps lenders and investors understand downside risk, base case viability, and upside potential, while giving management a clearer view of what must happen operationally to reach target performance.
Professional Charts
The professional charts component turns the financial forecast into clear visual outputs that can be used for presentations, business plans, partner meetings, and investor discussions. Instead of relying only on spreadsheet rows and formulas, this section presents key financial trends in a more accessible format, such as revenue growth, cost movement, profit margins, cash flow trends, customer volume, and operating performance over time. The charts may use inputs from the revenue forecast, expense assumptions, startup budget, financing structure, and projected financial statements to create presentation-ready visuals. This is useful because sports bar stakeholders often need to understand the story behind the numbers quickly, especially when reviewing a new venue concept or funding proposal. Professional charts help users communicate whether the business is scaling, when margins improve, how cash develops over time, and whether the model supports a credible growth plan. They also make it easier to spot unusual trends, review assumptions, and explain financial results to non-financial audiences.
ROE Components and DuPont Analysis
The ROE components and DuPont analysis section helps users understand what is driving return on equity in the Sports Bar Financial Model. Return on equity is an important investor metric because it shows how efficiently the business may generate returns from the owner or investor capital committed to the project. DuPont analysis breaks ROE into underlying drivers, such as profitability, asset efficiency, and financial leverage, allowing users to see whether projected returns are coming from strong operating margins, efficient use of assets, or the financing structure. Inputs may include projected net income, total assets, equity investment, debt assumptions, and operating performance metrics. The output helps users evaluate whether the sports bar is producing healthy returns for the level of capital required to open and operate the venue. This component is especially useful when discussing the opportunity with investors, partners, or lenders because it goes beyond simple profit figures and shows how the business model converts investment into financial performance.
Revenue Inputs
The revenue inputs component is one of the most important areas of the Sports Bar Financial Model because it defines the commercial assumptions that drive the forecast. For a sports bar, revenue is typically influenced by daily customer counts, midweek versus weekend traffic, average spend per customer, menu pricing, beverage sales, food sales, brunch or breakfast demand, private events, watch parties, promotions, and seasonal demand patterns. This section allows users to adjust those assumptions based on their local market, concept, seating capacity, opening hours, target audience, and expected sales mix. The model can then calculate projected sales over time and connect those sales to gross margin, payroll planning, operating expenses, and cash flow. This component is useful because revenue assumptions are often the most scrutinized part of a business plan. By making the drivers visible and editable, the template helps users build a more defensible forecast and test whether the expected traffic and average check can support the overall cost structure of the sports bar.
Bank-Ready Reports
The bank-ready reports component organizes the financial outputs in a format that can support lender review, loan applications, investor due diligence, and professional business planning. Sports bars often require upfront capital for leasehold improvements, kitchen equipment, bar equipment, furniture, decor, point-of-sale systems, opening inventory, licenses, deposits, and working capital, so lenders typically want to see clear projections before approving financing. This section may include projected profit and loss statements, cash flow statements, balance sheet summaries, debt repayment schedules, profitability measures, and funding requirement summaries. The purpose is to present the financial model in a lender-friendly way, showing how revenue converts into operating profit, whether the business can cover fixed costs, and whether future cash flow can support repayment obligations. This component is useful for founders and business owners because it reduces the time required to prepare financial documents and helps present a polished, structured case to banks, financing partners, landlords, and other stakeholders.
Revenue Breakdown
The revenue breakdown component provides a more detailed view of how total sports bar revenue is generated across different streams. A sports bar is rarely dependent on one source of income only, so it is important to separate revenue from categories such as pizzas and mains, beverages, breakfast and brunch, specials, private events, game-day promotions, and other sales opportunities. This section uses assumptions about sales mix, customer volume, average check size, category contribution, and growth rates to show which revenue streams drive the largest share of total sales. The output helps users understand how changes in menu strategy, beverage focus, pricing, or event programming could affect total revenue and gross margin. This is useful for planning because different revenue streams often have different profitability profiles. Beverage sales may carry different margins than food sales, brunch may depend on different staffing patterns than late-night service, and event revenue may create seasonal spikes. A clear revenue breakdown helps users refine the concept, prioritize high-value offerings, and make more informed operating decisions.
KPI Dashboard
The KPI dashboard component gives users a performance-focused view of the metrics that matter most in running and evaluating a sports bar. Key performance indicators may include revenue, EBITDA, gross margin, net profit margin, cash balance, customer counts, average check, cost of goods sold, labor cost percentage, rent as a percentage of revenue, break-even progress, payback period, and return metrics. This section converts the detailed forecast into a concise management view so users can monitor whether the business is operating within target ranges. It may also support comparison against industry benchmarks, helping users assess whether food costs, beverage costs, staffing expenses, and profitability are realistic for the hospitality sector. The KPI dashboard is useful for both planning and ongoing management because it highlights the relationship between operations and financial performance. Owners can use it to identify issues early, consultants can use it to summarize findings for clients, and investors can use it to assess whether the sports bar has a credible path to sustainable profitability.
Startup Cost Breakdown
The startup cost breakdown component helps users estimate the initial capital required to open the sports bar and prepare it for operations. Launching a sports bar can require significant investment before the first customer is served, including kitchen equipment, bar equipment, pizza ovens or cooking systems, refrigeration, furniture, decor, leasehold improvements, licenses and permits, security deposits, point-of-sale systems, audio and visual equipment, initial inventory, branding, pre-opening marketing, professional fees, hiring expenses, and working capital reserves. This section allows users to organize those costs into clear categories and calculate the total funding needed before launch. The outputs help founders understand whether they have enough capital, how much financing may be required, and where the largest cash requirements are concentrated. This is useful for budgeting, fundraising, loan applications, and negotiations with investors or partners. A detailed startup budget also reduces the risk of underestimating launch costs, which is one of the most common financial problems for new hospitality businesses.
Break-Even Analysis
The break-even analysis component helps users identify when the sports bar may begin covering its costs and what level of sales is required to reach profitability. It uses assumptions from the revenue forecast, cost of goods sold, payroll, rent, utilities, marketing, insurance, administrative expenses, and other fixed and variable costs to calculate the point where revenue is sufficient to offset expenses. For a sports bar, break-even analysis is especially useful because traffic can fluctuate by day of week, season, sporting calendar, local events, and promotional activity. This section helps users understand how many customers are needed, what average check size must be achieved, and how cost control affects the timeline to profitability. It also supports decision-making around pricing, staffing, menu engineering, opening hours, marketing spend, and working capital planning. For investors and lenders, break-even analysis provides a clear view of business risk and shows whether the model has a realistic path from launch investment to sustainable operations.
File types:
Excel – Single-User: .xlsx
Excel – Multi-User: .xlsx
Similar ProductsOther customers were also interested in...


 HenrySheykin
Cigar Lounge Financial Model Excel Template
The Cigar Lounge Financial Model helps entrepreneurs, business owners, consultants, analysts, and fo... Read more
Juice Bar Financial Model Excel Template
The Juice Bar Financial Model helps entrepreneurs, founders, consultants, analysts, and business own... Read more

Wine Bar Financial Model Excel Template
The Wine Bar Financial Model helps entrepreneurs, founders, consultants, analysts, and hospitality b... Read more

Tapas Bar Financial Model Excel Template
The Tapas Bar Financial Model helps entrepreneurs, restaurant founders, business owners, consultants... Read more

Snack Bar Financial Model Excel Template
The Snack Bar Financial Model helps entrepreneurs and planners turn a food service concept into a st... Read more

Beer Bar Financial Model Excel Template
The Craft Beer Bar Financial Model helps entrepreneurs, founders, bar owners, consultants, and analy... Read more

Sandwich Bar Financial Model Excel Template
The Sandwich Shop Financial Model is a ready-to-use financial model template designed to help entrep... Read more
Karaoke Bar Business Plan Financial Model Excel Te...
The Karaoke Bar Financial Model helps entrepreneurs, business owners, consultants, founders, and ana... Read more
All Day Bar & Restaurant Financial Model Excel...
The All-Day Restaurant Financial Model helps users turn a food and beverage concept into a structure... Read more

 Giorgos
All-day Restaurant and Bar – 5 Year Financial Mo...
Financial Model providing advanced financial planning & analysis for an All-day Restaurant &... Read more
You must log in to submit a review.