
0 ITEMS

Tapas Bar Financial Model Excel Template
The Tapas Bar Financial Model helps entrepreneurs, restaurant founders, business owners, consultants, and analysts turn a tapas bar concept into a structured five-year financial forecast. Instead of starting from a blank spreadsheet, users can work from a ready-to-use model designed around the operating realities of a small plates restaurant and bar, including customer traffic, average check values, food and beverage sales mix, cost of goods sold, payroll, operating expenses, cash flow, profitability, and funding needs. This financial model template is built for business planning, investor discussions, lender review, internal budgeting, and decision-making before launch or expansion. It helps users estimate revenue assumptions based on covers, weekday and weekend demand, menu categories, beverage sales, desserts, and events catering. It also supports practical planning around startup costs, kitchen and bar equipment, dining room setup, POS systems, staffing, supplier costs, rent, marketing, and other operating expenses that shape the financial performance of a tapas bar. The template connects assumptions with financial outputs so users can evaluate whether the business model is realistic, scalable, and financially sustainable. By adjusting inputs such as traffic, average spend, ingredient costs, staffing levels, and growth rates, users can see how changes affect profit margins, cash flow, break-even timing, and long-term returns. This makes it useful not only for preparing polished funding documents, but also for testing decisions before committing capital. With built-in dashboards, scenarios, charts, financial statements, KPI tracking, and profitability analysis, the Tapas Bar Financial Model gives users a clearer view of the numbers behind the business. It is fully editable and suitable for Excel or Google Sheets, allowing users to customize assumptions for their market, concept, pricing, and operating strategy. Whether you are preparing a business plan, approaching investors, applying for financing, or refining your launch budget, this model provides a practical framework for confident financial planning and better decision-making.
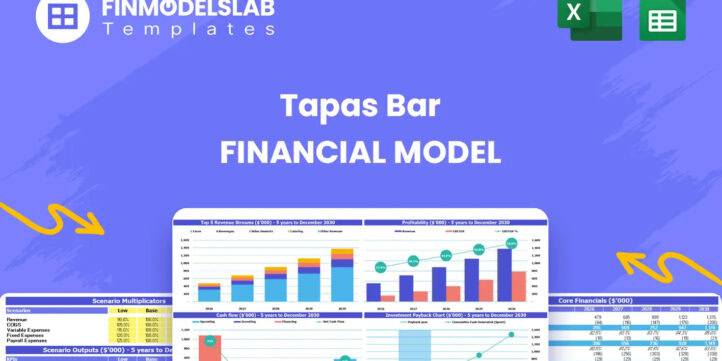


Financial Model Overview
The Tapas Bar Financial Model is a ready-to-use financial model template designed to help founders, restaurant operators, consultants, analysts, and business planners evaluate the financial potential of a tapas bar before launch, expansion, funding, or strategic decision-making. A tapas bar has a distinctive mix of revenue drivers, including customer covers, average check value, food sales, beverage sales, desserts, private events, and catering opportunities, while also carrying hospitality-specific costs such as ingredients, bar inventory, kitchen labor, front-of-house payroll, rent, utilities, equipment, decor, licenses, and working capital. This template brings those assumptions into one structured model so users can forecast revenue, operating expenses, cash flow, profitability, investor returns, and funding needs over a multi-year planning period. It is useful for replacing guesswork with a more organized financial planning process, making it easier to prepare business plans, review scenarios, communicate with stakeholders, and understand whether the tapas bar concept can become financially sustainable.
All-in-One Dashboard
The all-in-one dashboard gives users a central place to review the most important assumptions and outputs of the Tapas Bar Financial Model without having to navigate through every schedule individually. It is designed to summarize key financial drivers such as projected revenue, gross profit, EBITDA, net profit, cash position, investment needs, and return metrics in a format that can be reviewed quickly by founders, partners, investors, or lenders. Users can rely on the dashboard to connect core inputs with core outputs, making it easier to understand how customer traffic, average checks, cost assumptions, staffing, and operating expenses flow through the full financial forecast. This component is especially useful when preparing for meetings because it provides a concise financial story of the business, showing whether the tapas bar has a realistic path from launch investment to stable profitability. It also supports day-to-day decision-making by allowing users to track the impact of revised assumptions and immediately see how the overall business case changes.
Low, Base, and High Scenario Analysis
The Low, Base, and High scenario analysis component helps users stress-test the tapas bar business plan under different operating conditions. Rather than relying on a single forecast, the model allows users to compare conservative, expected, and optimistic outcomes based on changes in customer volume, average check size, revenue growth, food and beverage costs, labor costs, occupancy costs, and other key assumptions. A low scenario can help show what happens if opening traffic is slower than expected, supplier costs rise, or private event revenue is delayed. A base scenario can represent the most realistic operating plan, while a high scenario can show the upside if the concept gains traction quickly, weekend covers increase, or higher-margin beverages perform well. This component is valuable for risk management, funding preparation, and internal planning because it shows how sensitive the business is to changes in market demand and cost structure. It also helps founders prepare contingency plans and communicate to investors that the forecast has been tested beyond a single best-case view.
Professional Charts
The professional charts component turns financial outputs into visual insights that are easier to interpret, present, and discuss. The model may include charts for revenue growth, expense trends, profitability, EBITDA, cash flow, margins, return metrics, or other important financial indicators, allowing users to see the direction of the business over time instead of reviewing only spreadsheet tables. For a tapas bar, charts can help illustrate how weekday and weekend demand builds, how revenue streams evolve across food, beverages, desserts, and events, and how cost management affects profit margins. These visuals are useful for investor presentations, lender conversations, business plan documents, and internal strategy reviews because they make the forecast more accessible to non-financial stakeholders. They also help users identify patterns, such as seasonal pressure on cash flow, margin improvement over time, or the effect of scaling revenue while keeping fixed costs controlled. By presenting the financial story visually, this component supports clearer communication and more confident decision-making.
ROE Components and DuPont Analysis
The ROE components and DuPont analysis section helps users understand the drivers behind return on equity rather than looking at a single return figure in isolation. DuPont analysis breaks return on equity into underlying factors such as profitability, asset efficiency, and leverage, giving investors and business owners a more detailed view of how value is being generated. In the context of a tapas bar, this can help users evaluate whether returns are coming from healthy operating margins, efficient use of assets such as kitchen equipment and bar setup, or the financing structure used to launch and grow the business. Inputs may include net income, revenue, total assets, equity, debt, and other balance sheet metrics generated by the model. The output is useful for investor review because it shows how the business converts sales and invested capital into returns. It also helps management identify whether operational improvements, cost controls, higher table turnover, better revenue mix, or a revised capital structure could improve long-term financial performance.
Revenue Inputs
The revenue inputs component is where users build the commercial foundation of the tapas bar forecast. This section is designed around the practical revenue drivers of the business, such as daily covers, weekday traffic, weekend traffic, average check values, sales growth, menu mix, food sales, beverage sales, dessert sales, and events or catering revenue. For a tapas bar, revenue is highly dependent on the number of guests served, how often seats turn during busy periods, the difference between midweek and weekend demand, and the contribution of higher-margin drinks and private events. By entering assumptions in a structured way, users can create a revenue forecast that reflects their concept, location, pricing, customer profile, and operating schedule. This component is useful because it links business strategy directly to financial outcomes. If users are considering a premium wine program, happy hour pricing, expanded weekend service, or private event packages, they can adjust the assumptions and see how the changes affect total revenue, gross margin, cash flow, and profitability over the forecast period.
Bank-Ready Financial Reports
The bank-ready financial reports component provides structured financial outputs that are suitable for lenders, investors, partners, and other stakeholders who need to review the business in a professional format. This can include projected profit and loss statements, cash flow statements, balance sheets, and summary financial schedules that show how the tapas bar is expected to perform over time. Lenders often want to understand whether the business can generate enough cash to cover operating costs, debt service, supplier obligations, payroll, and reinvestment needs, while investors may focus on profitability, growth, margins, payback period, and return metrics. This section helps organize the forecast into a format that supports funding discussions and business plan submissions. It also helps users identify gaps before approaching stakeholders, such as insufficient working capital, weak early cash flow, overly aggressive revenue assumptions, or high fixed costs. By providing a lender-friendly and investor-ready view of the numbers, this component helps users present a more credible financial case.
Revenue Breakdown
The revenue breakdown component gives users a detailed view of how total sales are generated across the tapas bar’s different revenue streams. Instead of treating revenue as one single line, the model separates sales into categories such as food, beverages, desserts, events, and catering, allowing users to understand which areas contribute most to overall performance. This is especially important for a tapas bar because each revenue stream may carry a different margin profile. Food sales may depend on ingredient costs and kitchen productivity, beverage sales may provide attractive gross margins, desserts may increase average check size, and events or catering may create additional revenue outside normal dining hours. Users can adjust the sales mix to reflect their menu strategy and local market, then review how changes affect revenue, cost of goods sold, gross profit, and profitability. This component supports pricing decisions, menu planning, promotional strategy, and investor communication by showing not only how much revenue the business may generate, but where that revenue is expected to come from.
KPI Dashboard
The KPI dashboard component helps users monitor the operational and financial performance indicators that matter most for a tapas bar. These may include revenue growth, gross margin, EBITDA margin, net profit margin, average check, covers, labor cost ratio, food cost ratio, beverage cost ratio, cash balance, payback period, and return metrics. By consolidating key performance indicators in one place, the model helps users compare projected performance against internal goals, industry benchmarks, and investor expectations. For a tapas bar, KPI tracking is useful because small changes in table traffic, menu pricing, staffing efficiency, or ingredient costs can have a significant impact on margins and cash flow. This section can help users quickly identify whether the forecast depends too heavily on aggressive traffic assumptions, whether prime costs are under control, or whether profitability improves as the business scales. It is also useful for ongoing management after launch, giving owners and advisors a framework for reviewing actual performance against the plan and making informed operational adjustments.
Startup Costs and Funding Requirements
The startup costs and funding requirements component helps users estimate the initial capital needed to open the tapas bar and operate through the early months. This section can include kitchen equipment, bar equipment, dining room furniture, decor, leasehold improvements, POS systems, licenses, deposits, initial inventory, pre-opening payroll, launch marketing, professional fees, insurance, contingency reserves, and working capital. For a tapas bar, accurately estimating upfront investment is essential because the business may require significant spending before the first customer is served. This component helps users separate one-time launch expenses from recurring operating costs, making it easier to calculate a realistic funding request for investors, banks, or internal capital planning. It also supports better budgeting by showing where cash will be used and whether the planned funding is enough to cover setup costs and early operating needs. By documenting startup costs clearly, users can avoid undercapitalization, prepare a more defensible business plan, and understand how the initial investment affects payback period and return expectations.
Break-Even Analysis
The break-even analysis component helps users identify when the tapas bar is expected to cover its fixed and variable costs and begin generating profit. It uses assumptions such as revenue, gross margin, cost of goods sold, payroll, rent, utilities, marketing, insurance, administrative expenses, and other operating costs to calculate the sales level or time period needed to reach break-even. This is particularly useful for a tapas bar because early performance can be affected by ramp-up traffic, opening promotions, staffing inefficiencies, supplier terms, and seasonality. By reviewing the break-even point, users can understand how many covers, what average check size, or what revenue level may be required to support the cost structure. This component is valuable for decision-making because it shows whether the business model is realistic under expected conditions and how changes in pricing, menu mix, labor scheduling, or ingredient costs may accelerate or delay profitability. It also provides a clear milestone for investors and lenders who want to see when the business can become financially self-sustaining.
File types:
Excel – Single-User: .xlsx
Excel – Multi-User: .xlsx
Similar ProductsOther customers were also interested in...


 HenrySheykin
Cigar Lounge Financial Model Excel Template
The Cigar Lounge Financial Model helps entrepreneurs, business owners, consultants, analysts, and fo... Read more
Juice Bar Financial Model Excel Template
The Juice Bar Financial Model helps entrepreneurs, founders, consultants, analysts, and business own... Read more

Wine Bar Financial Model Excel Template
The Wine Bar Financial Model helps entrepreneurs, founders, consultants, analysts, and hospitality b... Read more

Snack Bar Financial Model Excel Template
The Snack Bar Financial Model helps entrepreneurs and planners turn a food service concept into a st... Read more

Beer Bar Financial Model Excel Template
The Craft Beer Bar Financial Model helps entrepreneurs, founders, bar owners, consultants, and analy... Read more

Sports Bar Financial Model Excel Template
The Sports Bar Financial Model Financial Model Template helps entrepreneurs, founders, business owne... Read more

Sandwich Bar Financial Model Excel Template
The Sandwich Shop Financial Model is a ready-to-use financial model template designed to help entrep... Read more
Karaoke Bar Business Plan Financial Model Excel Te...
The Karaoke Bar Financial Model helps entrepreneurs, business owners, consultants, founders, and ana... Read more
All Day Bar & Restaurant Financial Model Excel...
The All-Day Restaurant Financial Model helps users turn a food and beverage concept into a structure... Read more
 Giorgos
All-day Restaurant and Bar – 5 Year Financial Mo...
Financial Model providing advanced financial planning & analysis for an All-day Restaurant &... Read more
You must log in to submit a review.