
0 ITEMS

Trucking & Freight Fleet Financial Model – 5-Year Excel Forecast with Dashboards
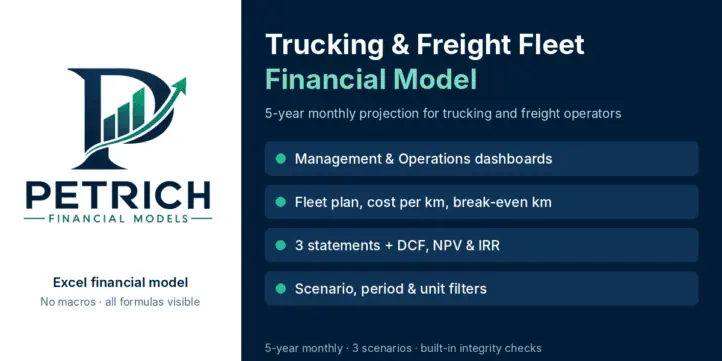
Professional 5-year Excel financial model for trucking and freight transportation businesses, featuring interactive management and operations dashboards. Analyze revenue, operating costs, fleet productivity, profitability, cash flow, financing, and business valuation. Compare financial scenarios and review key performance indicators to support informed planning and investment decisions. Designed for fleet owners, transport operators, financial consultants, and investors. Tested in Microsoft Excel 365 for Windows. No macros required.
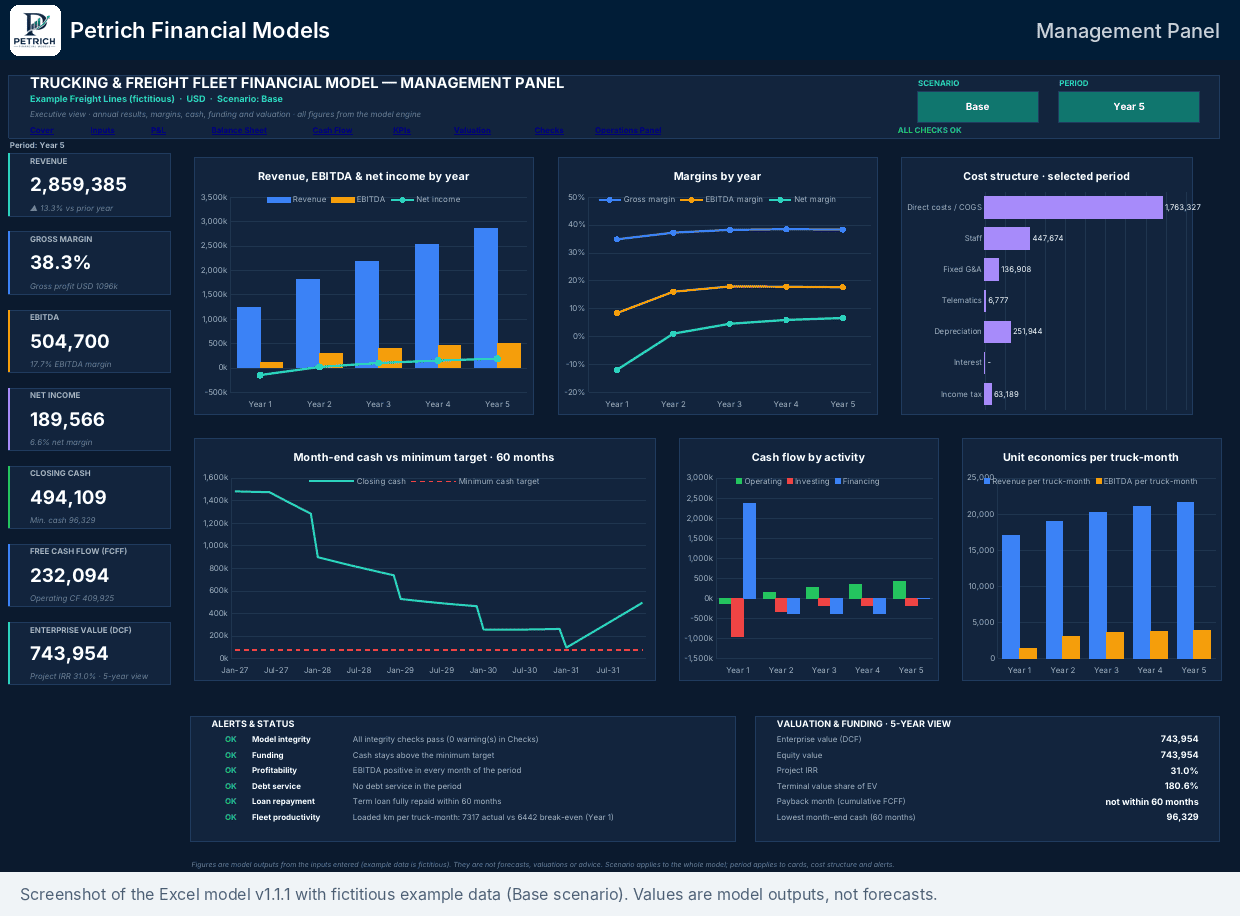
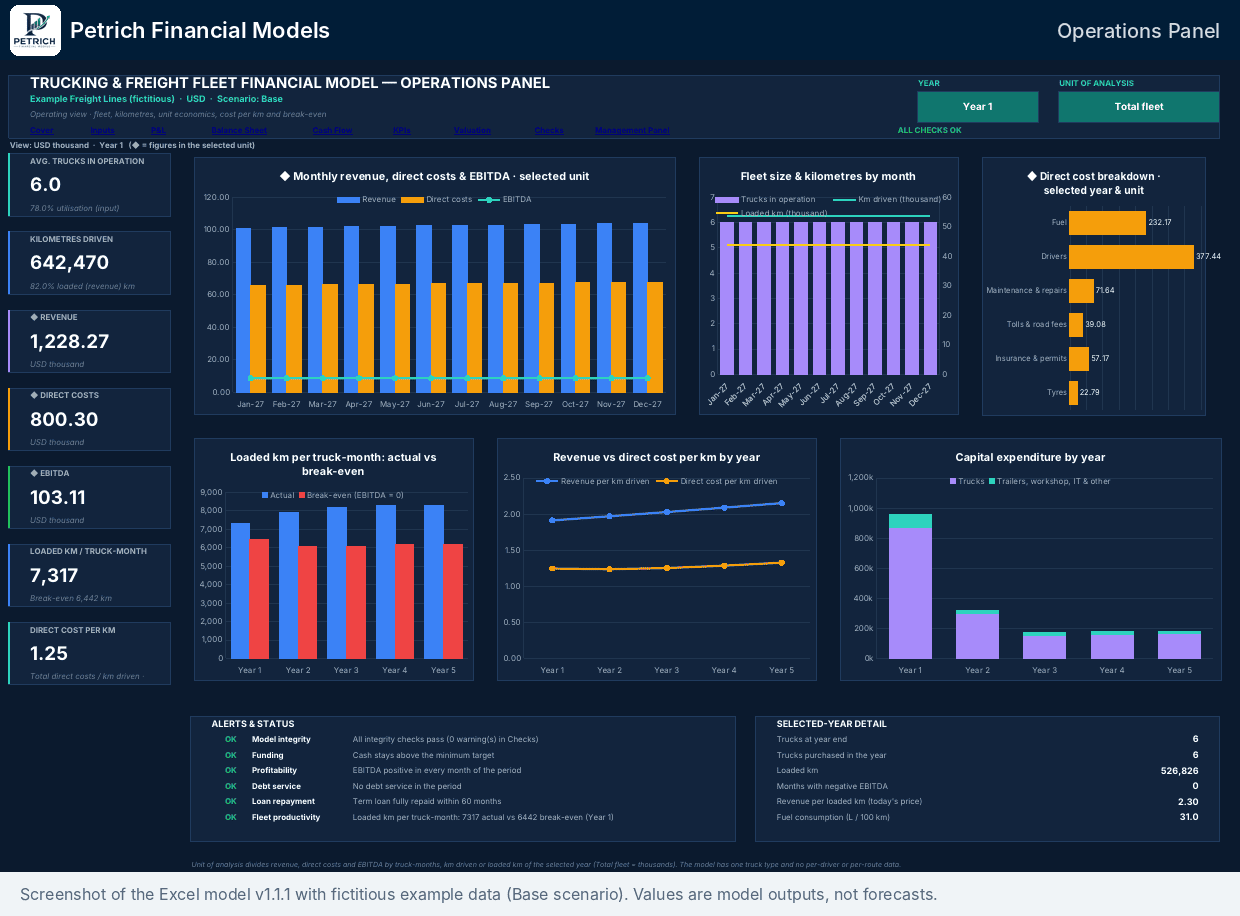
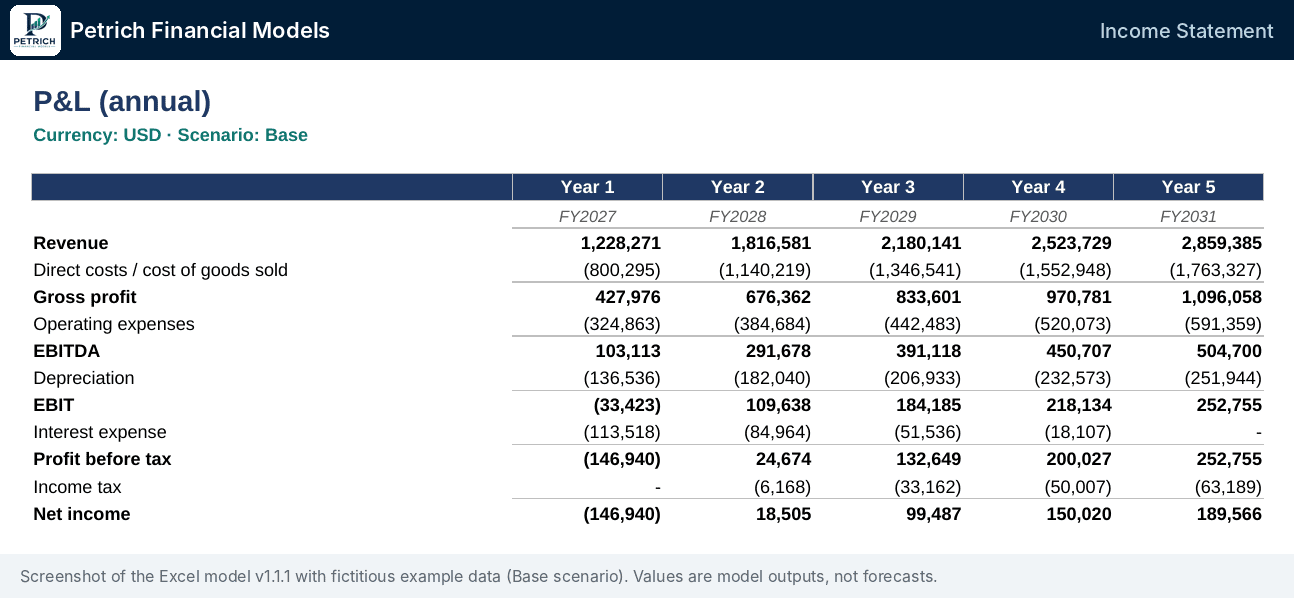
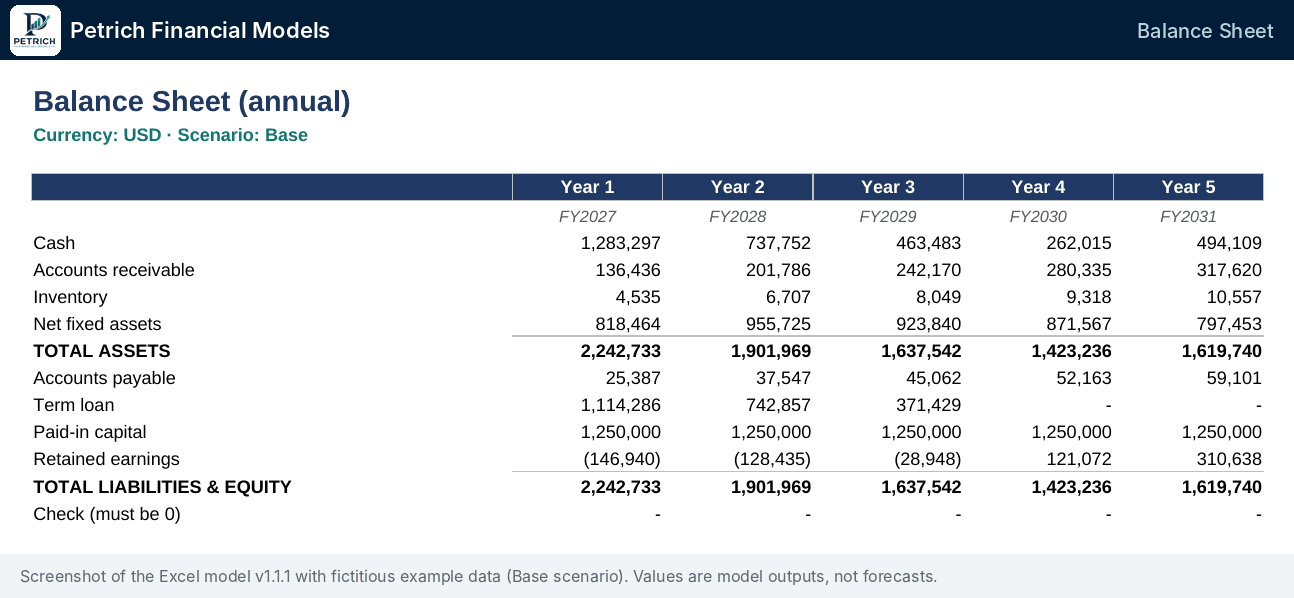
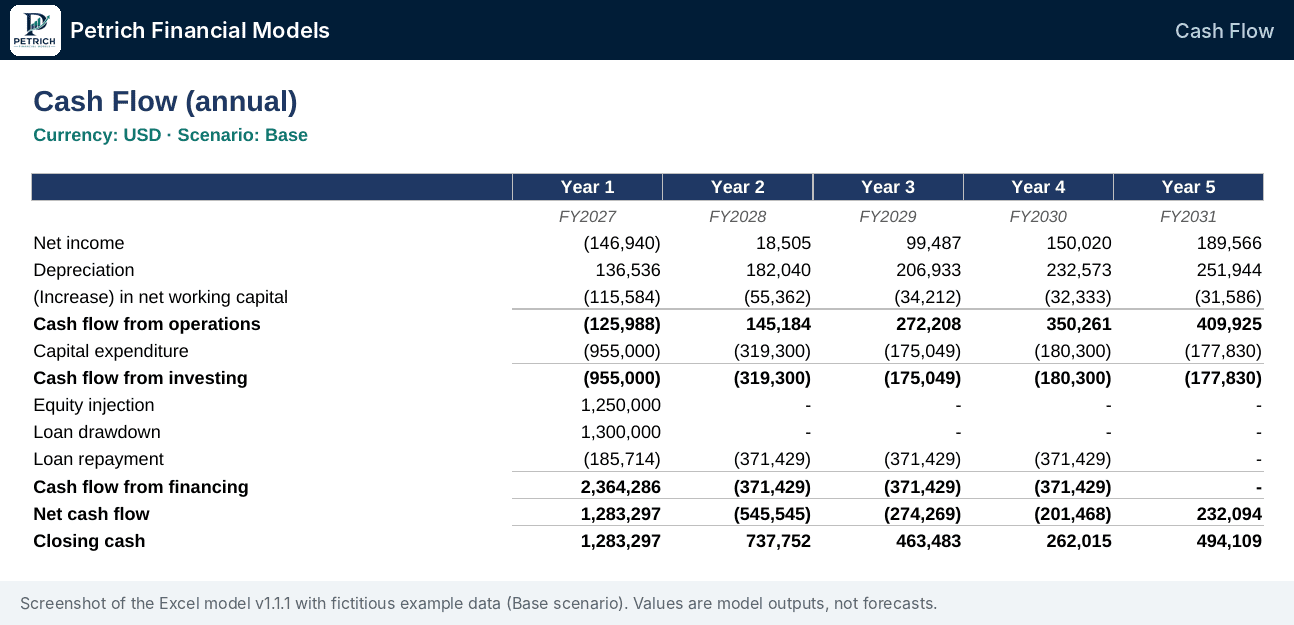
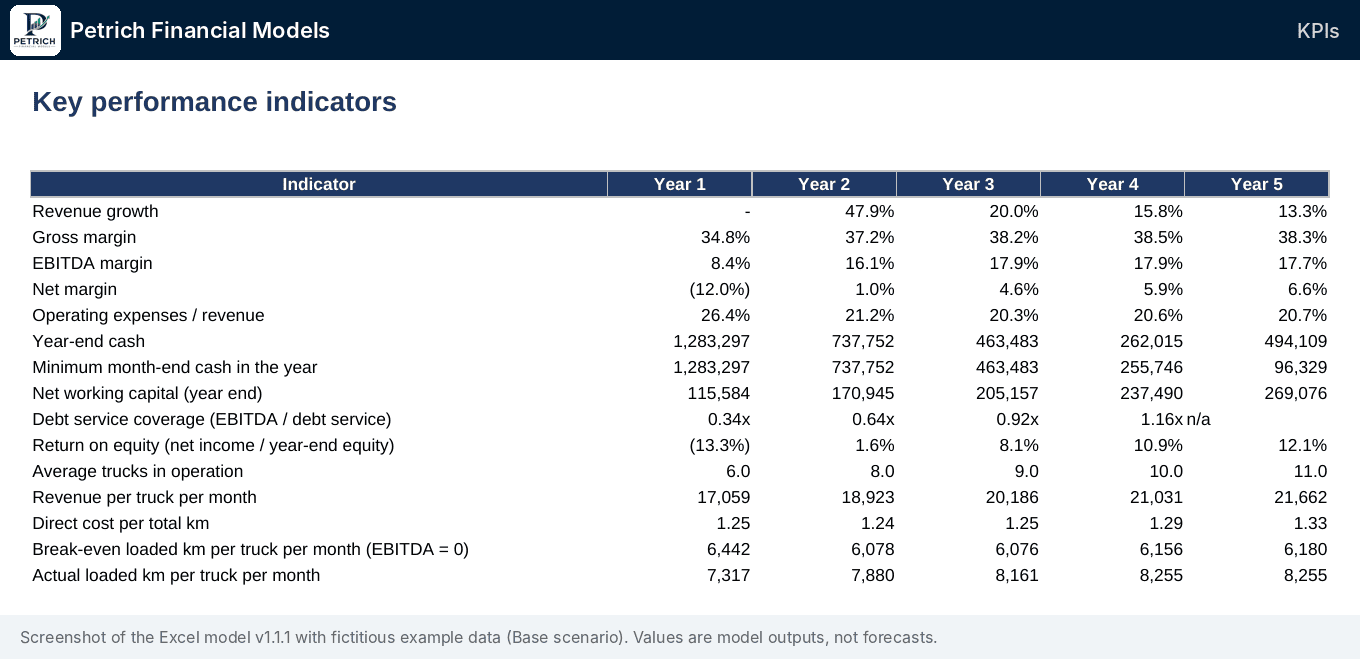
In trucking, the gap between a profitable fleet and a cash-hungry one is a few cents per kilometre. This template makes those cents visible and presents them in two interactive dashboards.
Management Panel and Operations Panel
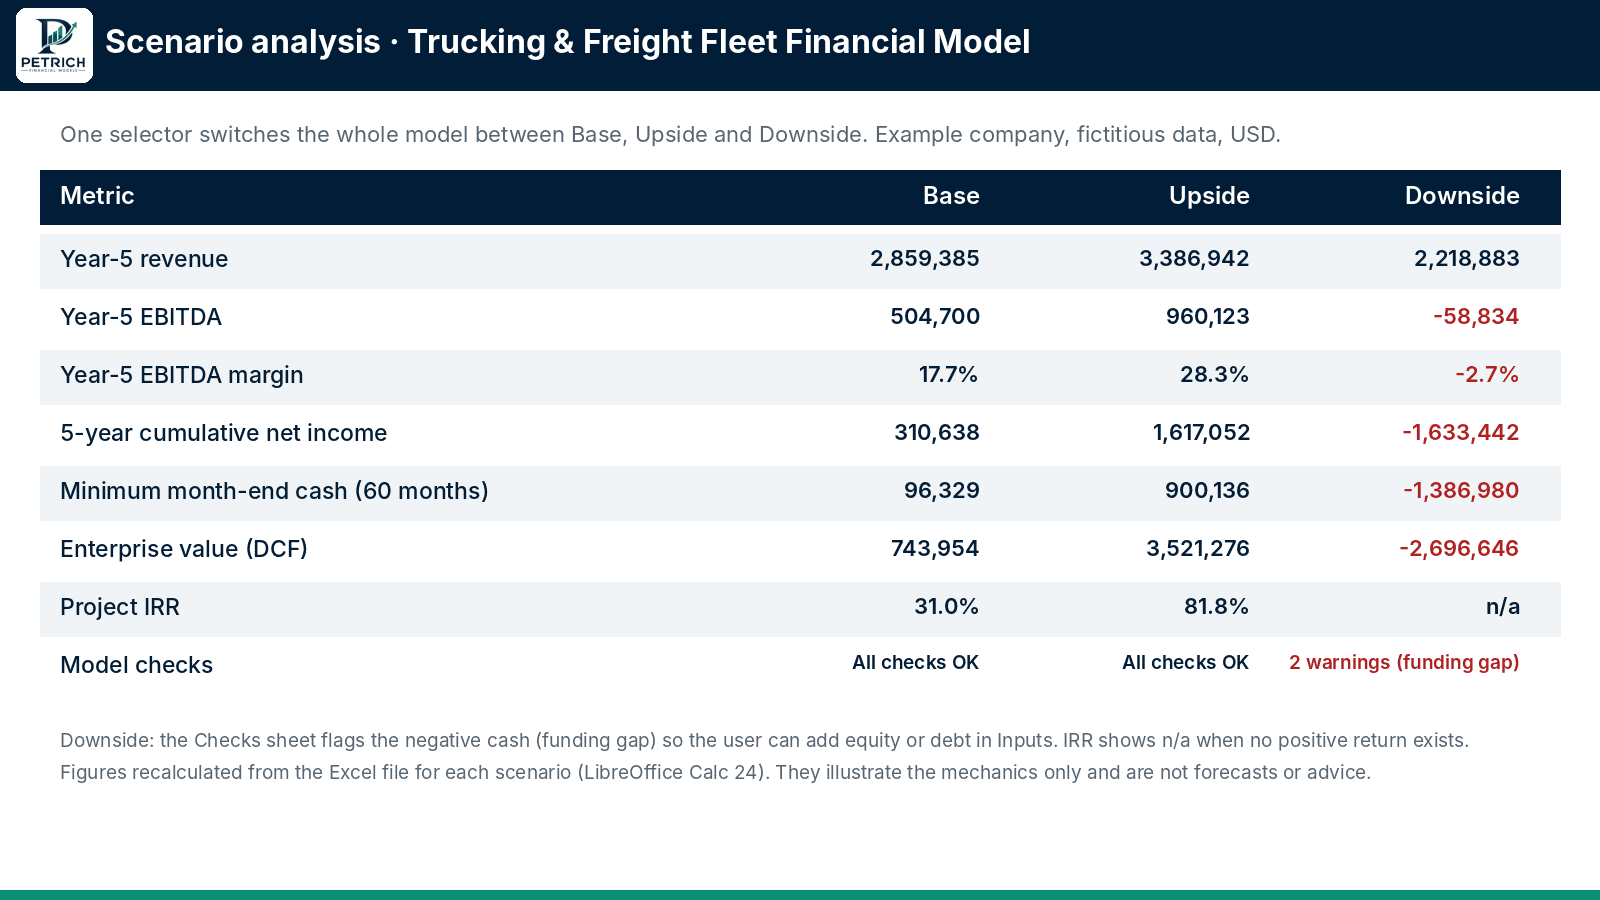
- Management Panel: scenario selector (Base / Upside / Downside) and period filter (Year 1 to Year 5 or 5-year total). KPI cards for revenue and growth, gross margin, EBITDA, net income, closing cash, free cash flow and enterprise value; charts for revenue, EBITDA and net income by year, margins, cost structure, month-end cash against the minimum cash target, cash flow by activity and revenue and EBITDA per truck-month; alerts (integrity, funding, profitability, debt service, loan repayment, fleet productivity) and a valuation and funding summary.
- Operations Panel: year filter and unit-of-analysis filter (total fleet, per truck-month, per km driven, per loaded km). Average trucks and utilisation, km driven and loaded share, revenue, direct costs and EBITDA in the selected unit, loaded km per truck-month against break-even, direct cost per km; monthly fleet and kilometres, direct-cost breakdown, revenue vs cost per km by year and capex by year.
Fleet and operations
- Start with your number of trucks and add trucks at the start of each year; they are bought at the inflated truck price and depreciated.
- Kilometres = working days × km per truck per day × utilisation for each year; a loaded-km share separates paid from empty kilometres.
- Revenue = loaded km × rate per loaded km, inflated over time and adjusted by the scenario.
Costs, working capital and financing
- Per km: fuel (litres per 100 km × fuel price), maintenance and repairs, tyres, tolls and road fees.
- Per truck: drivers (drivers per truck × monthly cost, with salary inflation), insurance, permits and inspections, telematics.
- Overhead staff by role, office and yard rent, other G&A; other capex (trailers, workshop, IT) with their own useful lives.
- Receivables (DSO), fuel and parts inventory (DIO) and payables (DPO) driven by days; equity injection and a term loan with grace period and straight-line repayment (no circular references).
Outputs
- Integrated monthly engine (60 months) with annual P&L, balance sheet that balances in all months, and cash-flow statement.
- KPIs: average trucks, revenue per truck per month, direct cost per km, debt-service coverage, return on equity and break-even loaded km per truck per month compared with actual.
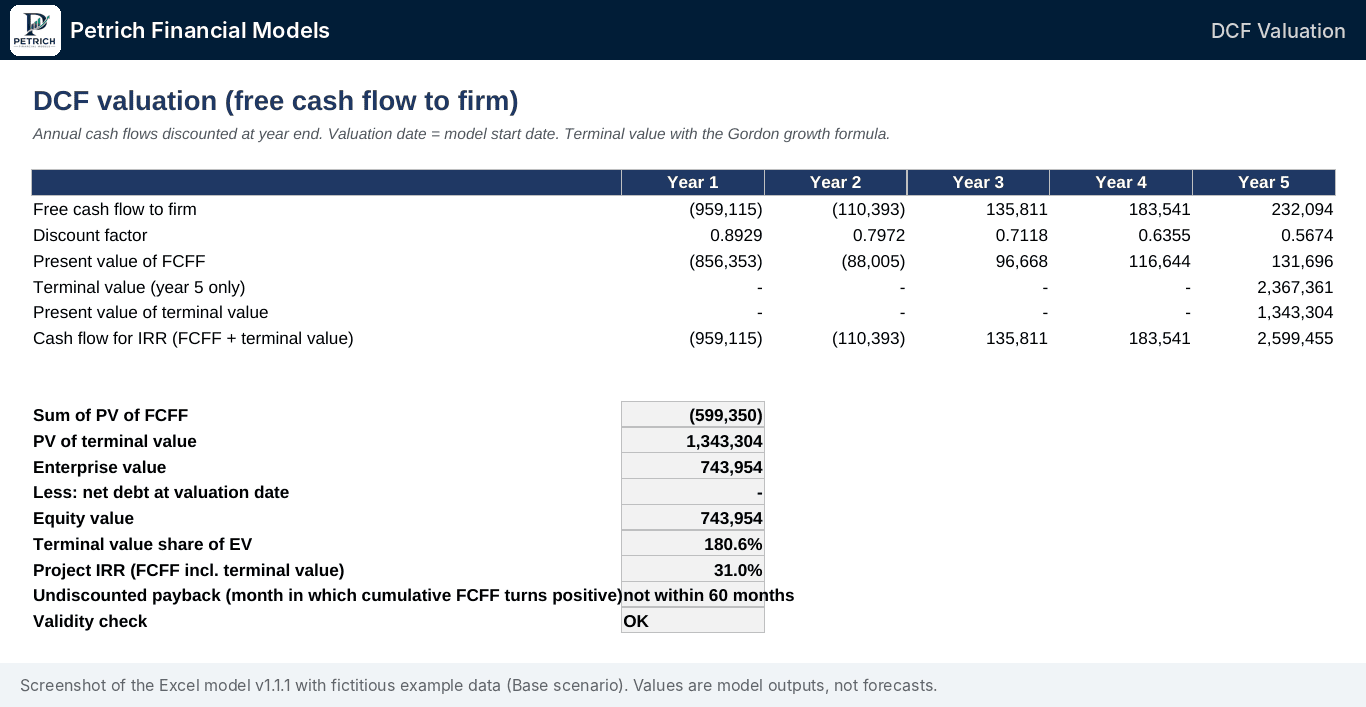
- DCF valuation on free cash flow to firm with terminal value, project IRR and payback month.
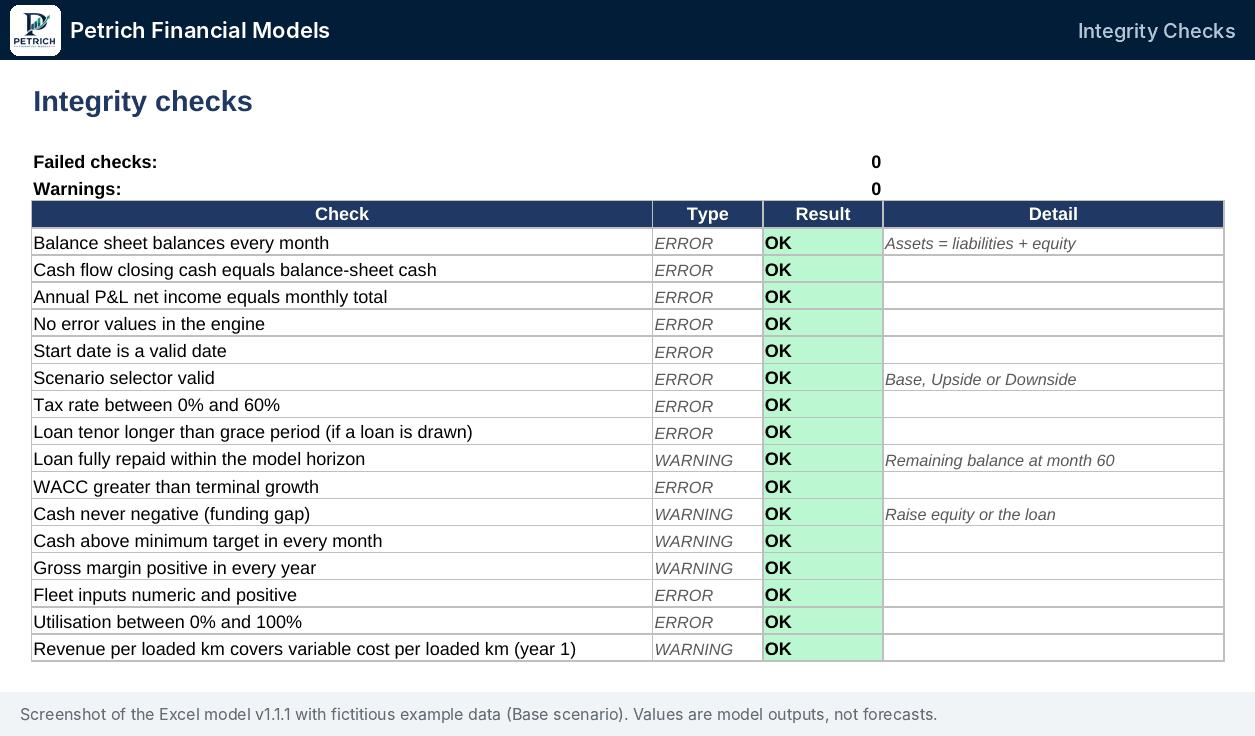
- A Checks sheet with 16 integrity tests; the cover and both dashboards show “ALL CHECKS OK” or what to review.
How to use it
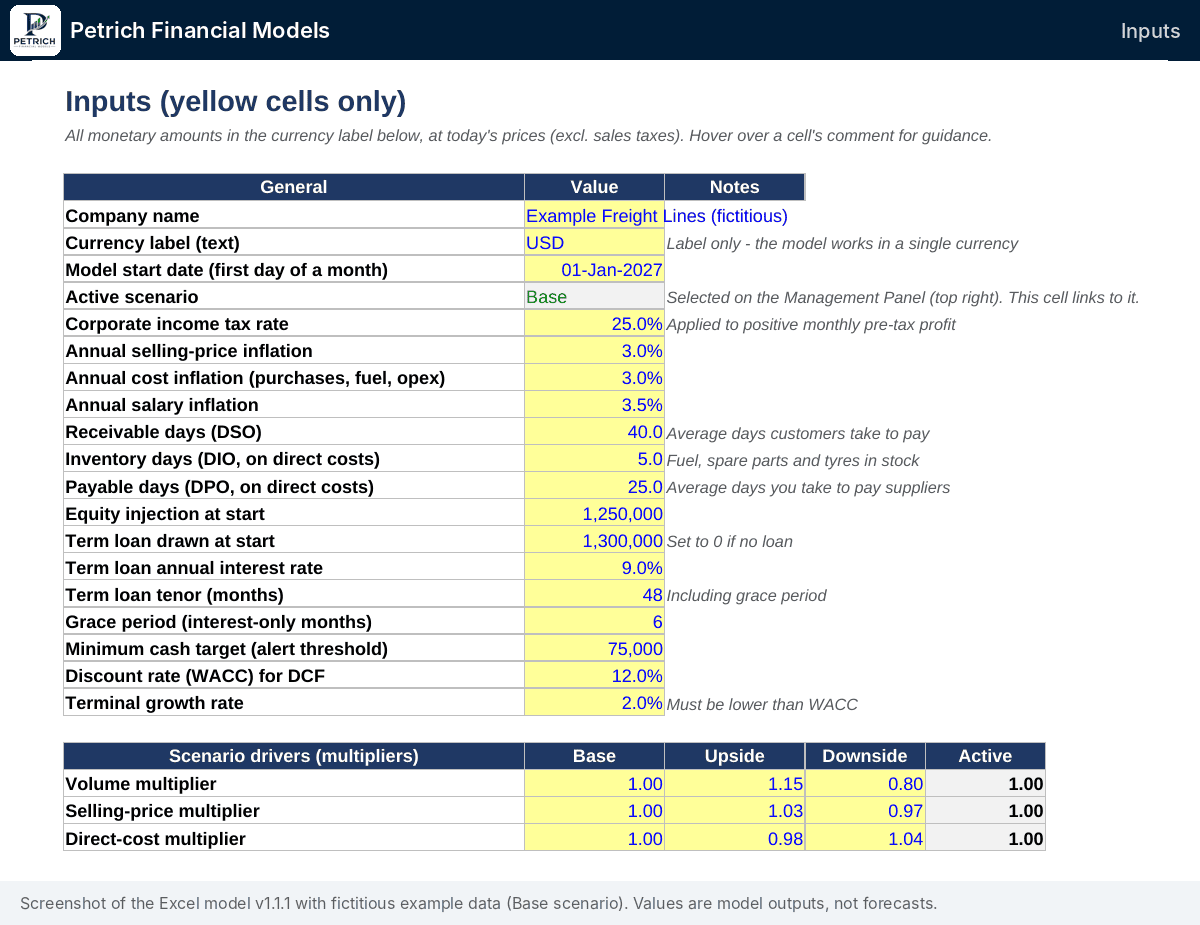
- Enter your assumptions in the yellow cells of the Inputs sheet (every numeric input has data validation).
- Choose the scenario and period on the Management Panel.
- Use the year and unit-of-analysis filters on the Operations Panel, then review the statements, KPIs, valuation and checks.
Limitations (stated honestly)
- One truck type; no per-driver, per-route or per-customer data.
- Distances are labelled in km (miles can be used consistently, but labels say km); one currency; no VAT modelling; no revolving credit line; single term loan.
- Income tax on positive monthly profit, with no loss carry-forward (conservative).
Series note
This model belongs to the Petrich Financial Models C15 industry series. It shares the integrated three-statement architecture and dashboard layout with our Wholesale Distribution model, but its fleet, kilometre, cost-per-km and break-even logic is specific to trucking and freight.
Compatibility and requirements
- Microsoft Excel desktop. Designed for and tested in Microsoft Excel for Microsoft 365 (Windows): recalculated from scratch with 0 formula errors and all checks OK.
- Standard Excel functions only (no dynamic arrays), no macros, no add-ins, no external links, works offline.
- Not yet tested in Excel 2016/2019, Excel for Mac or Excel for the web.
- No locked cells and no passwords: every formula is visible and editable.
Support
- Questions on how to use the model are answered through the eFinancialModels messaging system, in English or Spanish, within 3 business days.
- Bug fixes are free for 12 months after purchase.
- Customisation is not included; it can be quoted separately.
Terms of use
- Single-user licence (one company or one advisor). Resale or redistribution is prohibited.
- Provided as a planning template with fictitious example data. Not investment, tax or accounting advice; results depend entirely on your assumptions.
Similar ProductsOther customers were also interested in...



 eFinancialModels
Electric Vehicle (EV) Charging Station Financial M...
With this comprehensive 5- or 10-year monthly tool, investors can assess the viability of setting up... Read more

Financial Model for Mobile App | Mobile App Busine...
The Mobile App Financial Plan Template in Excel allows you to develop financial projections when lau... Read more

 HenrySheykin
Food Truck Financial Model Excel Template
The Food Truck Financial Model helps entrepreneurs, founders, business owners, consultants, and anal... Read more

Green Hydrogen Production from Wind Energy Financi...
The Green Hydrogen from Wind Financial Model aims to comprehensively forecast a horizon of 40 years ... Read more

Simple Mutual Non-Disclosure Agreement Template
Protect your business secrets with ease using our Simple Mutual Non-Disclosure Agreement Template. S... Read more

Solar Energy Financial Model
The Solar Energy Financial Model Spreadsheet Template in Excel assists you in preparing a sophistica... Read more

 Peter Graf
The Customer-Centric Financial Model for Restauran...
Starting a restaurant without a financial plan is like driving a car blindfolded. You wouldn´t do i... Read more
You must log in to submit a review.