
0 ITEMS

Themed Restaurant Financial Model Excel Template
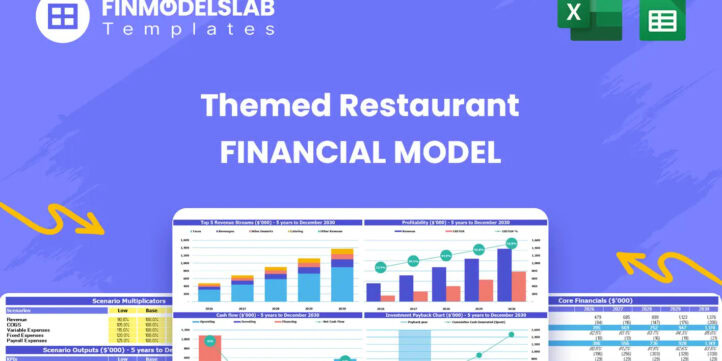
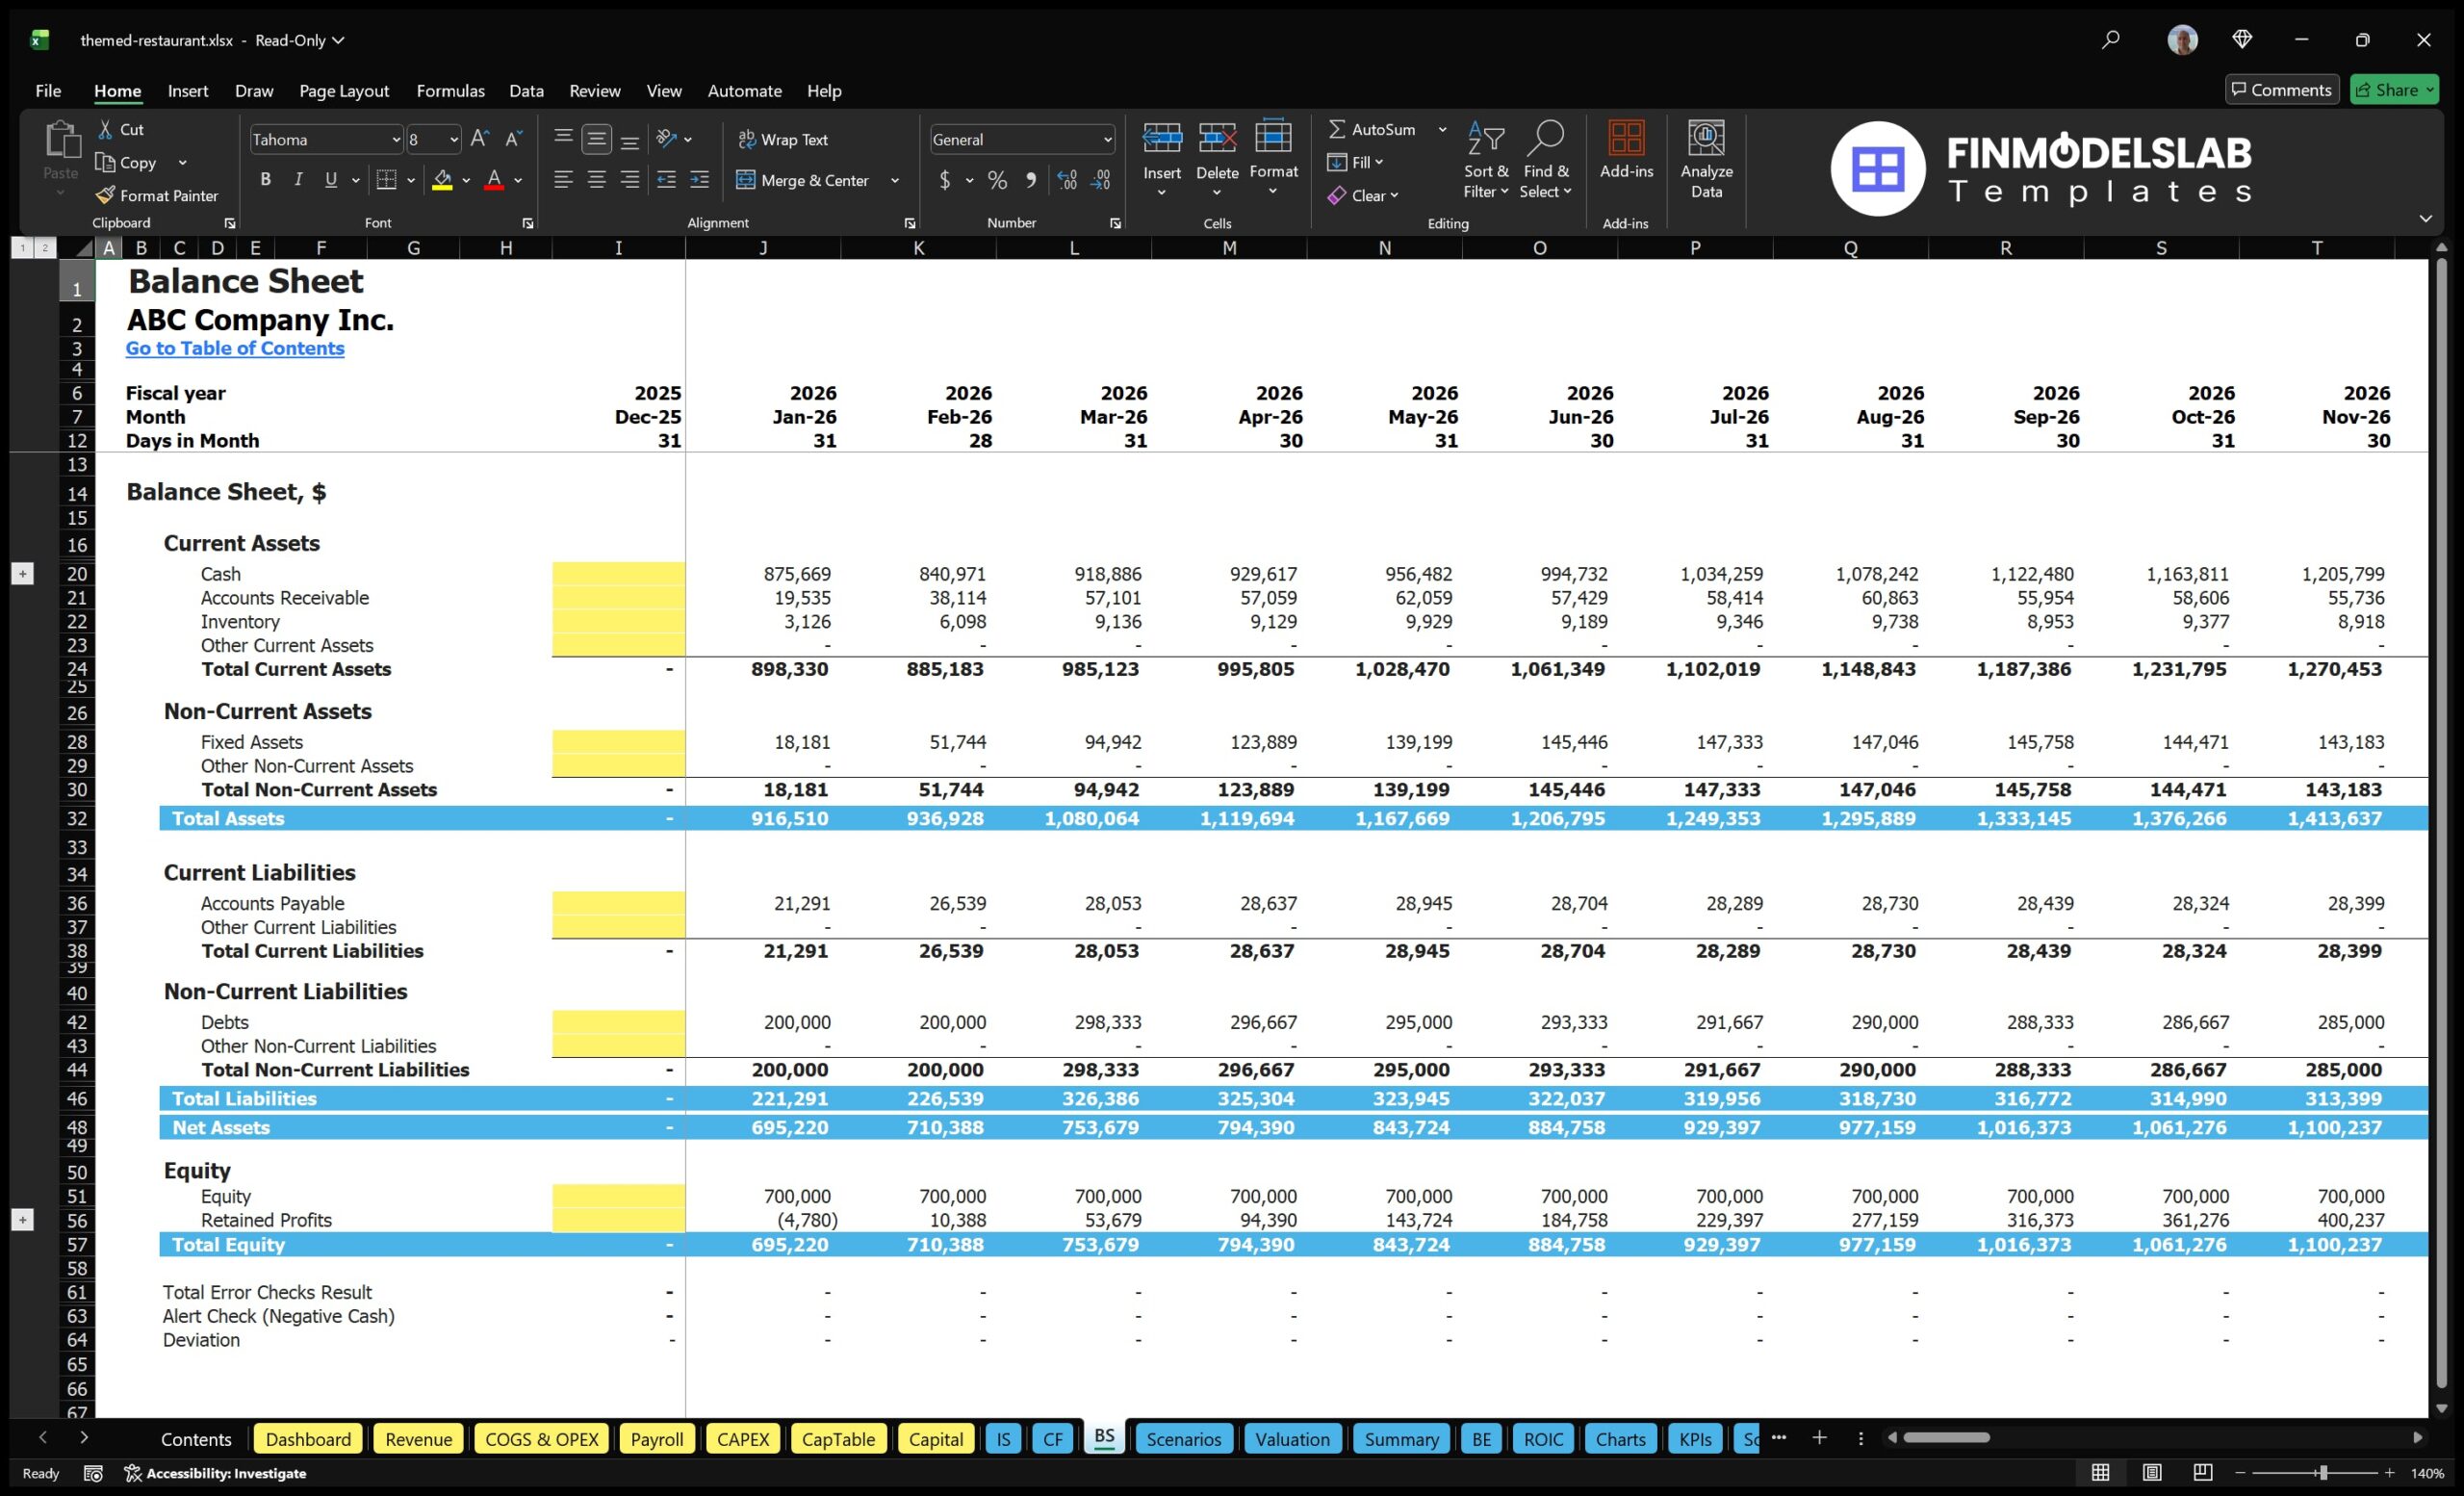
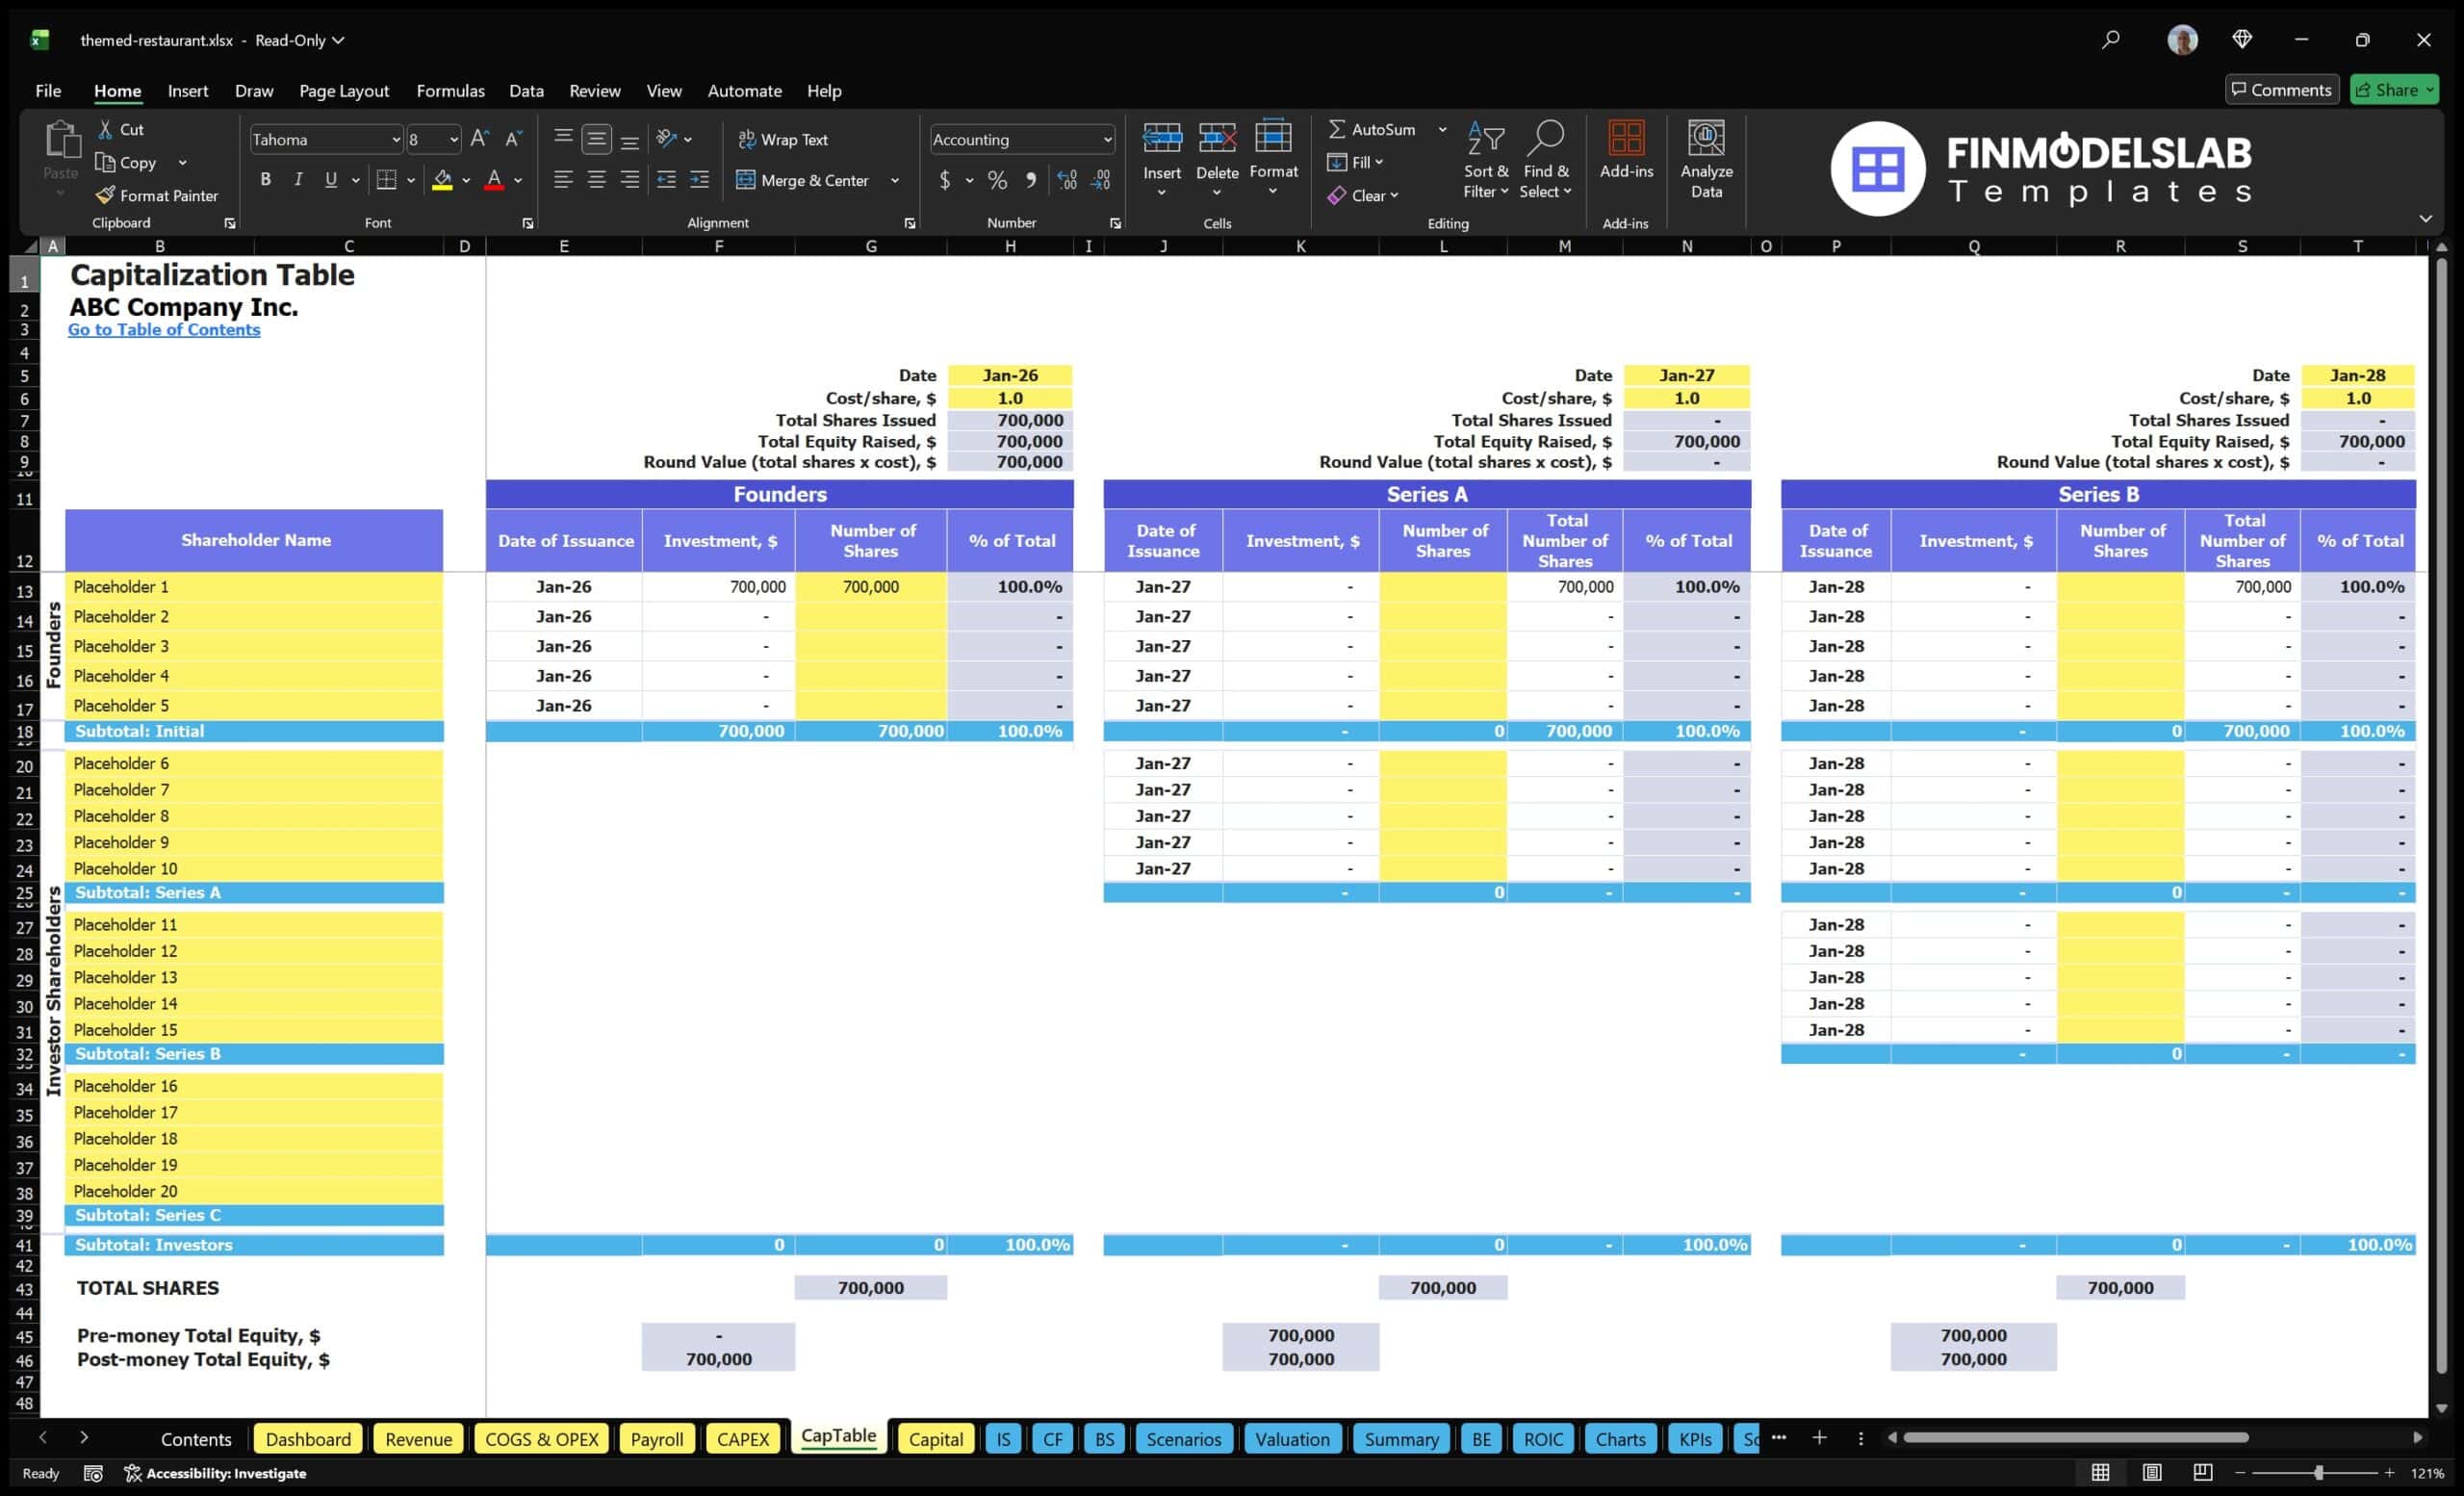
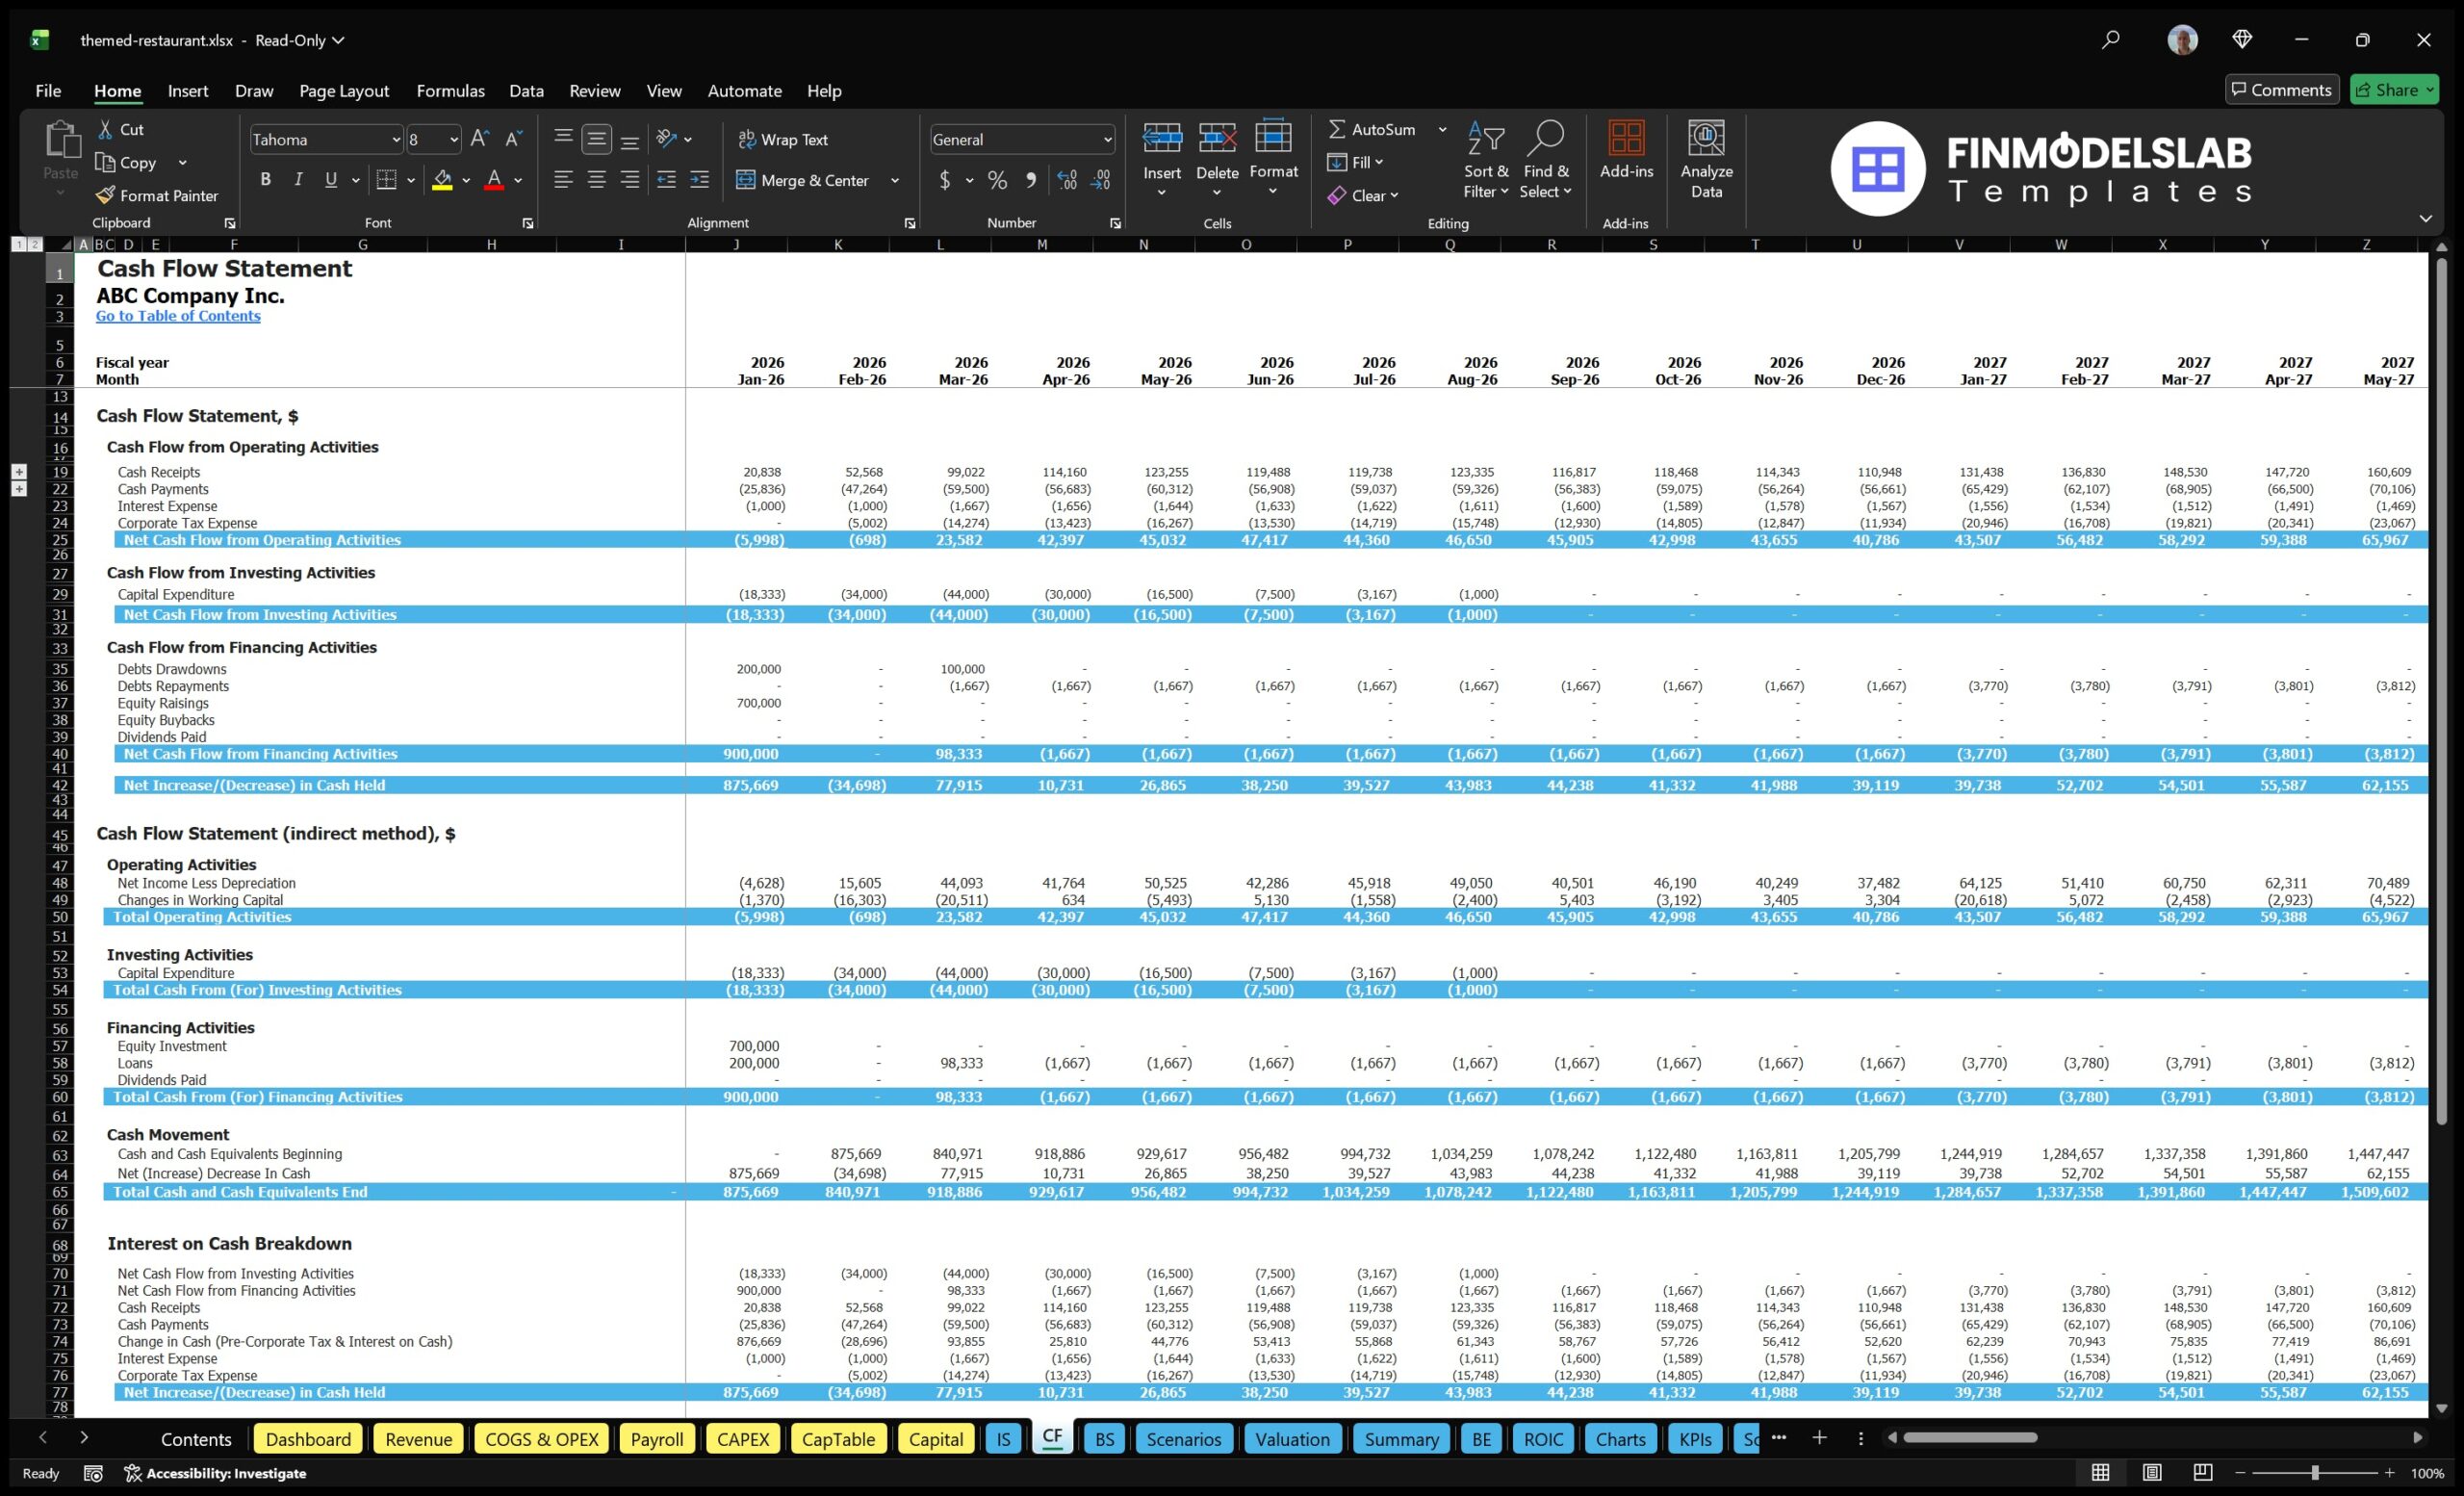
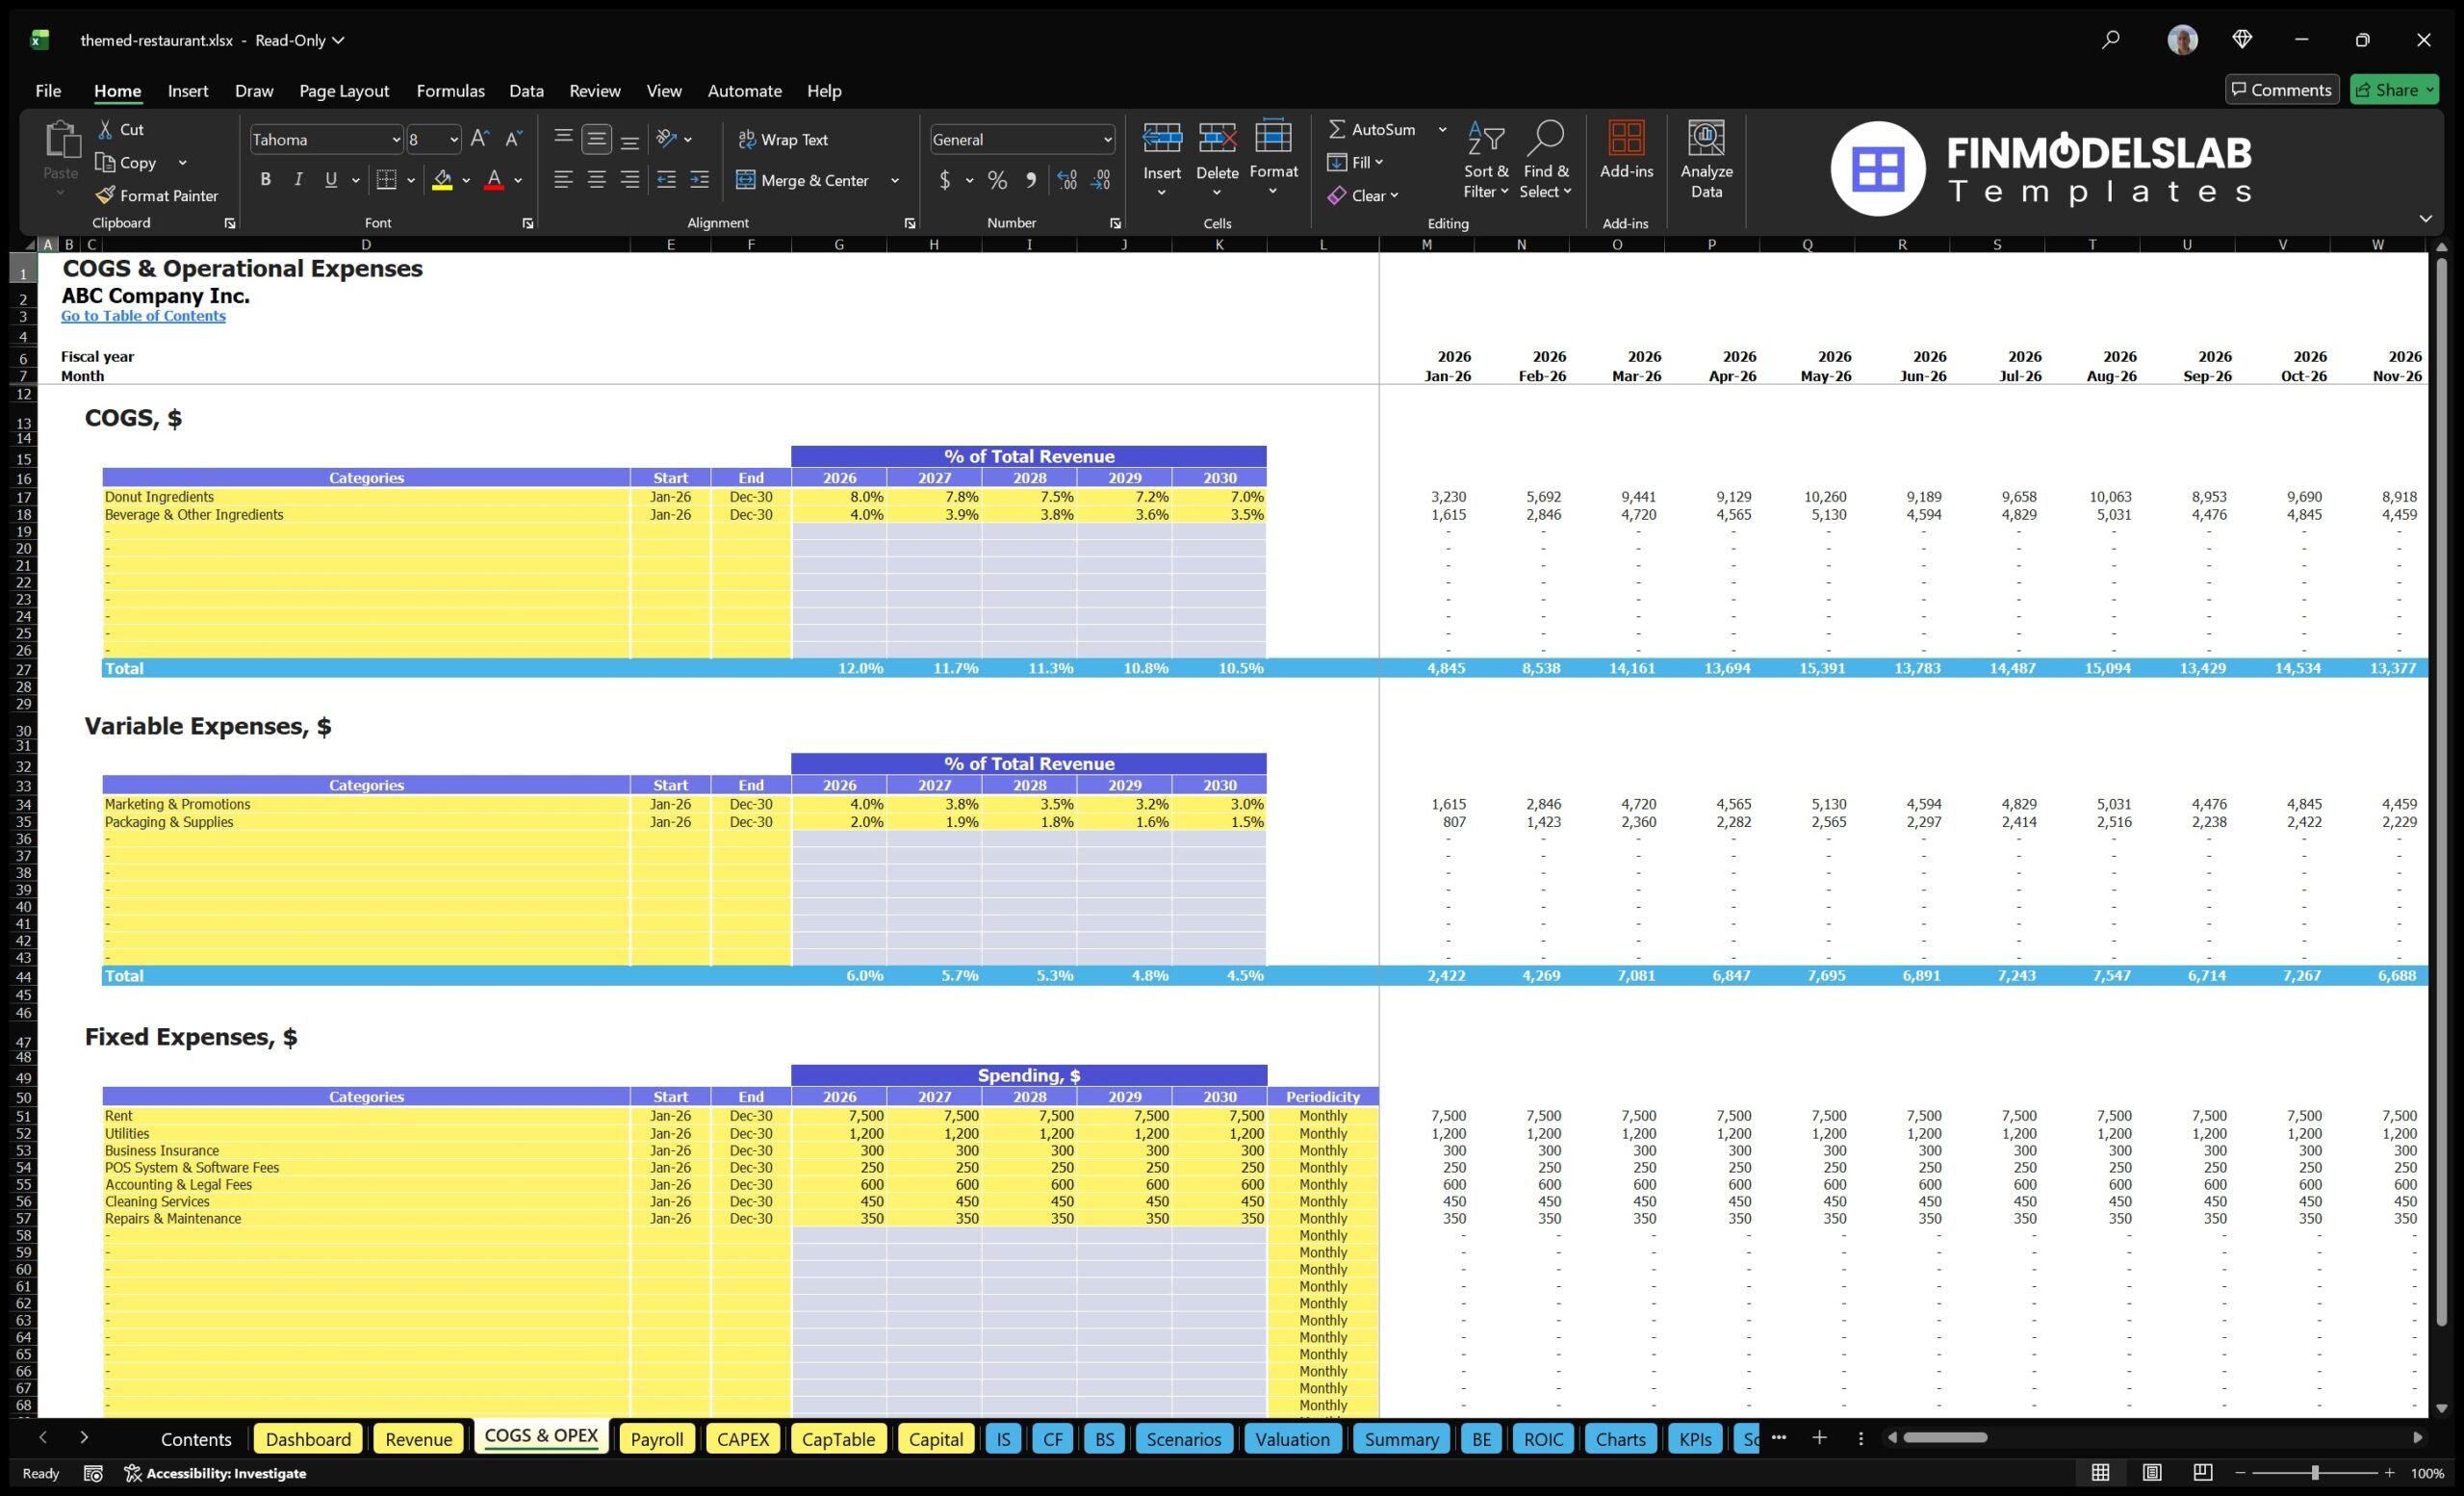
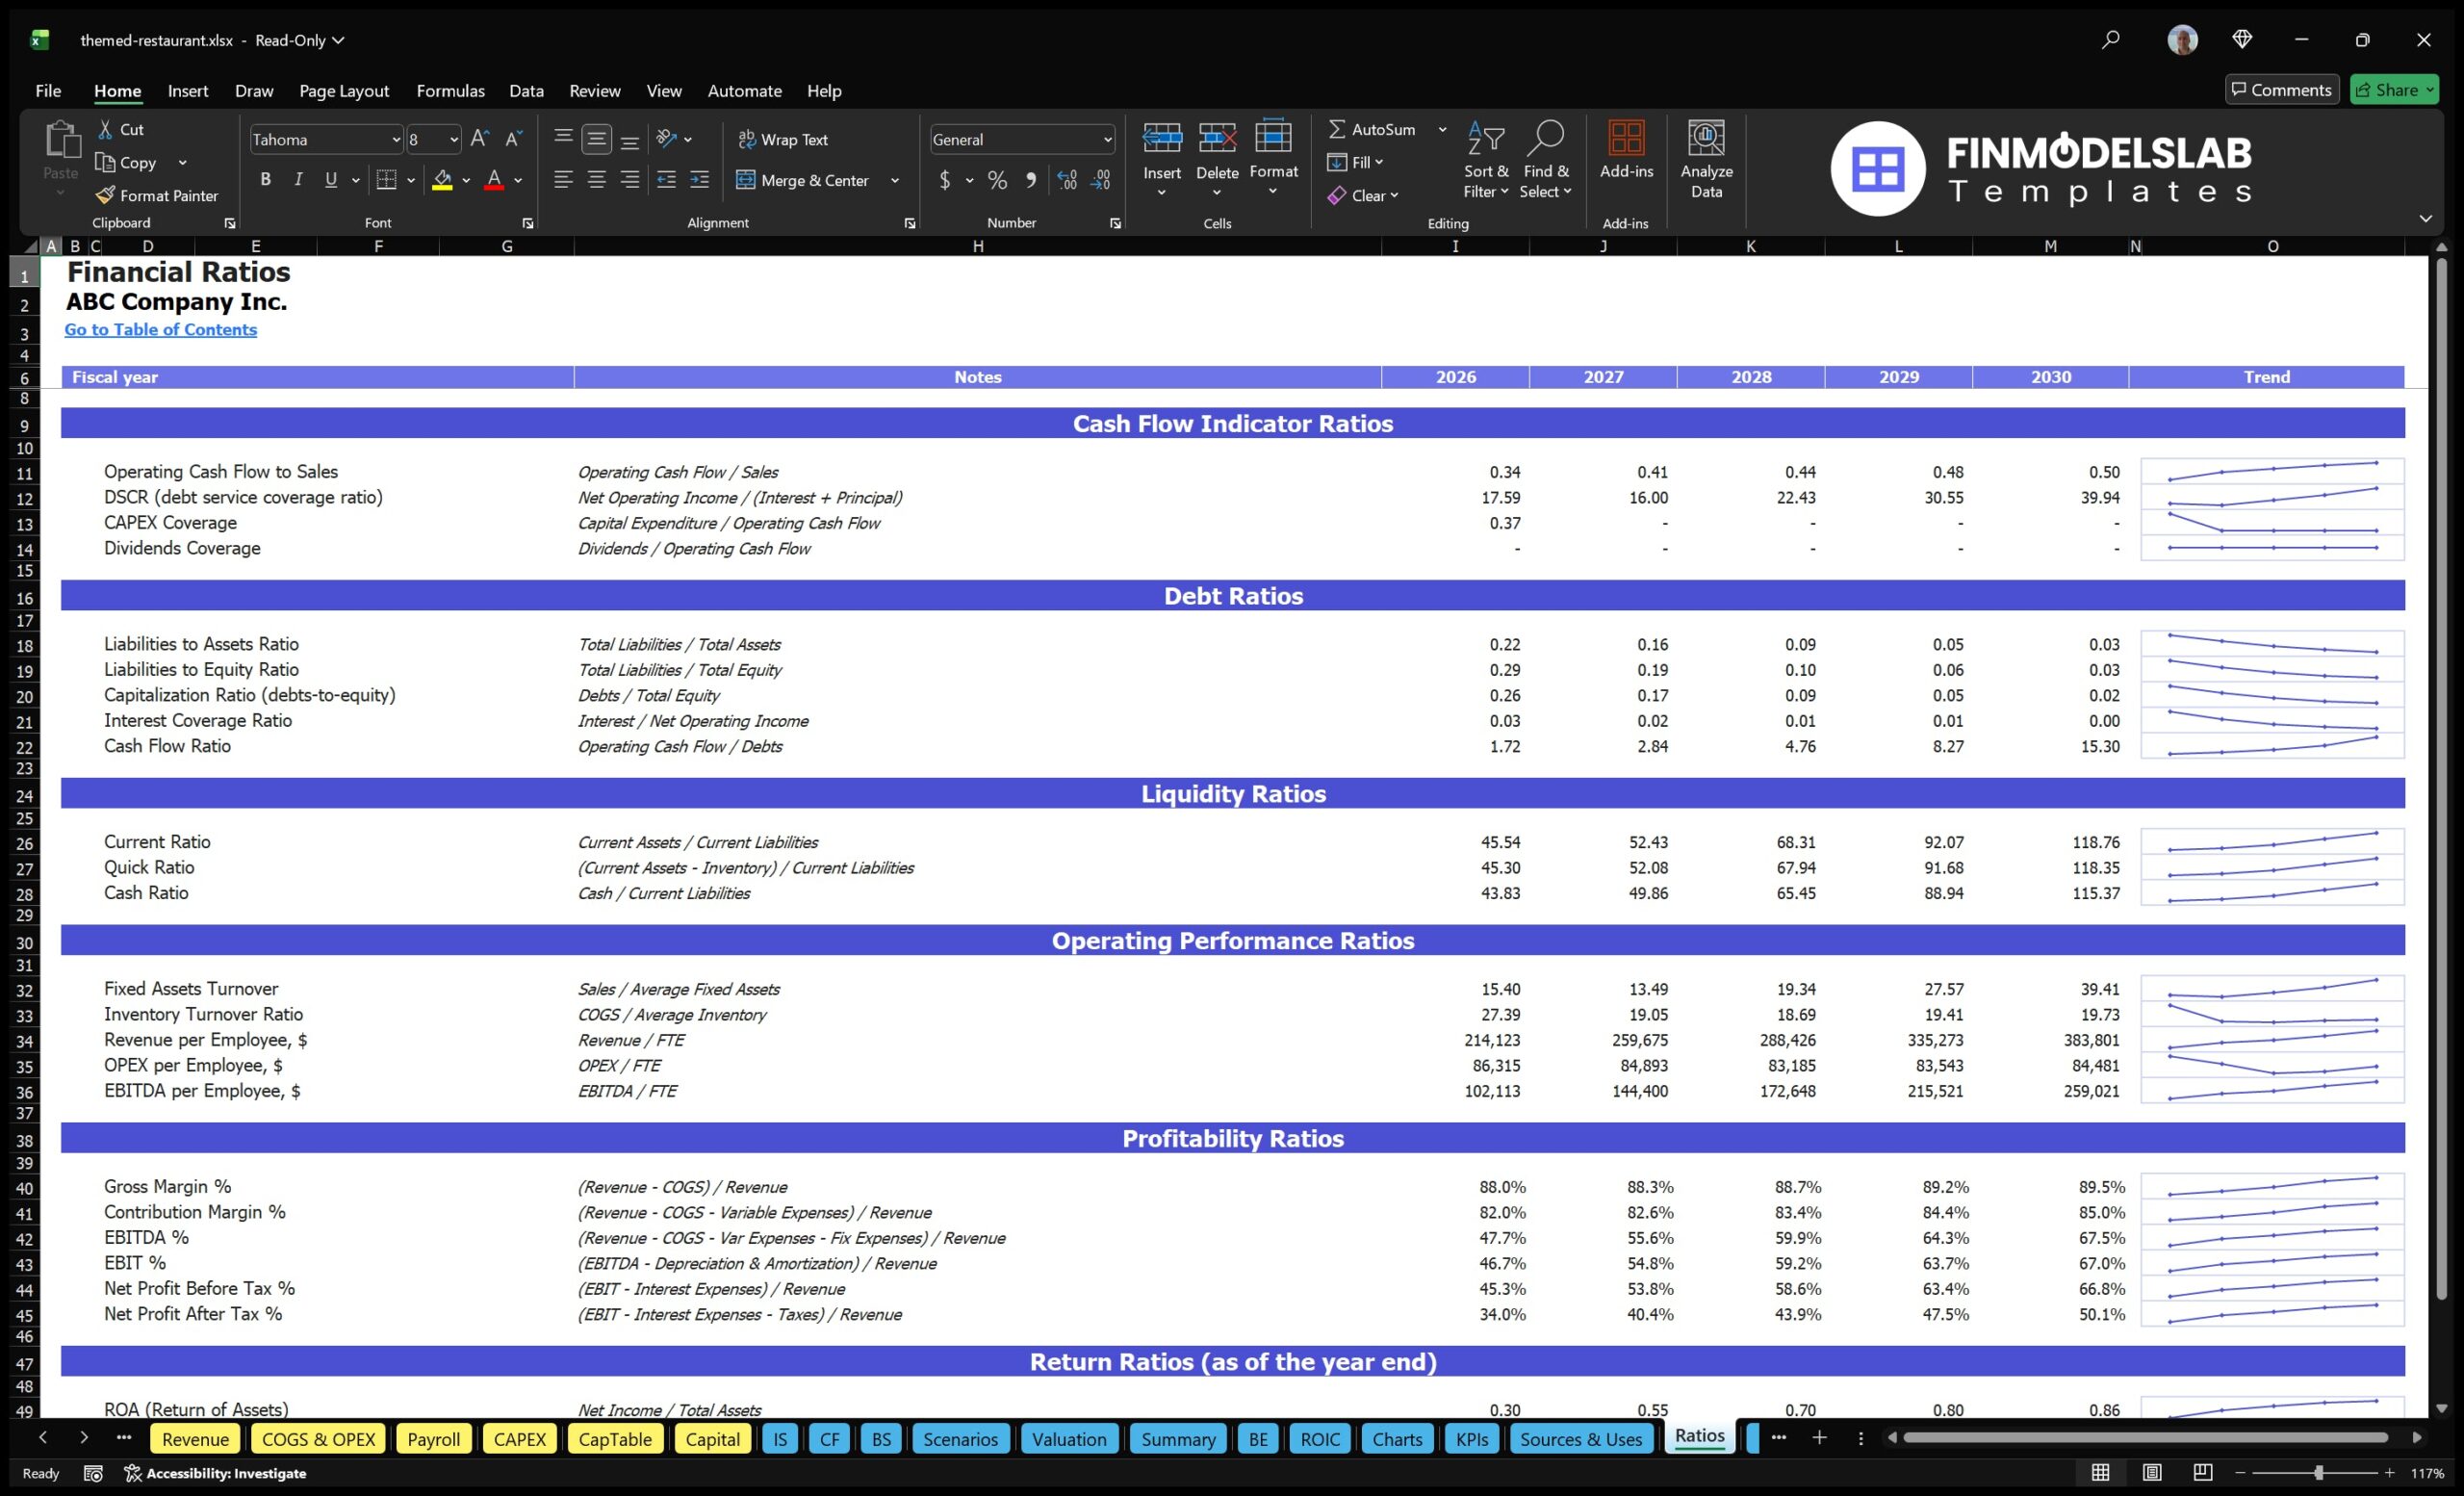
The Themed Restaurant Financial Model helps entrepreneurs, founders, business owners, consultants, and analysts build a structured financial forecast for a concept restaurant without starting from a blank spreadsheet. It is designed for users who need to plan a launch, prepare a business plan, evaluate funding needs, or present restaurant financial projections to lenders, investors, partners, or internal stakeholders. The template connects the major drivers of a themed restaurant, including customer traffic, average check size, sales mix, startup costs, payroll, operating expenses, cash flow, and profitability, so users can understand how the business may perform before committing capital. This financial model template is especially useful for restaurants with a distinct theme, customer experience, menu concept, or entertainment-driven positioning. Instead of relying on generic assumptions, users can adjust revenue assumptions such as daily covers, weekday and weekend demand, menu categories, average order values, catering activity, and growth expectations. The model also supports detailed planning for food costs, beverage costs, labor, rent, utilities, marketing, equipment, fit-out, working capital, and other restaurant-specific expenses. By organizing these assumptions in one editable structure, the template helps users create realistic financial planning outputs that support better decision-making. The model includes a full forecasting framework for up to five years, including revenue projections, profit and loss analysis, cash flow forecasting, balance sheet planning, break-even analysis, scenario comparison, return metrics, dashboards, and visual reports. This allows users to evaluate profitability, test downside and upside cases, review funding requirements, and identify the operational levers that have the greatest impact on results. Whether the goal is to open a new themed restaurant, refine an existing restaurant plan, compare expansion options, or prepare investor-ready documentation, the template provides a practical way to translate business assumptions into financial outcomes. Because the template is fully customizable, users can adapt it to different restaurant formats, pricing strategies, staffing plans, launch budgets, and market conditions. It works as a planning tool for non-financial users while still providing the level of detail expected by professional stakeholders. With pre-built formulas, organized inputs, automated outputs, and presentation-ready reporting, the Themed Restaurant Financial Model helps save time, reduce planning errors, and support confident decisions around startup investment, operations, cash flow management, and long-term profitability.
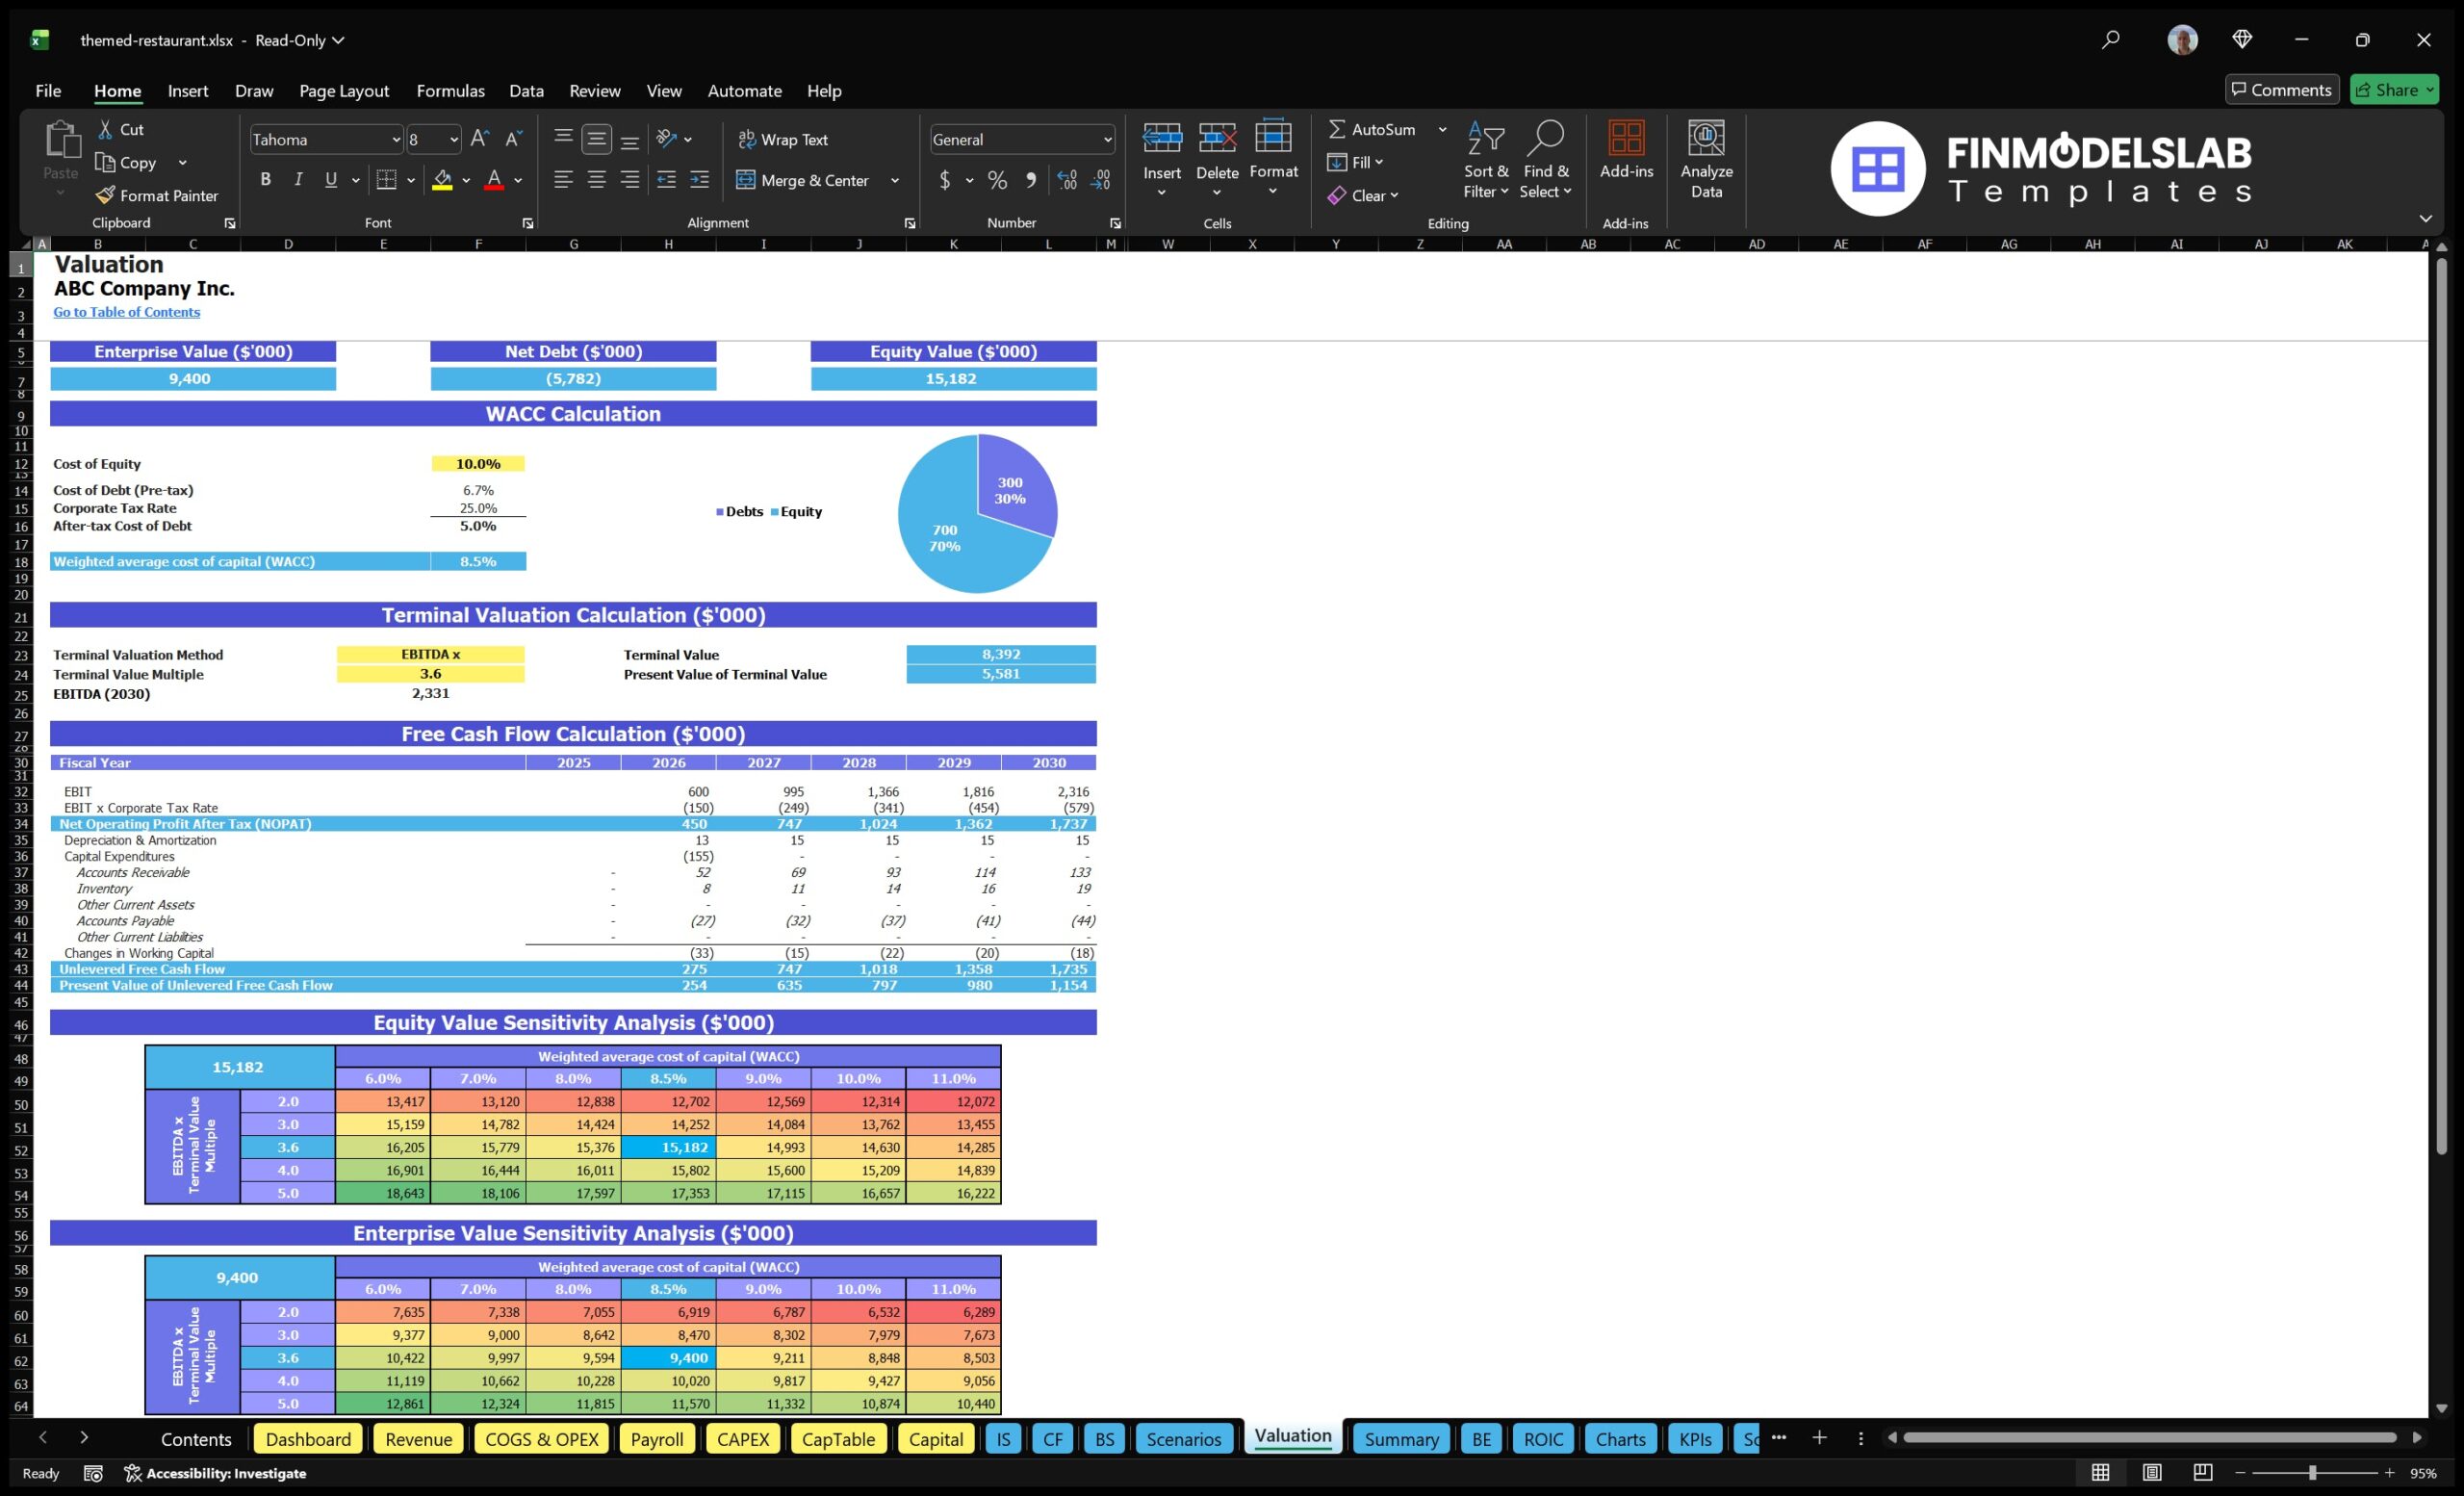
Financial Model Overview
The Themed Restaurant Financial Model is a ready-to-use financial model template built for planning, launching, funding, and managing a themed restaurant concept. It gives entrepreneurs, restaurant owners, founders, consultants, and financial analysts a structured way to forecast revenue, estimate startup investment, plan operating expenses, monitor cash flow, assess profitability, and prepare lender or investor-ready financial outputs. A themed restaurant often depends on more than standard food service economics because the concept, experience, décor, menu mix, event potential, customer traffic patterns, and brand positioning can all affect performance. This template brings those assumptions into one editable model, allowing users to adjust daily covers, average check values, menu category sales, staffing, cost of goods sold, capital expenditure, and growth scenarios. Instead of building formulas and reports from scratch, users can start with a professional framework that includes core financial statements, dashboards, charts, scenarios, return metrics, break-even planning, and detailed assumptions. The result is a practical financial planning tool that helps users evaluate whether the concept can generate enough revenue, margin, cash flow, and return on investment to support launch, expansion, or funding discussions.
All-in-one Dashboard
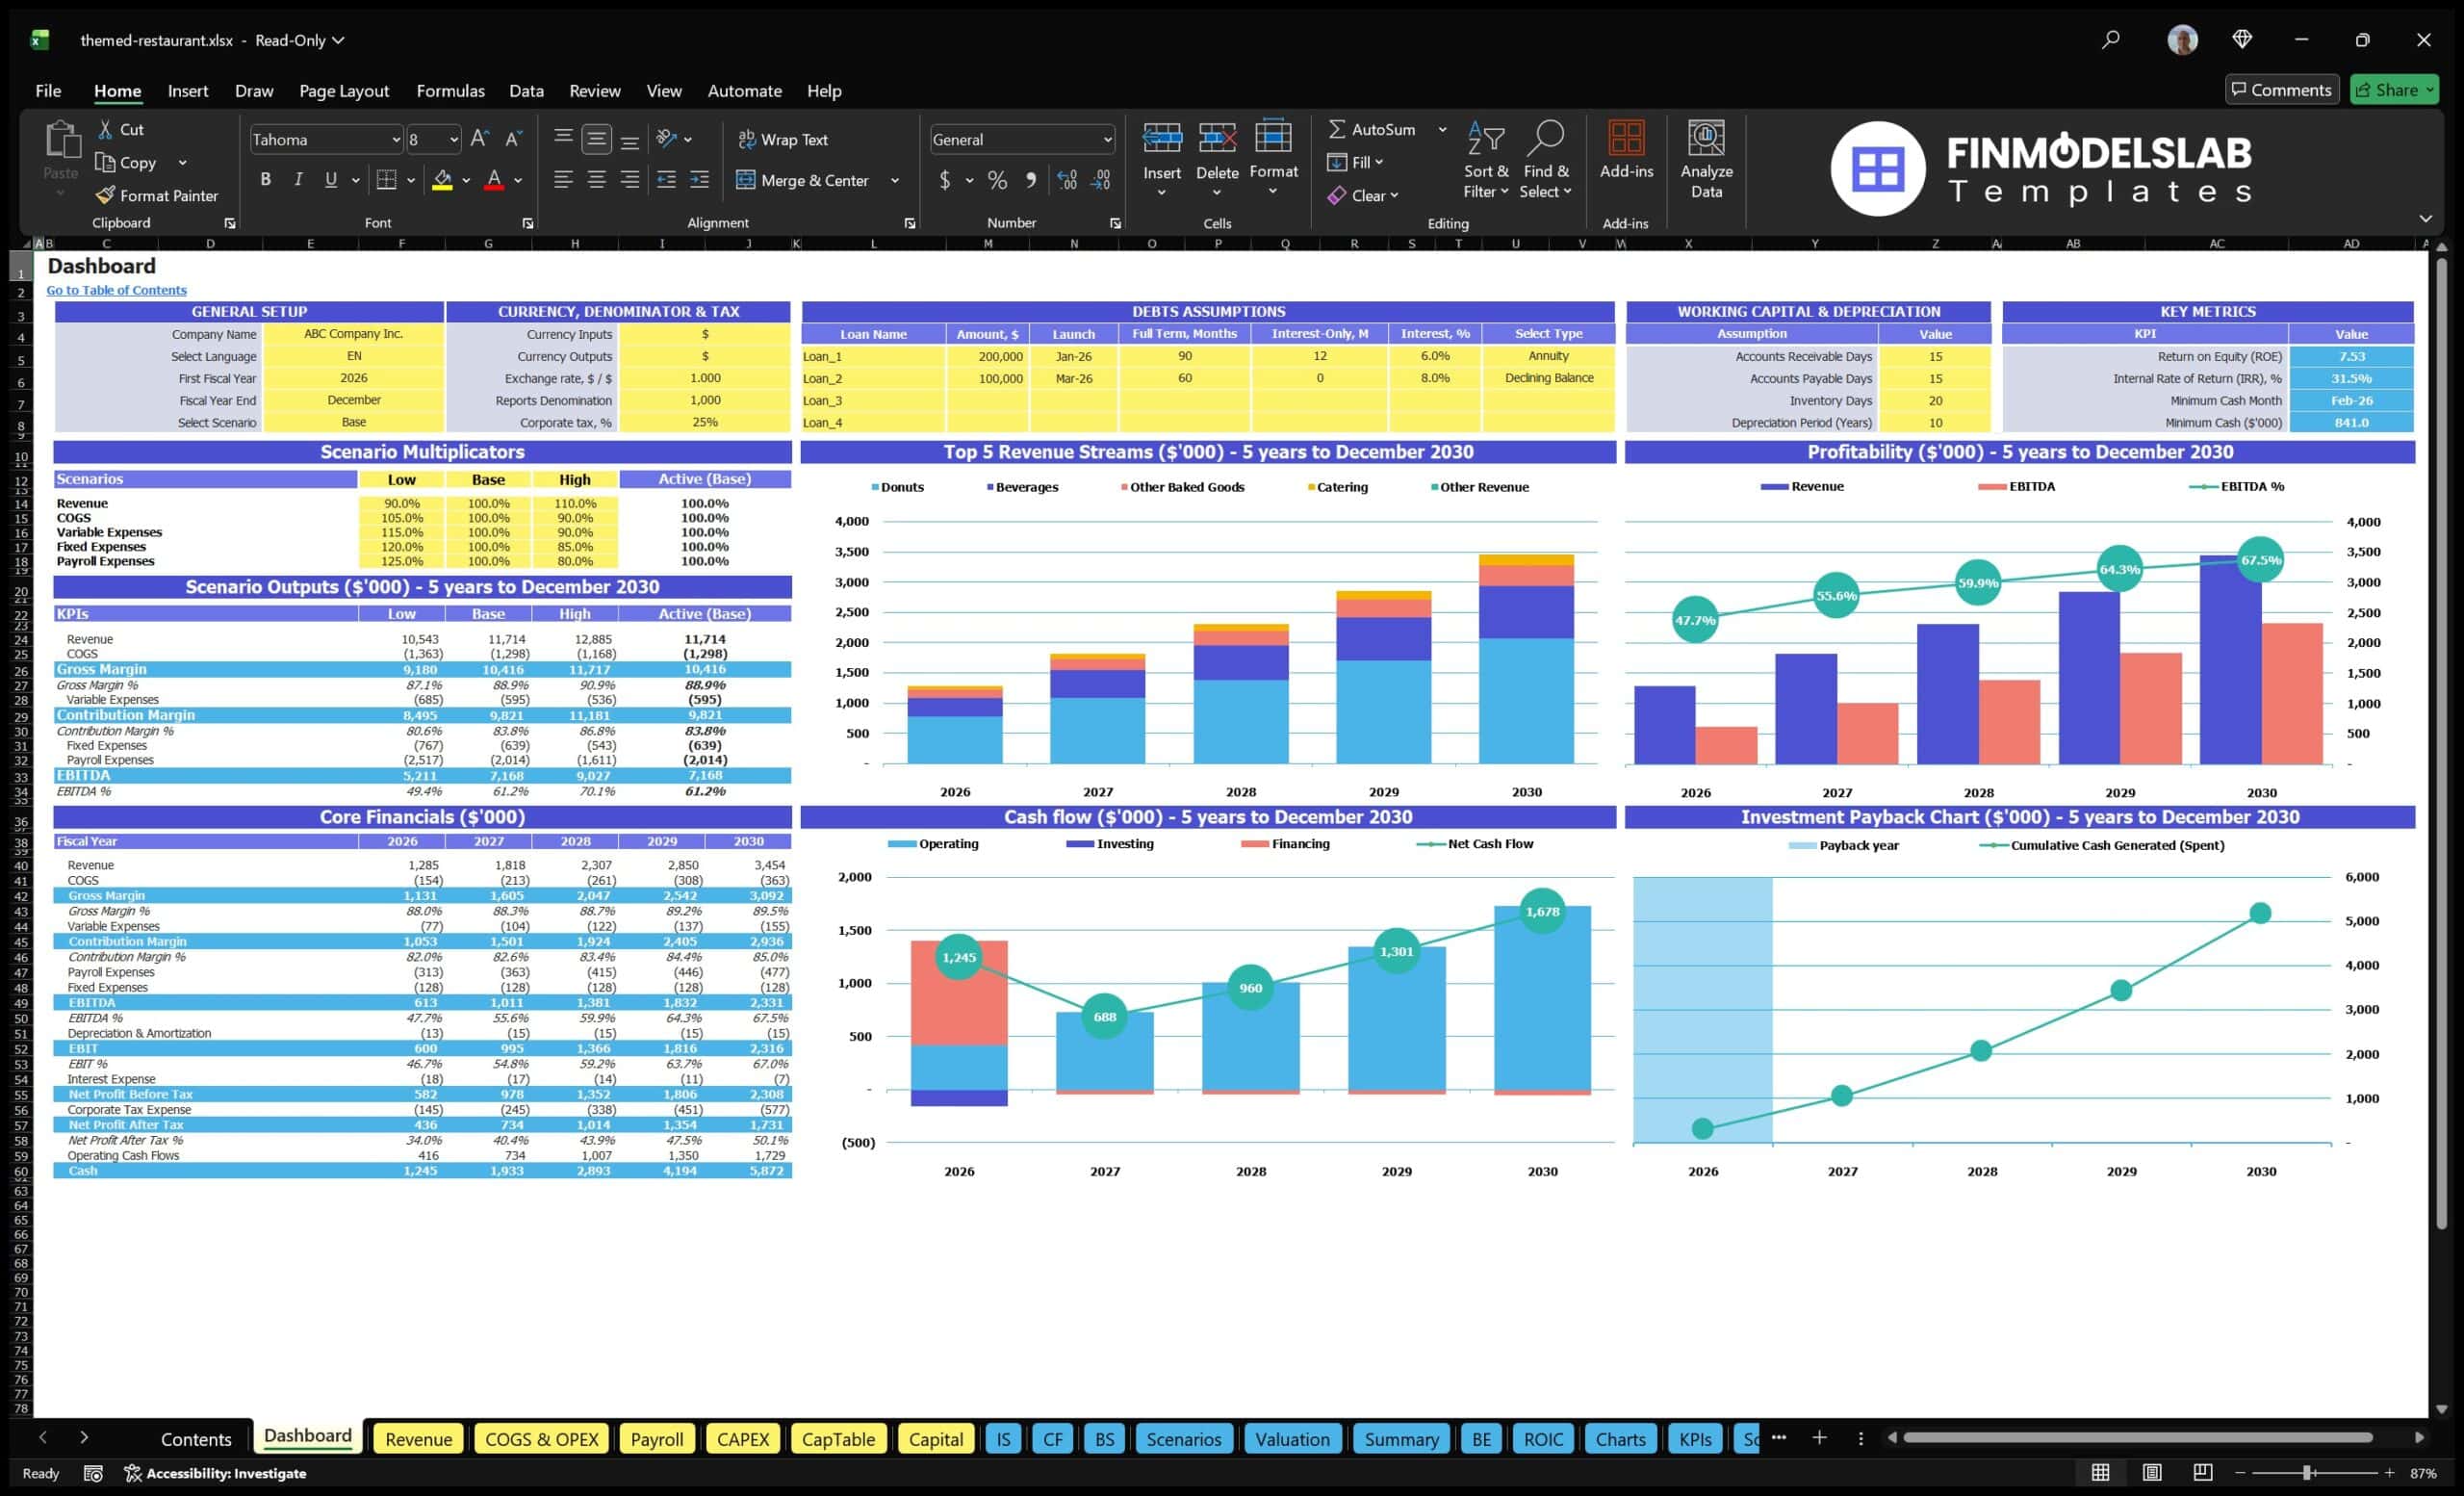
The all-in-one dashboard gives users a central view of the most important inputs and outputs in the Themed Restaurant Financial Model. It is designed to reduce the time spent navigating through separate tabs by bringing together core assumptions, high-level performance indicators, and key forecast results in one organized area. Users can review important drivers such as customer volume, average check, revenue growth, operating margins, cash position, profitability, and investment returns while also seeing how changes in assumptions flow through the model. For a themed restaurant, this is especially useful because management needs to understand how traffic patterns, menu pricing, event demand, and operating costs interact. The dashboard helps users quickly identify whether revenue is strong enough to cover food costs, payroll, rent, marketing, utilities, and other recurring expenses. It also supports planning meetings, investor discussions, and internal reviews by presenting complex financial information in a clear and practical format. Rather than searching through detailed schedules for every answer, users can begin with the dashboard to understand the overall financial health of the concept and then move into the supporting sections for deeper analysis.
Low/Base/High Scenario Analysis
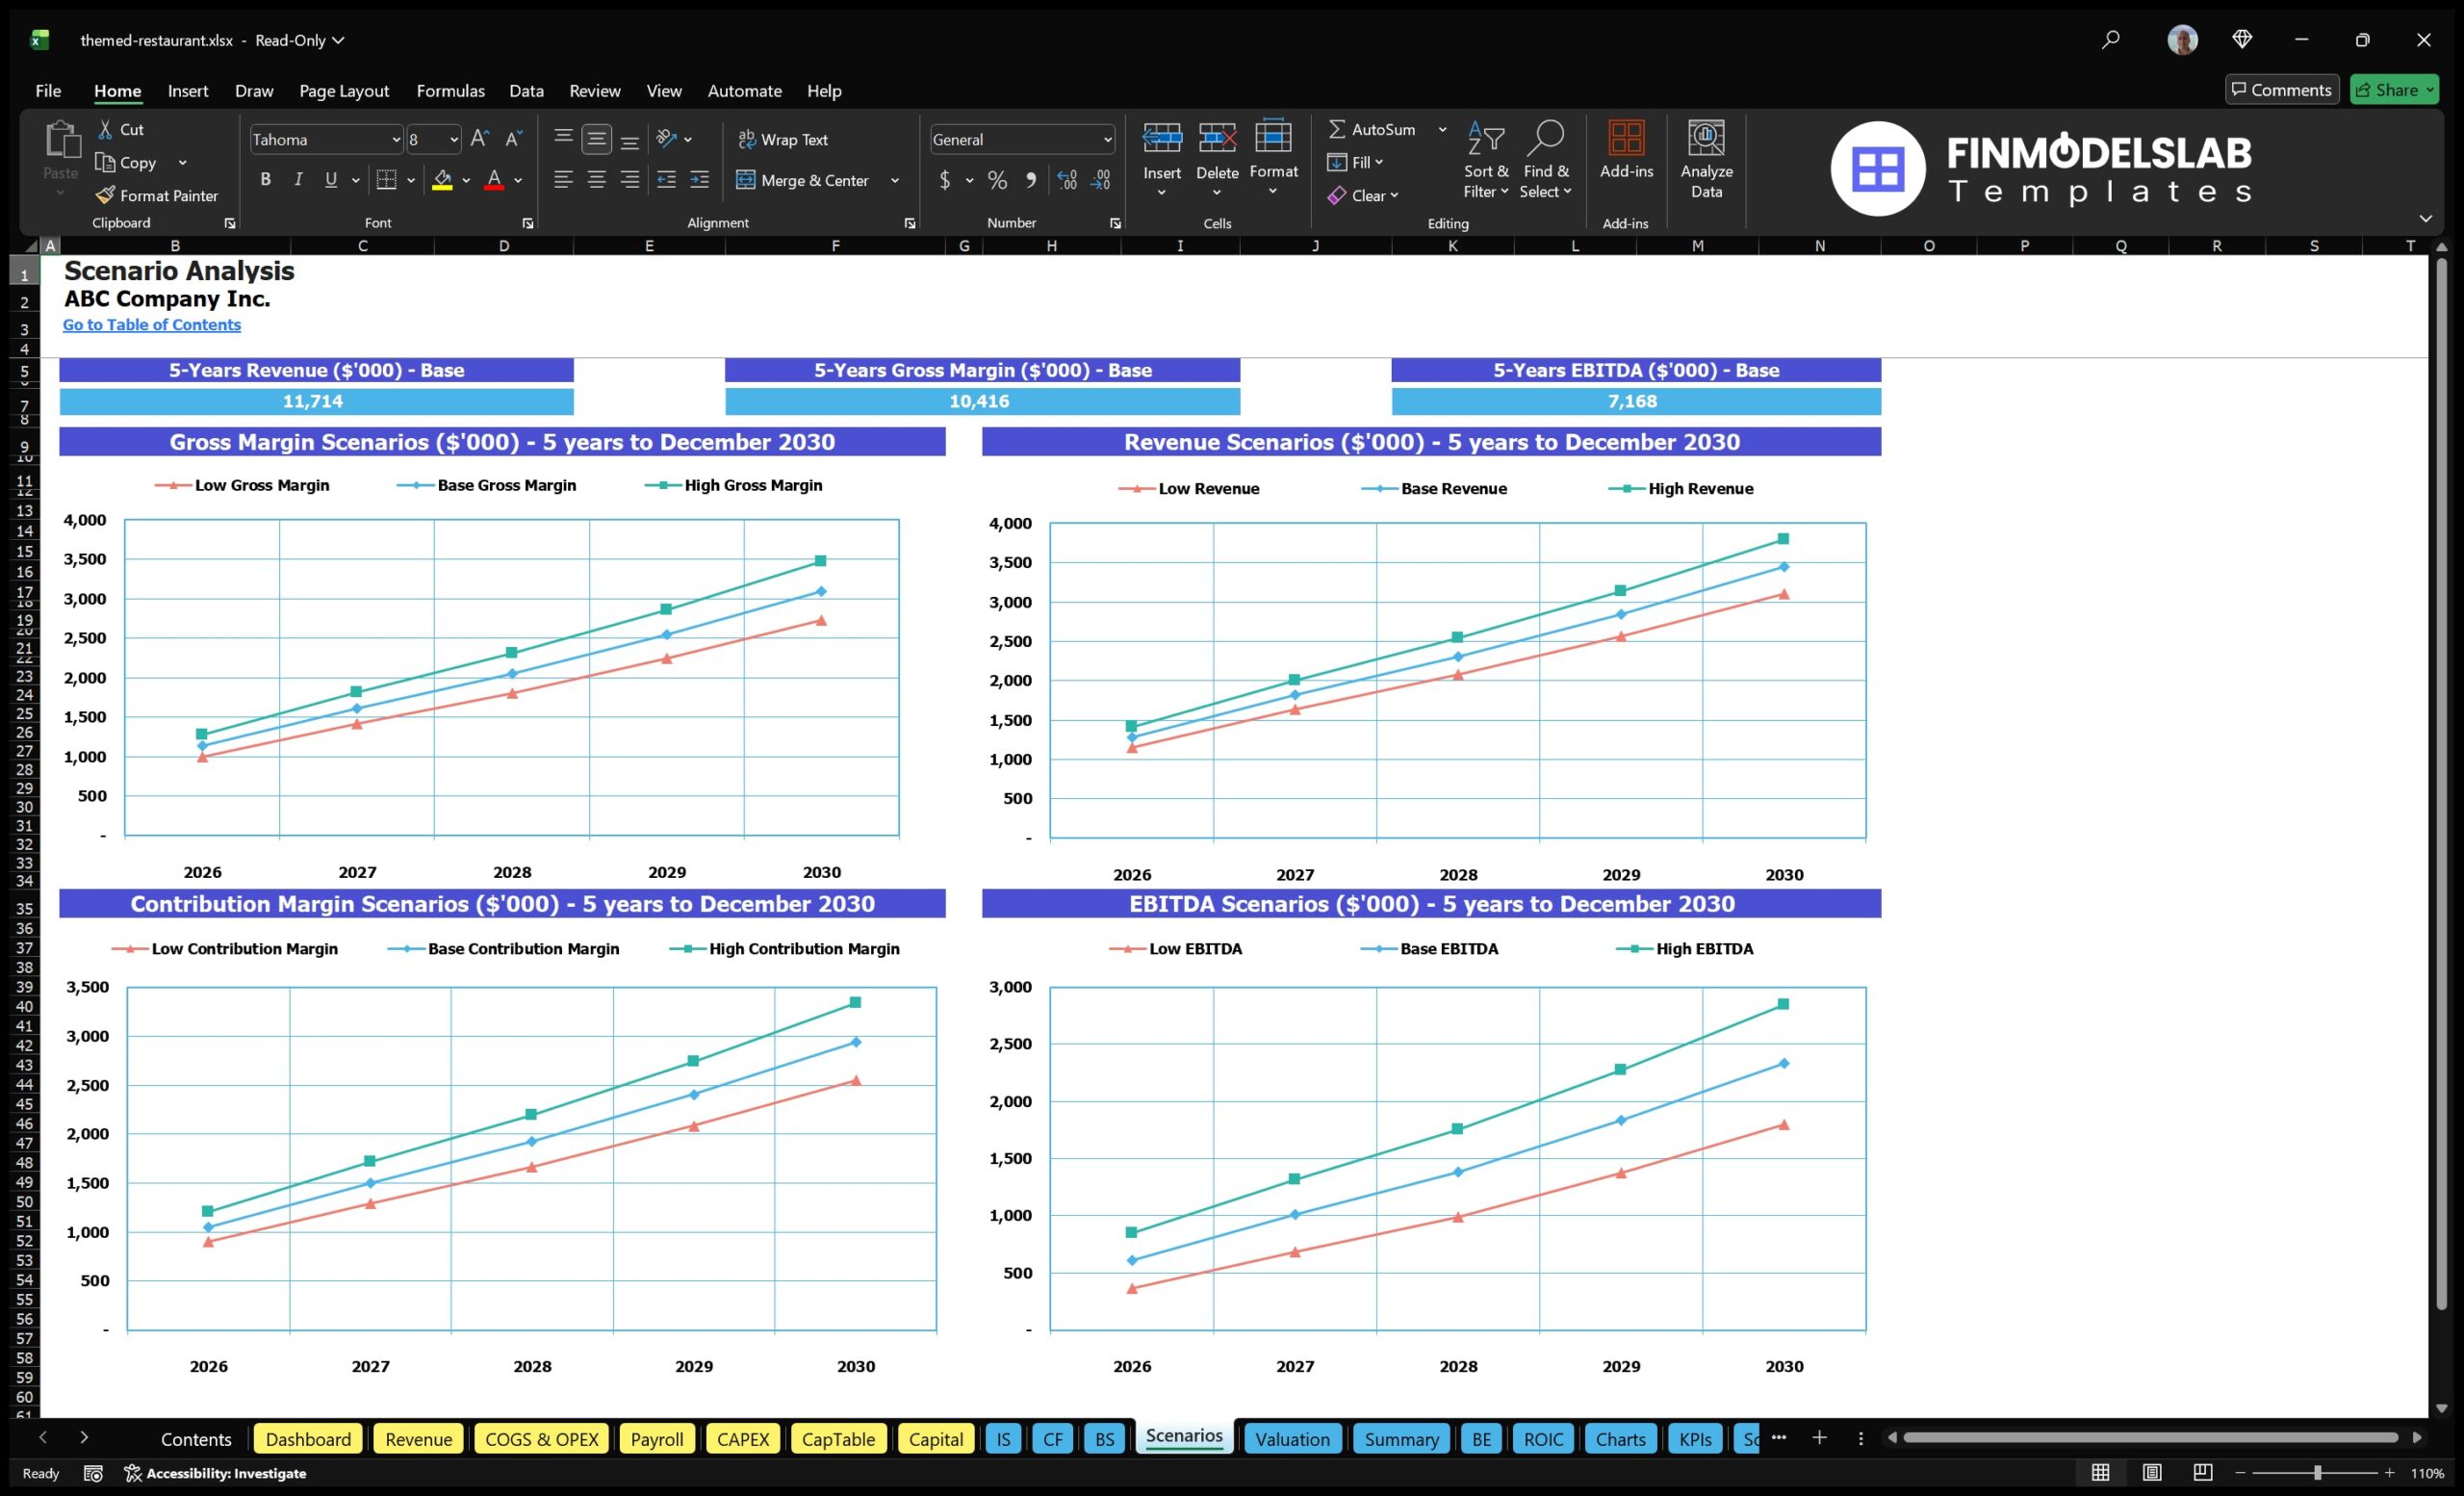
The Low/Base/High scenario analysis section allows users to test how the themed restaurant may perform under different business conditions. A restaurant forecast is rarely certain, so this component helps users model a conservative case, an expected case, and an upside case using different assumptions for customer traffic, average check size, sales mix, cost of goods sold, payroll requirements, marketing spend, rent, and growth rates. In a low scenario, users can see how slower customer adoption, higher food costs, weaker weekday demand, or heavier launch expenses may affect cash flow and profitability. In the base scenario, users can model the operating plan they believe is most realistic. In the high scenario, users can test stronger demand, improved margins, higher catering activity, premium menu pricing, or faster brand recognition. The output helps compare revenue, EBITDA, net profit, cash balance, and return metrics across cases, making it easier to plan for risk and opportunity. This is valuable for funding conversations because lenders and investors often want to know whether the business can survive a weaker opening period and what upside may exist if the concept gains traction quickly. It also helps owners make better decisions about staffing, purchasing, marketing intensity, and capital reserves before committing to a fixed operating plan.
Professional Charts
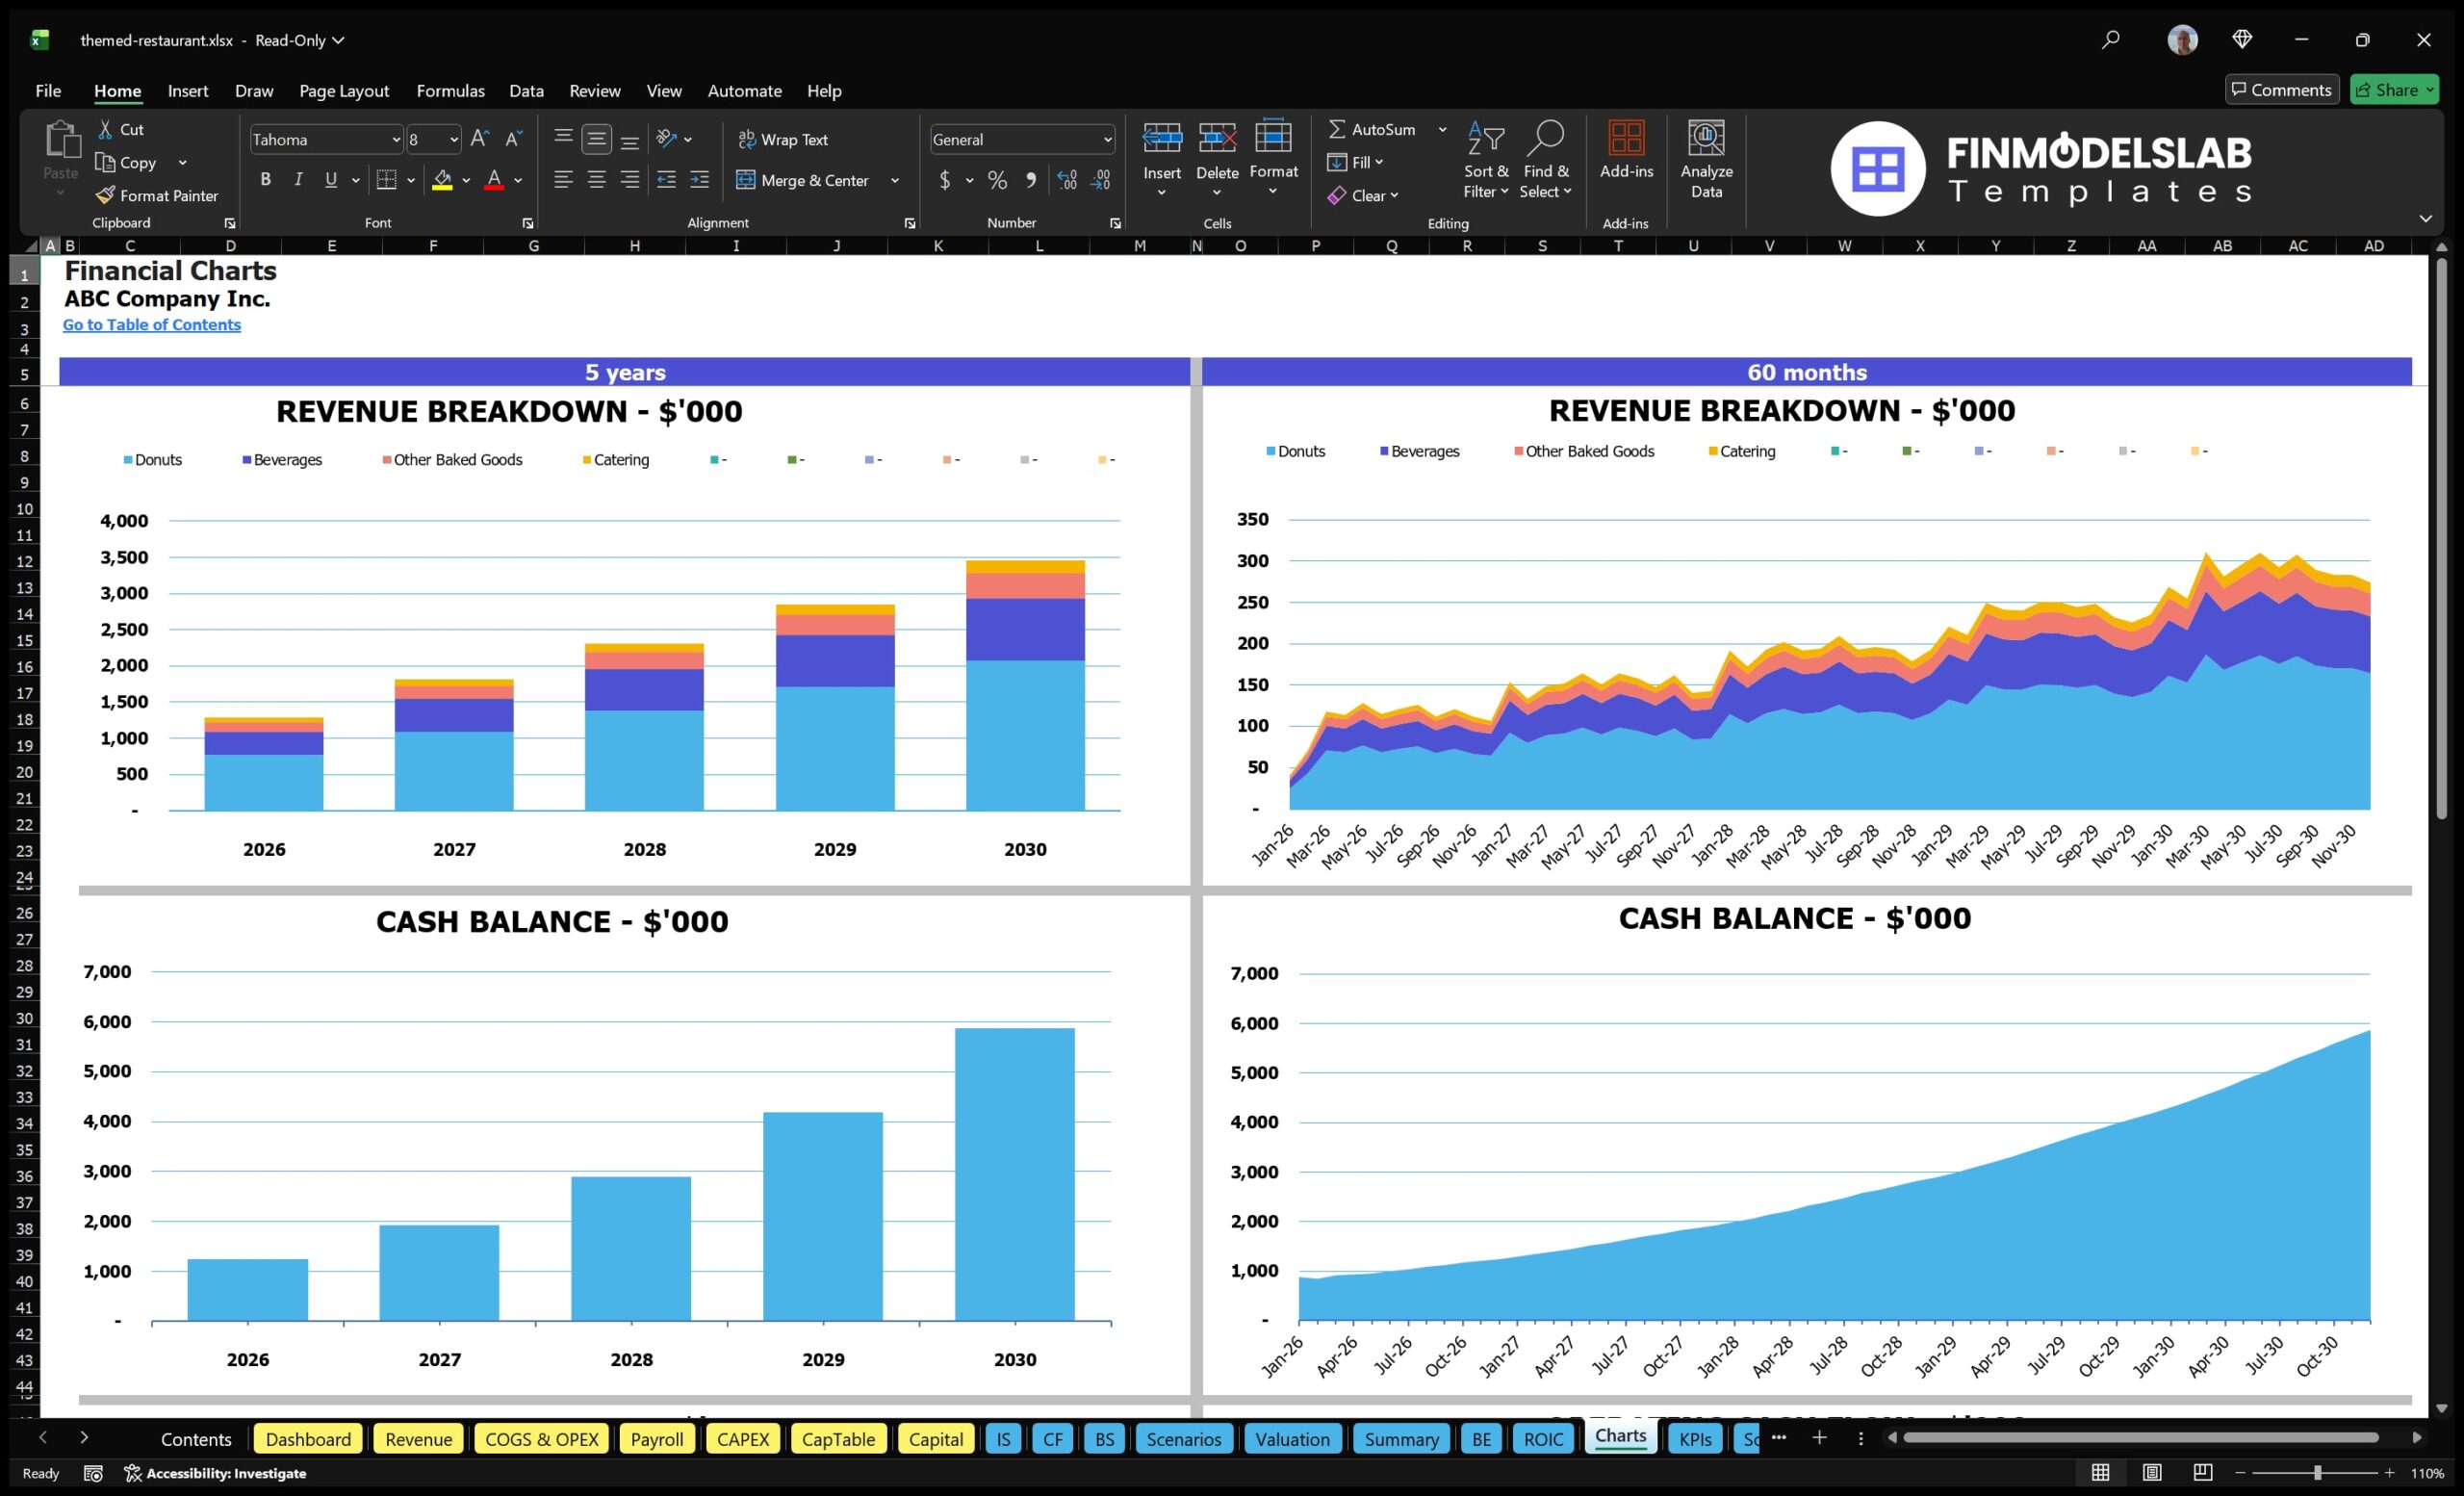
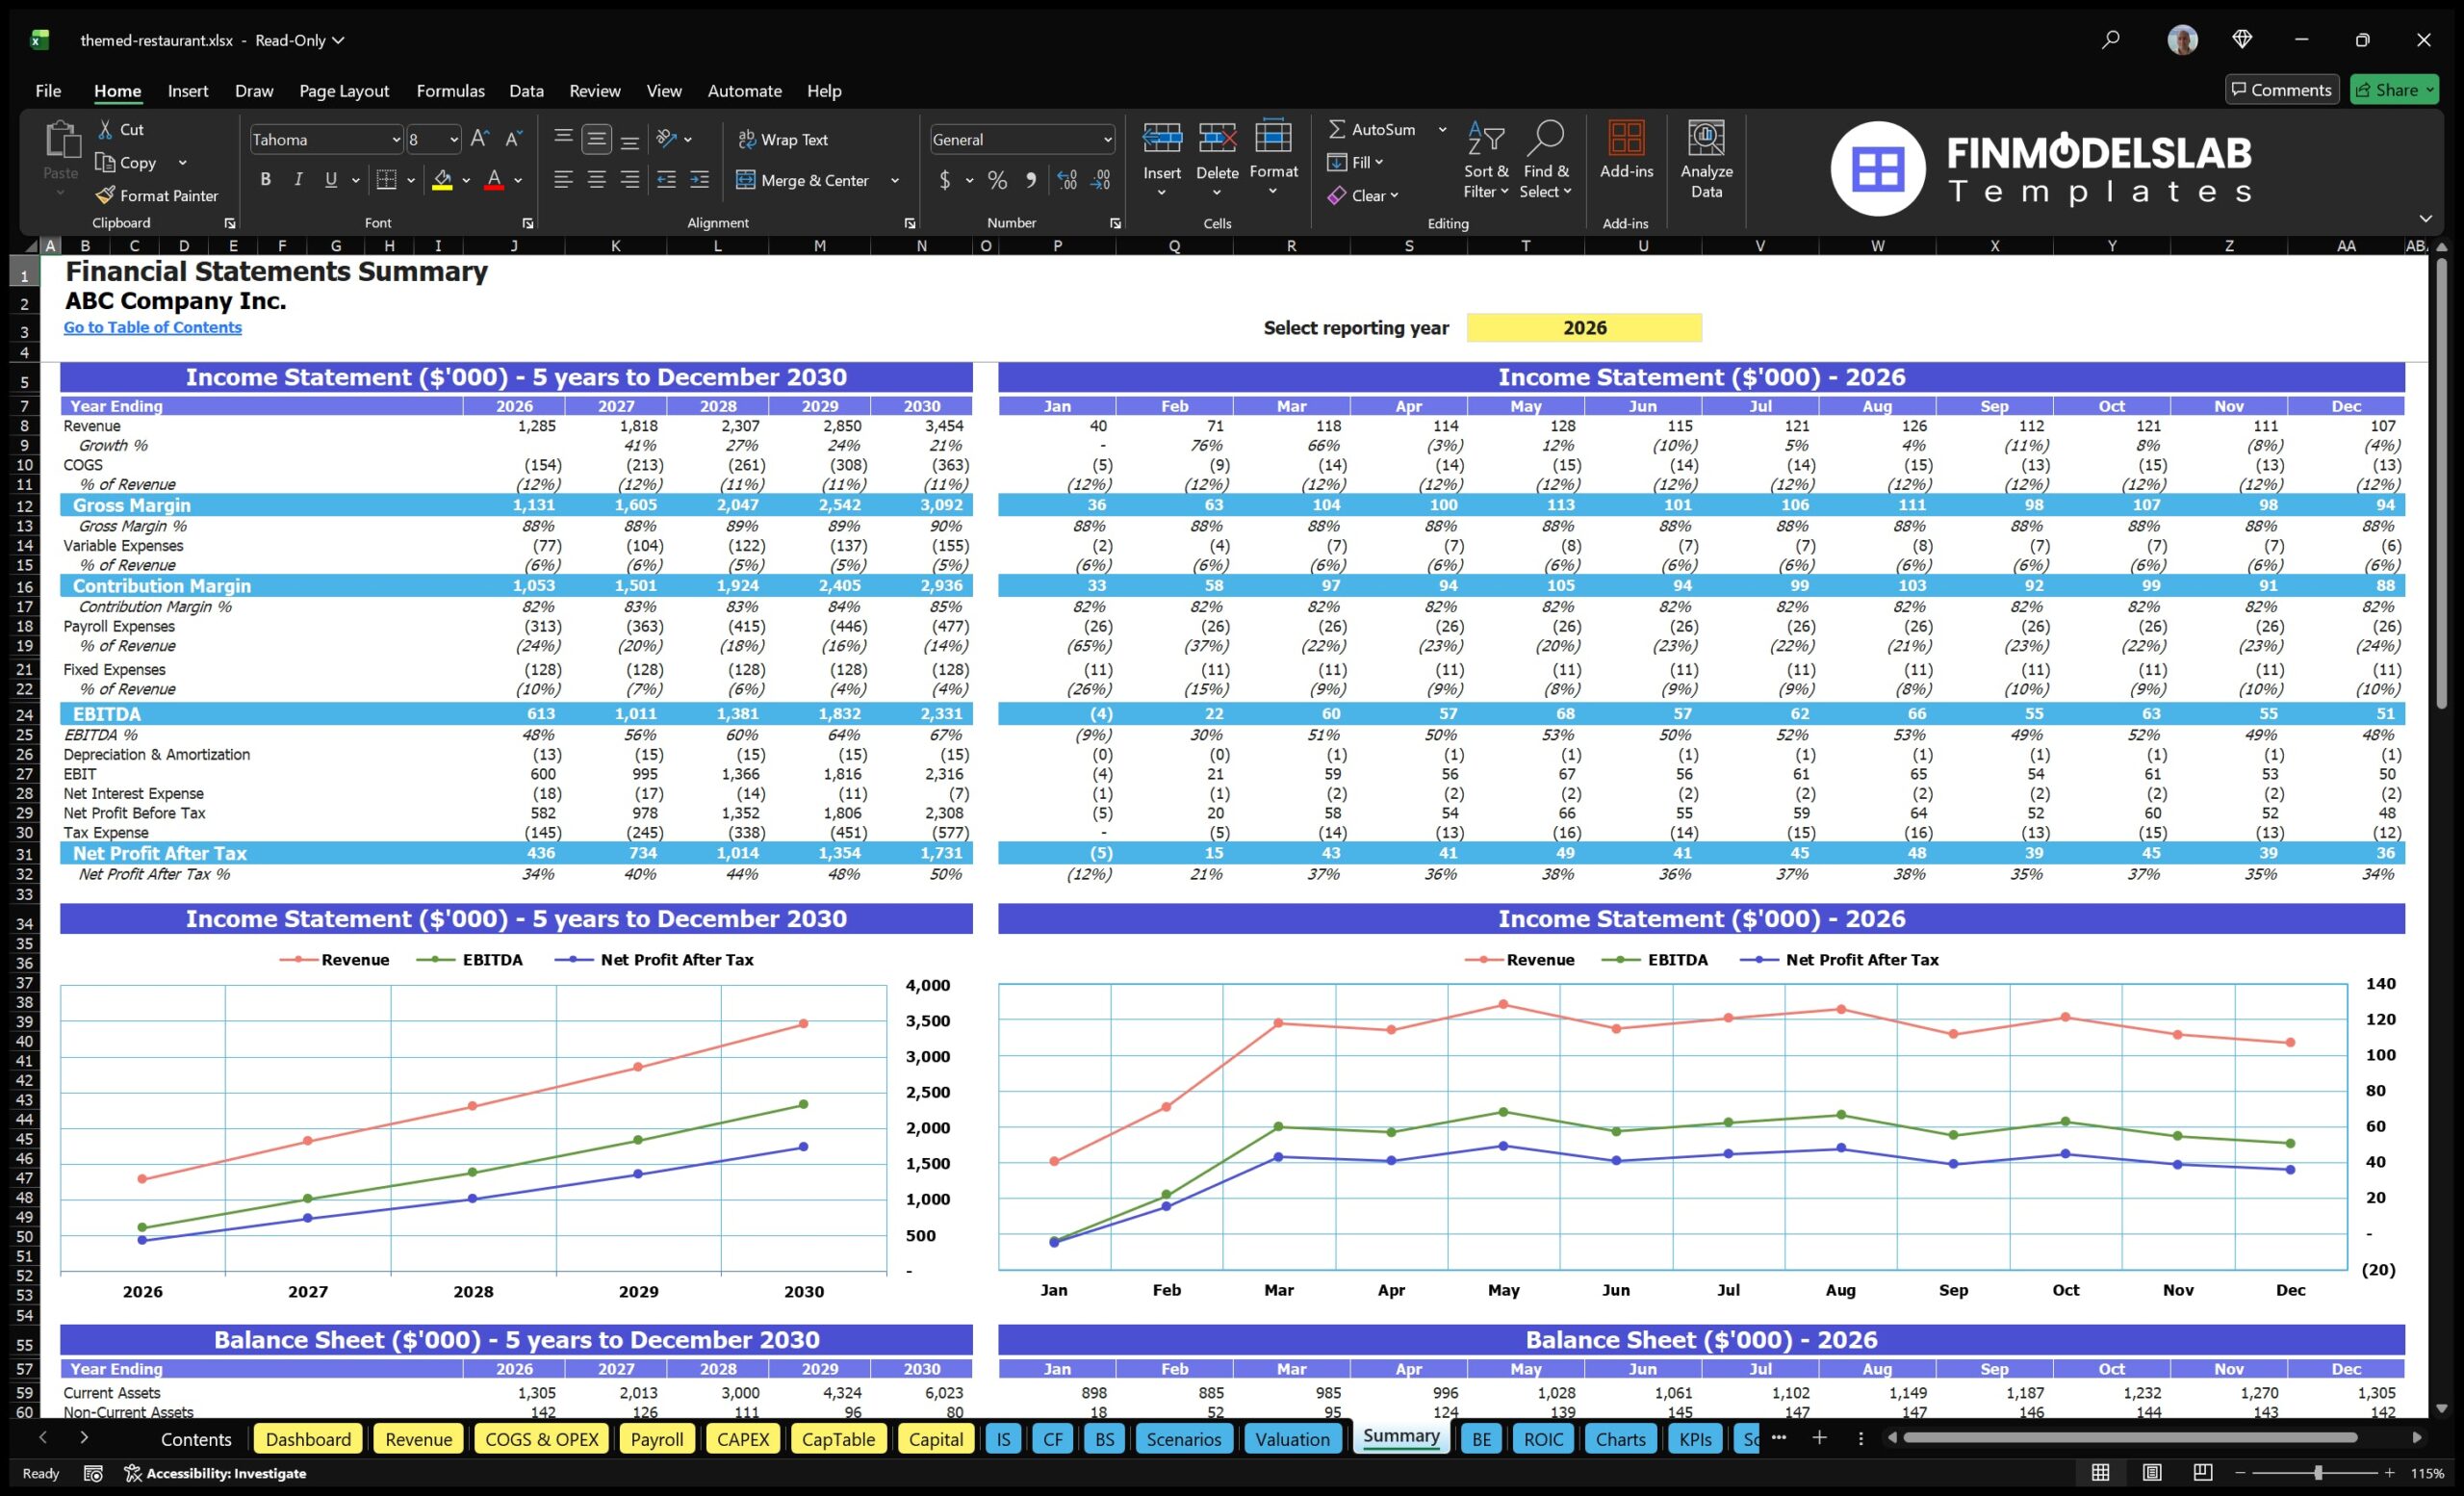
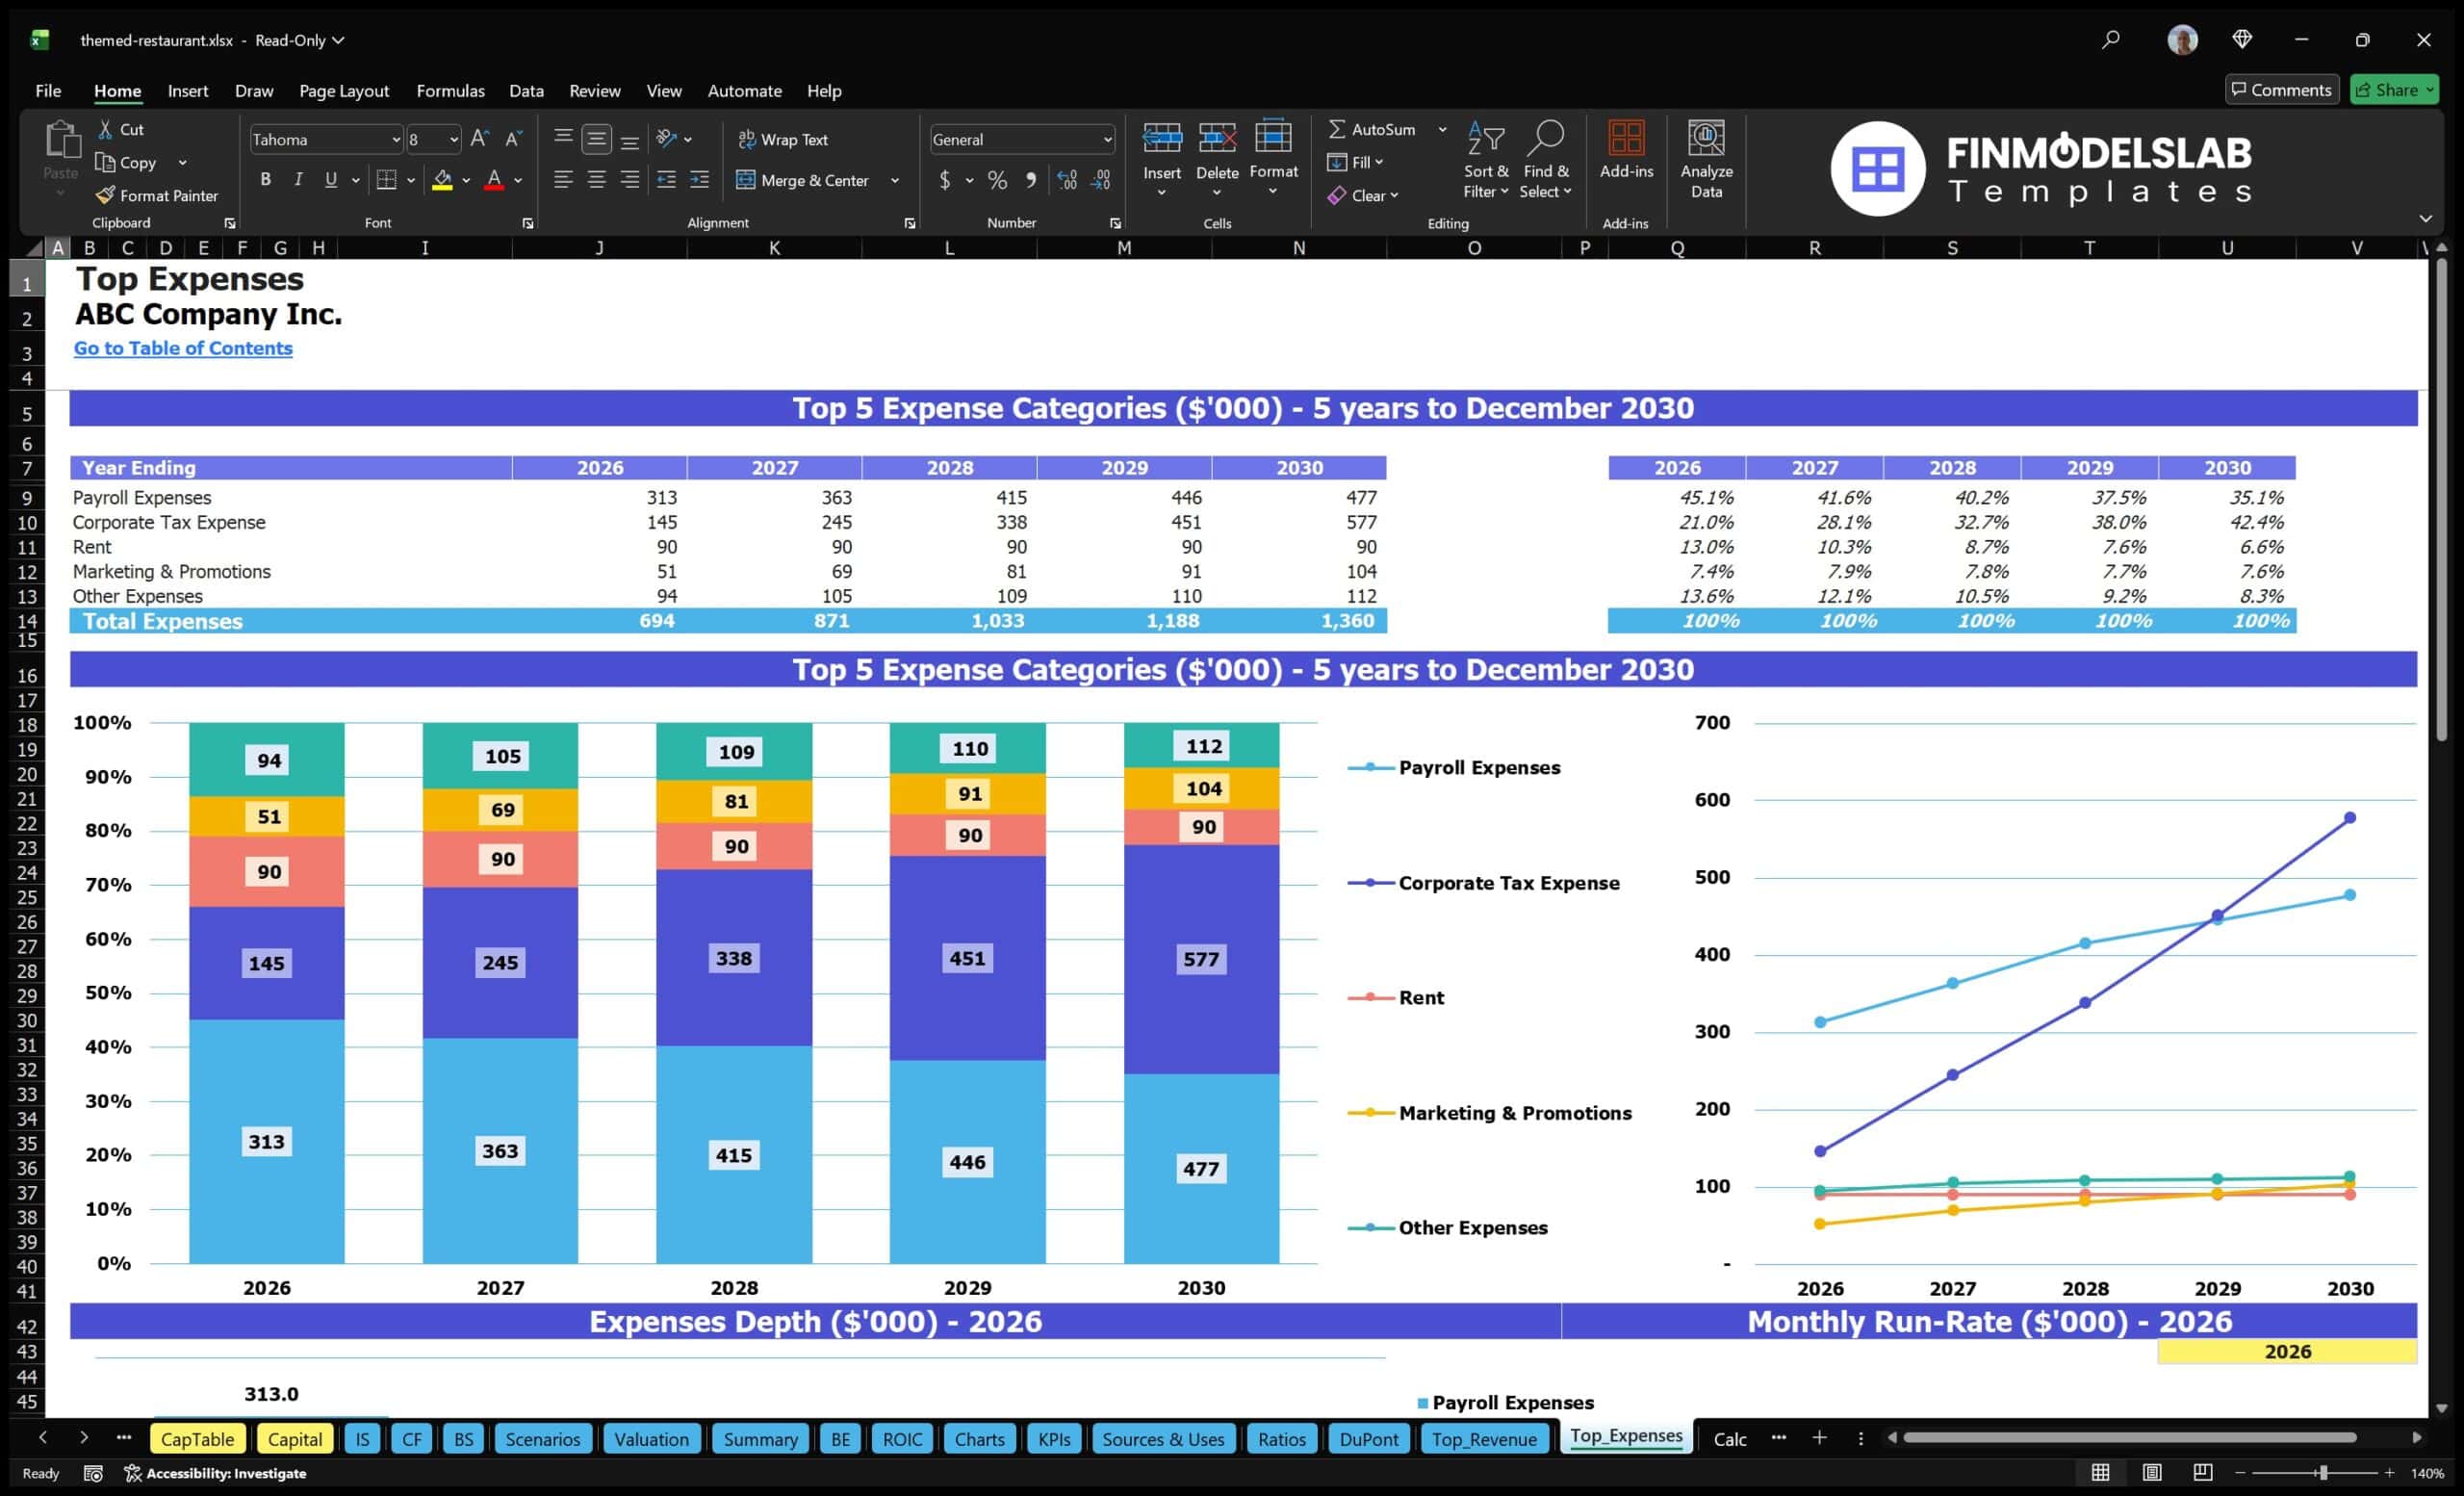
The professional charts component transforms the financial forecast into visual reports that are easier to interpret, share, and present. Instead of relying only on rows of numbers, the template uses charts and graphs to show trends in revenue, profitability, cash flow, expenses, margins, and key performance indicators over time. For a themed restaurant, visual reporting is useful because stakeholders need to see whether the concept is gaining momentum, whether revenue growth supports expansion plans, and whether margins remain healthy as the business scales. Inputs such as sales forecasts, cost assumptions, payroll schedules, capital investment, and scenario selections feed into the chart outputs, allowing users to see how financial performance changes across months and years. These charts can support business plan presentations, investor pitch decks, bank loan discussions, partner meetings, and internal strategy reviews. They also help users identify trends that may be missed in detailed spreadsheets, such as seasonal sales dips, rising labor cost pressure, cash flow gaps, or improving EBITDA margins. By presenting the model in a cleaner visual format, the chart section makes the financial story more accessible to both financial and non-financial audiences.
ROE Components and DuPont Analysis
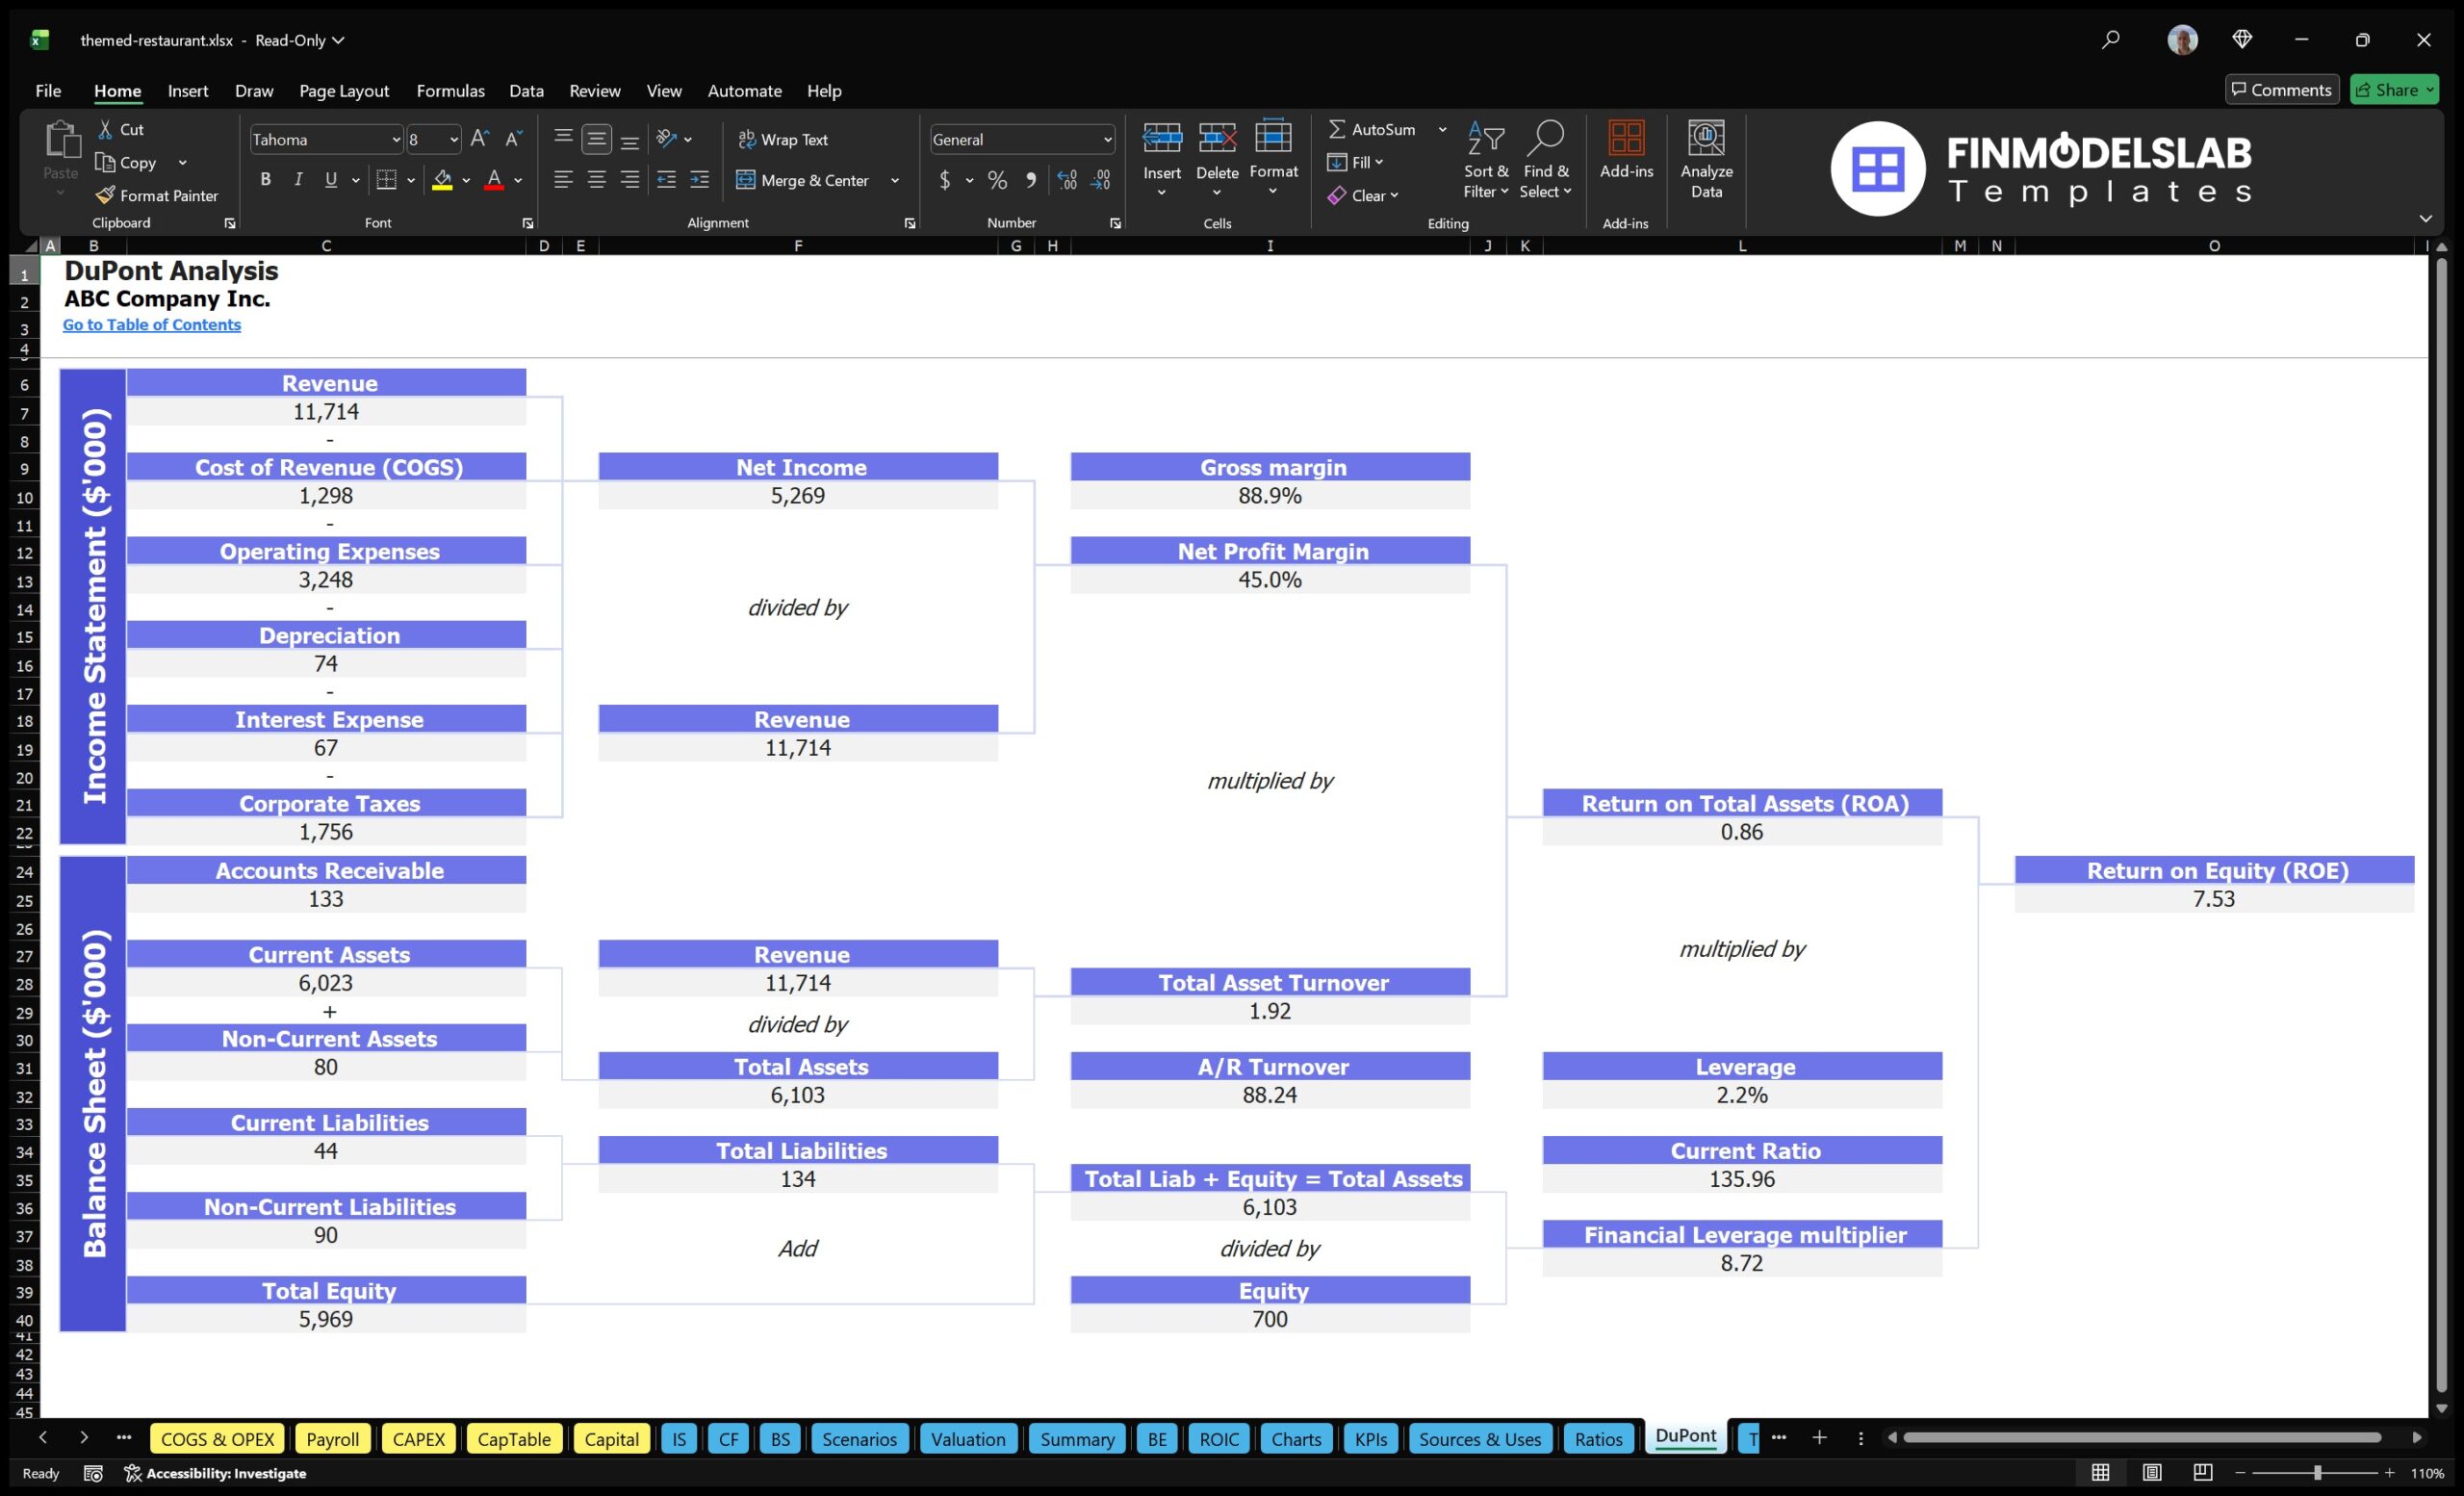
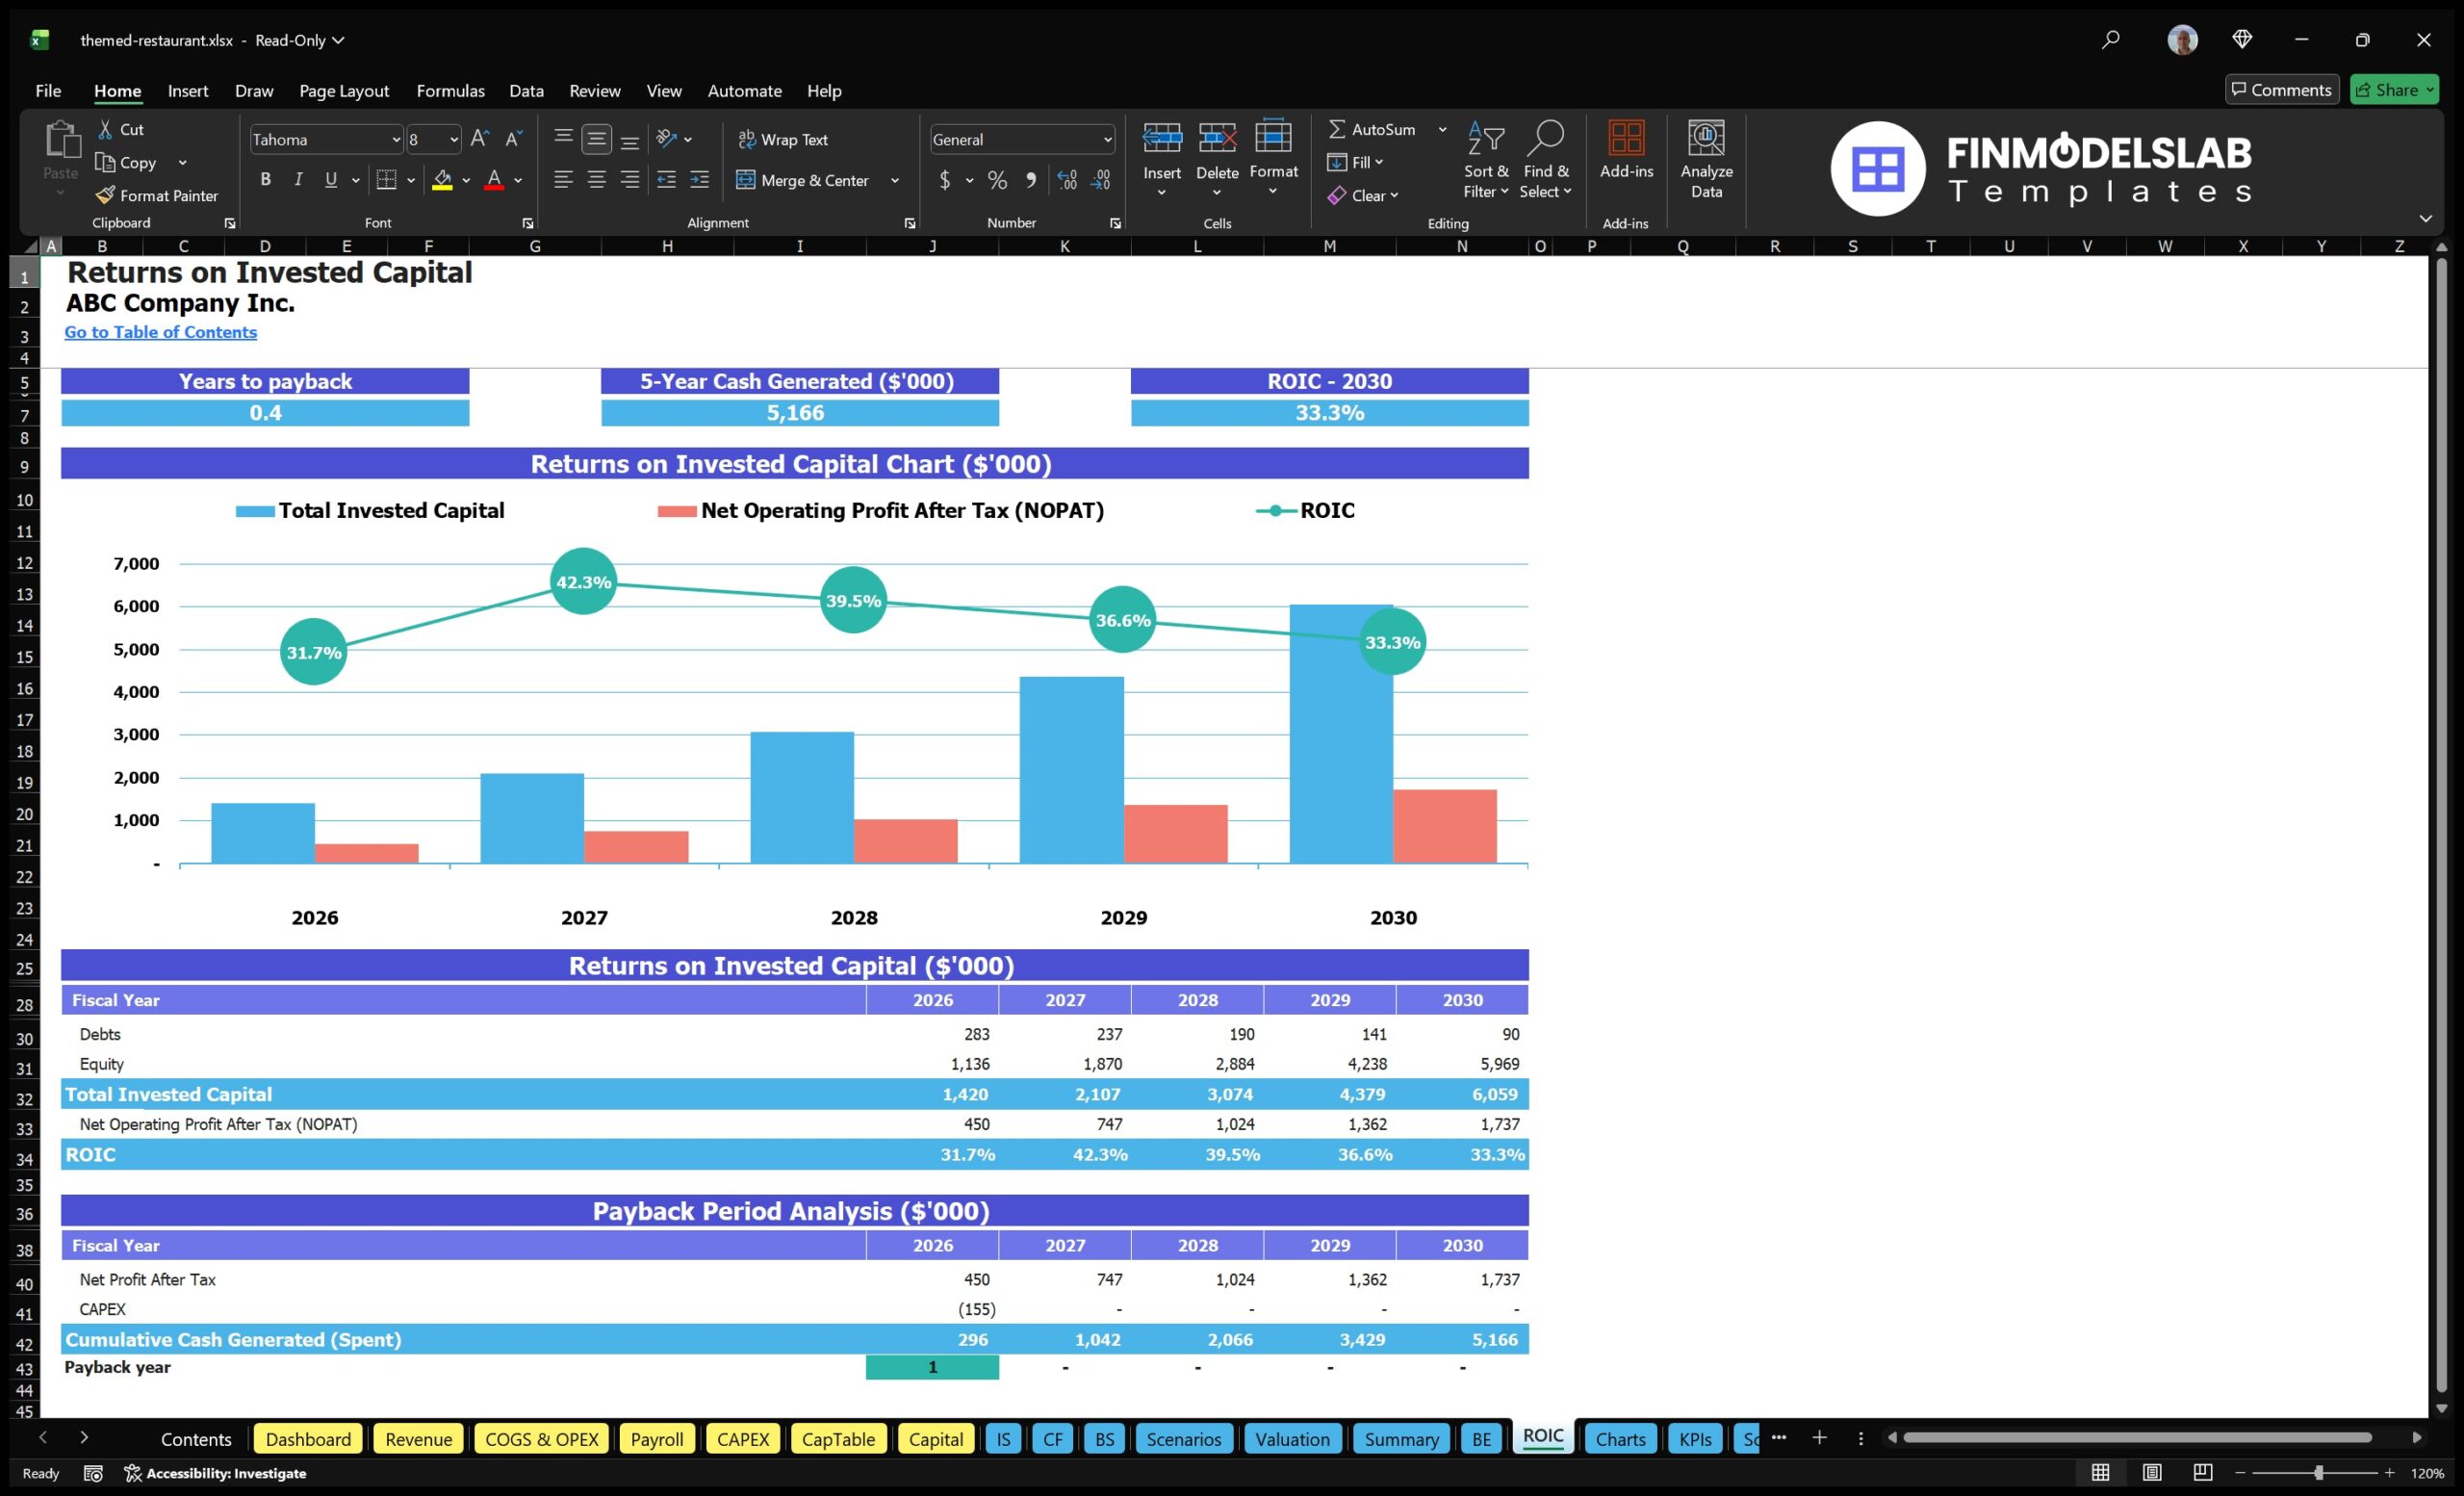
The ROE components and DuPont analysis section helps users understand what is driving return on equity and overall financial performance. Rather than looking only at a single return metric, this component breaks return on equity into underlying drivers such as profitability, asset efficiency, and leverage. For a themed restaurant, this can be especially helpful because the concept may require meaningful investment in interior design, kitchen equipment, entertainment elements, furniture, signage, technology, and working capital. Users can evaluate whether projected returns are being driven by strong net margins, efficient use of assets, appropriate financing structure, or a combination of these factors. Inputs from the profit and loss statement, balance sheet, investment assumptions, and financing structure flow into the analysis to generate return indicators that are useful for owners and investors. This section can reveal whether the restaurant is producing attractive returns because operations are genuinely profitable or because the capital structure is heavily leveraged. It also helps users assess whether changes in pricing, food cost control, labor efficiency, or capital expenditure could improve returns. For investor discussions, DuPont-style analysis adds credibility because it shows a deeper understanding of the mechanics behind financial performance, not just the final profit number.
Revenue Inputs
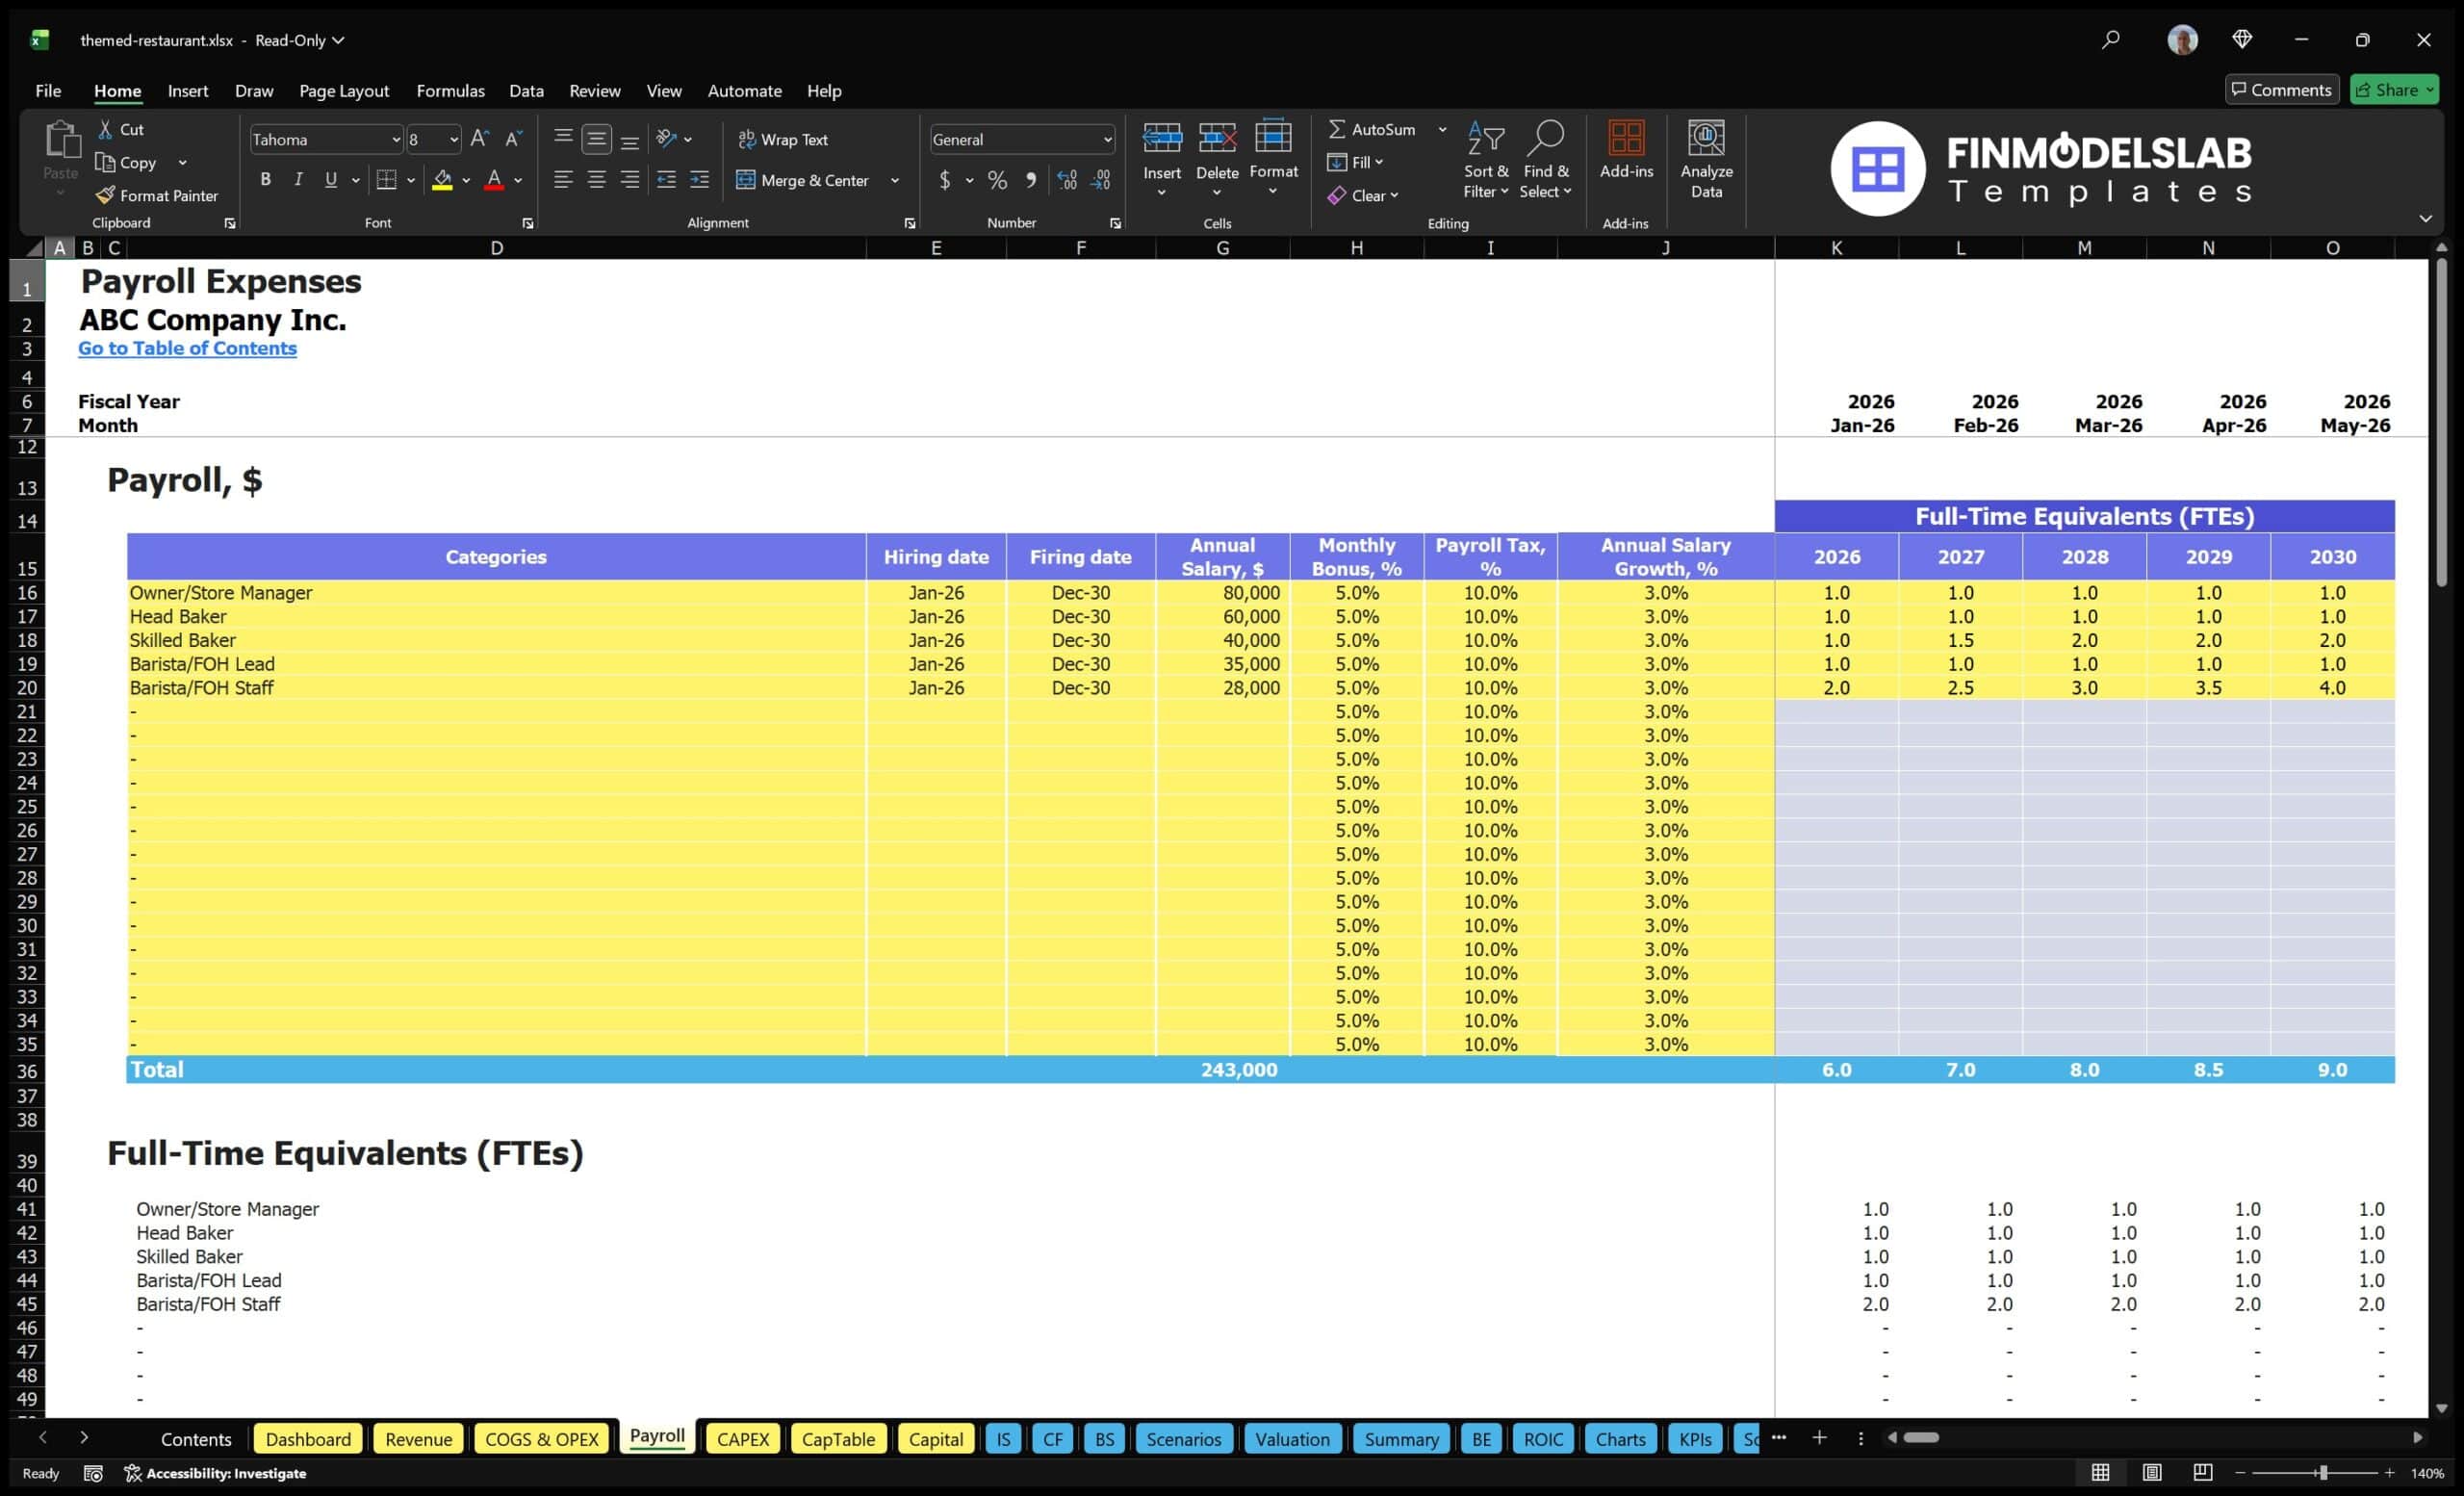
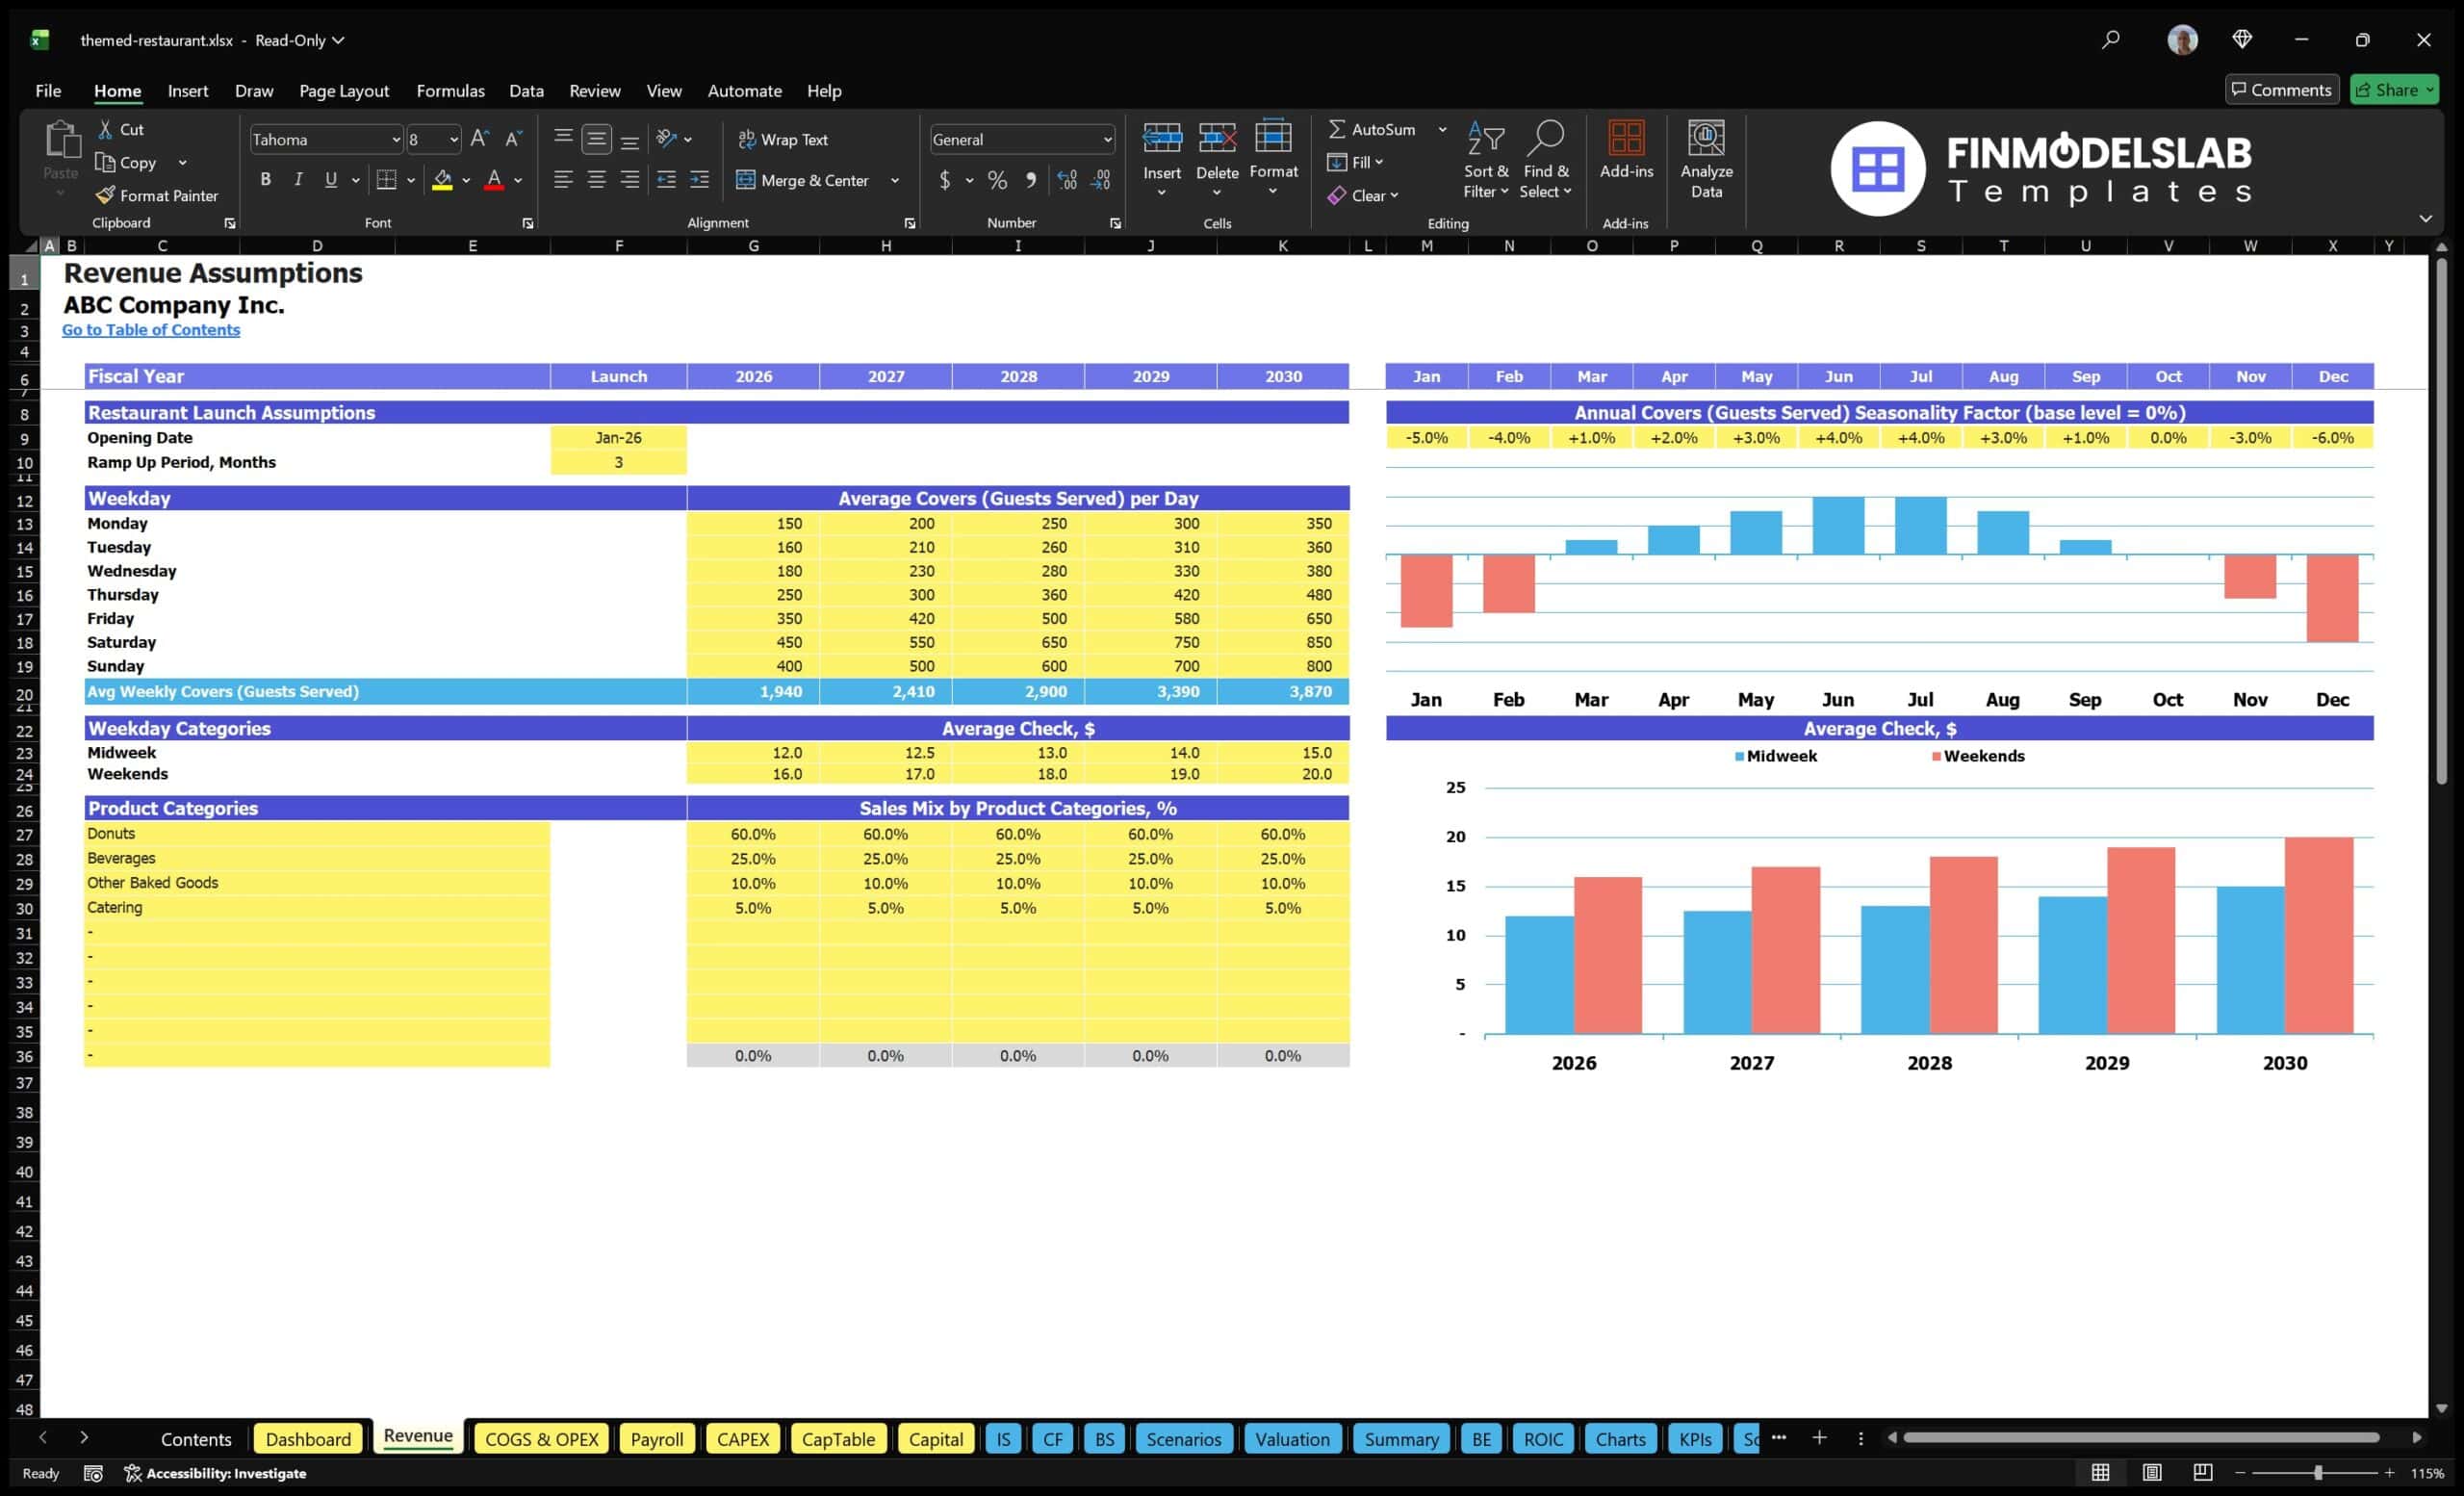
The revenue inputs section is where users define the commercial engine of the themed restaurant. This component allows users to enter and adjust the assumptions that drive sales, such as daily covers, weekday traffic, weekend traffic, average check size, menu category mix, beverage sales, baked goods or specialty food sales, catering revenue, event-related sales, and expected growth over time. A themed restaurant may experience different demand patterns depending on the day of the week, the strength of the concept, tourist or local traffic, marketing campaigns, seasonality, special events, and customer experience. By separating these drivers, the model helps users build a more realistic revenue forecast than a simple flat monthly sales estimate. Outputs from the revenue inputs section flow into the revenue forecast, profit and loss statement, cash flow statement, KPI dashboard, and scenario analysis. This makes it possible to test questions such as how many customers are needed per day, what average check is required to reach profitability, how much catering contributes to total sales, and how menu mix affects gross margin. The section is useful for validating the business plan, setting sales targets, planning capacity, designing marketing campaigns, and explaining revenue assumptions to lenders or investors.
Bank-Ready Reports
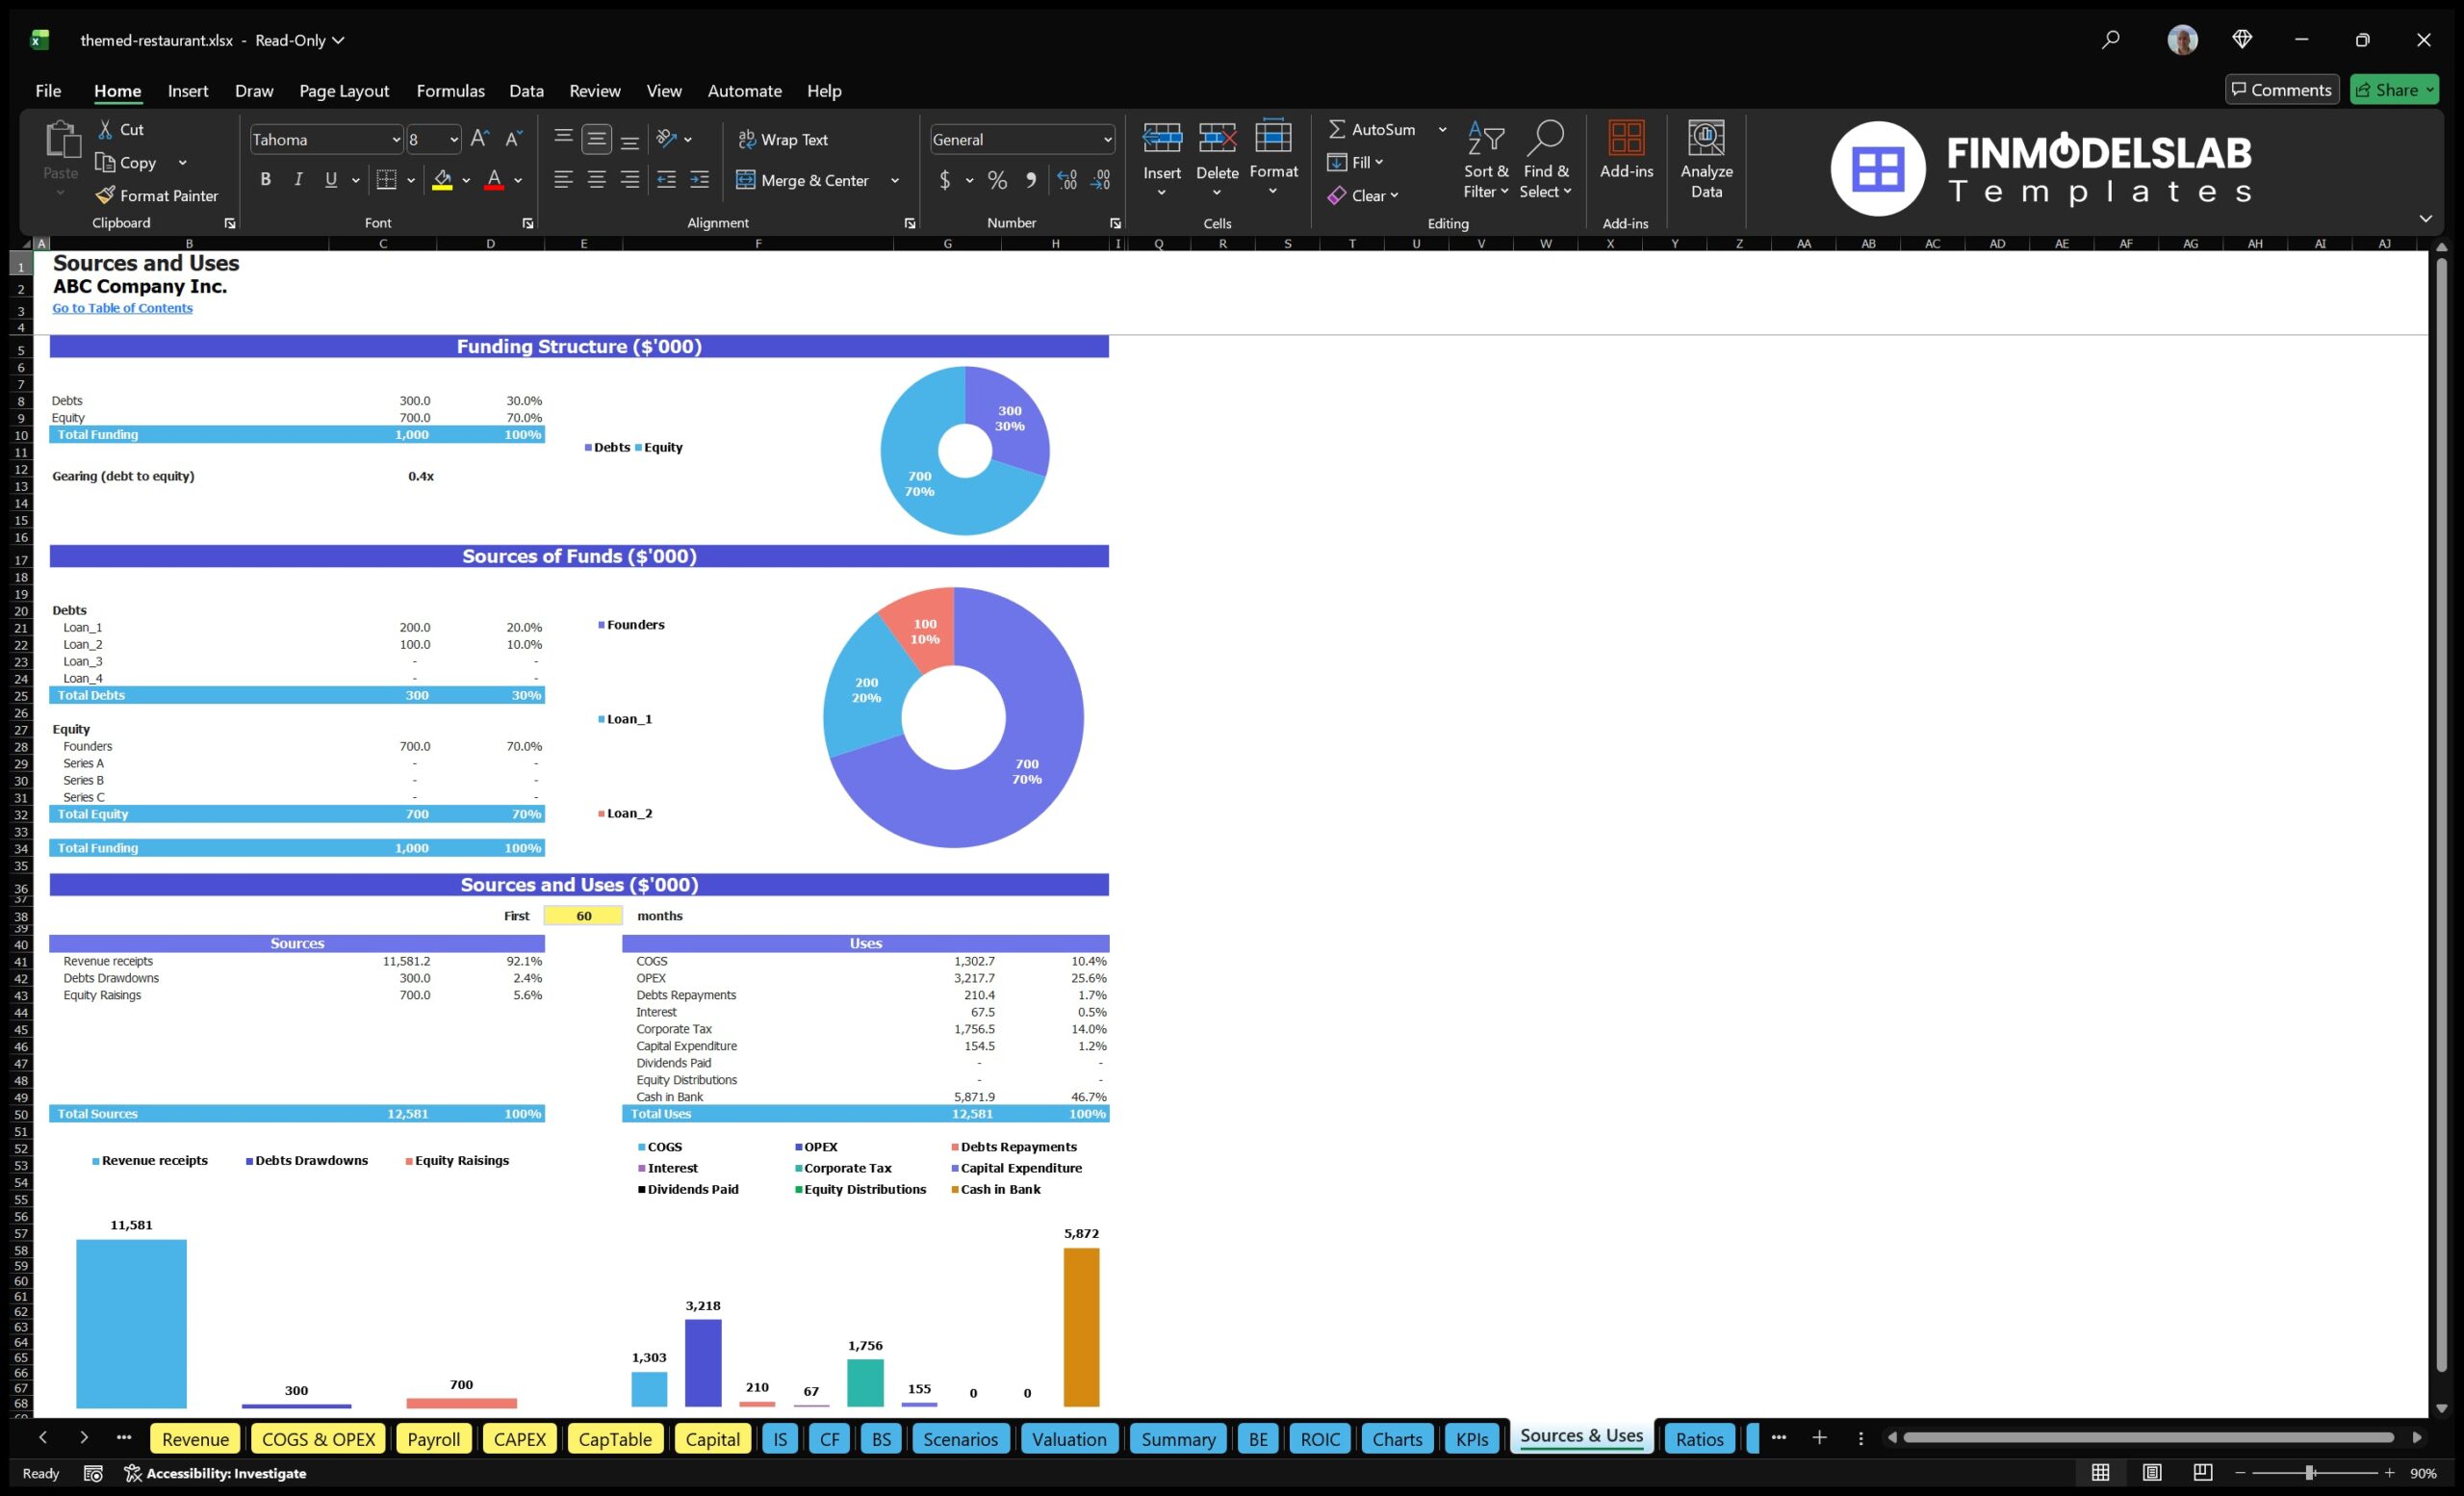
The bank-ready reports component provides organized financial outputs that can support loan applications, funding requests, stakeholder reviews, and formal business planning. Restaurants often need to present more than a revenue forecast when seeking financing, and this section helps package the model into lender-friendly reporting such as profit and loss summaries, cash flow forecasts, balance sheet projections, investment requirements, debt service considerations, and financial performance indicators. The reports draw from the user’s assumptions for startup costs, revenue, expenses, payroll, financing, capital expenditures, and operating performance to produce structured outputs that are easier for external reviewers to understand. For a themed restaurant, these reports help demonstrate whether the concept can generate enough cash to cover operating expenses, repay debt, maintain liquidity, and reach sustainable profitability. They can also show the expected timing of cash needs, the impact of startup investment, and the forecasted path from launch to stabilization. This is useful because banks and funding partners typically want clear evidence that the business has been planned carefully and that assumptions are documented. The bank-ready reporting section helps users move from informal planning to a more professional financial package that can be attached to a business plan or used in financing conversations.
Revenue Breakdown
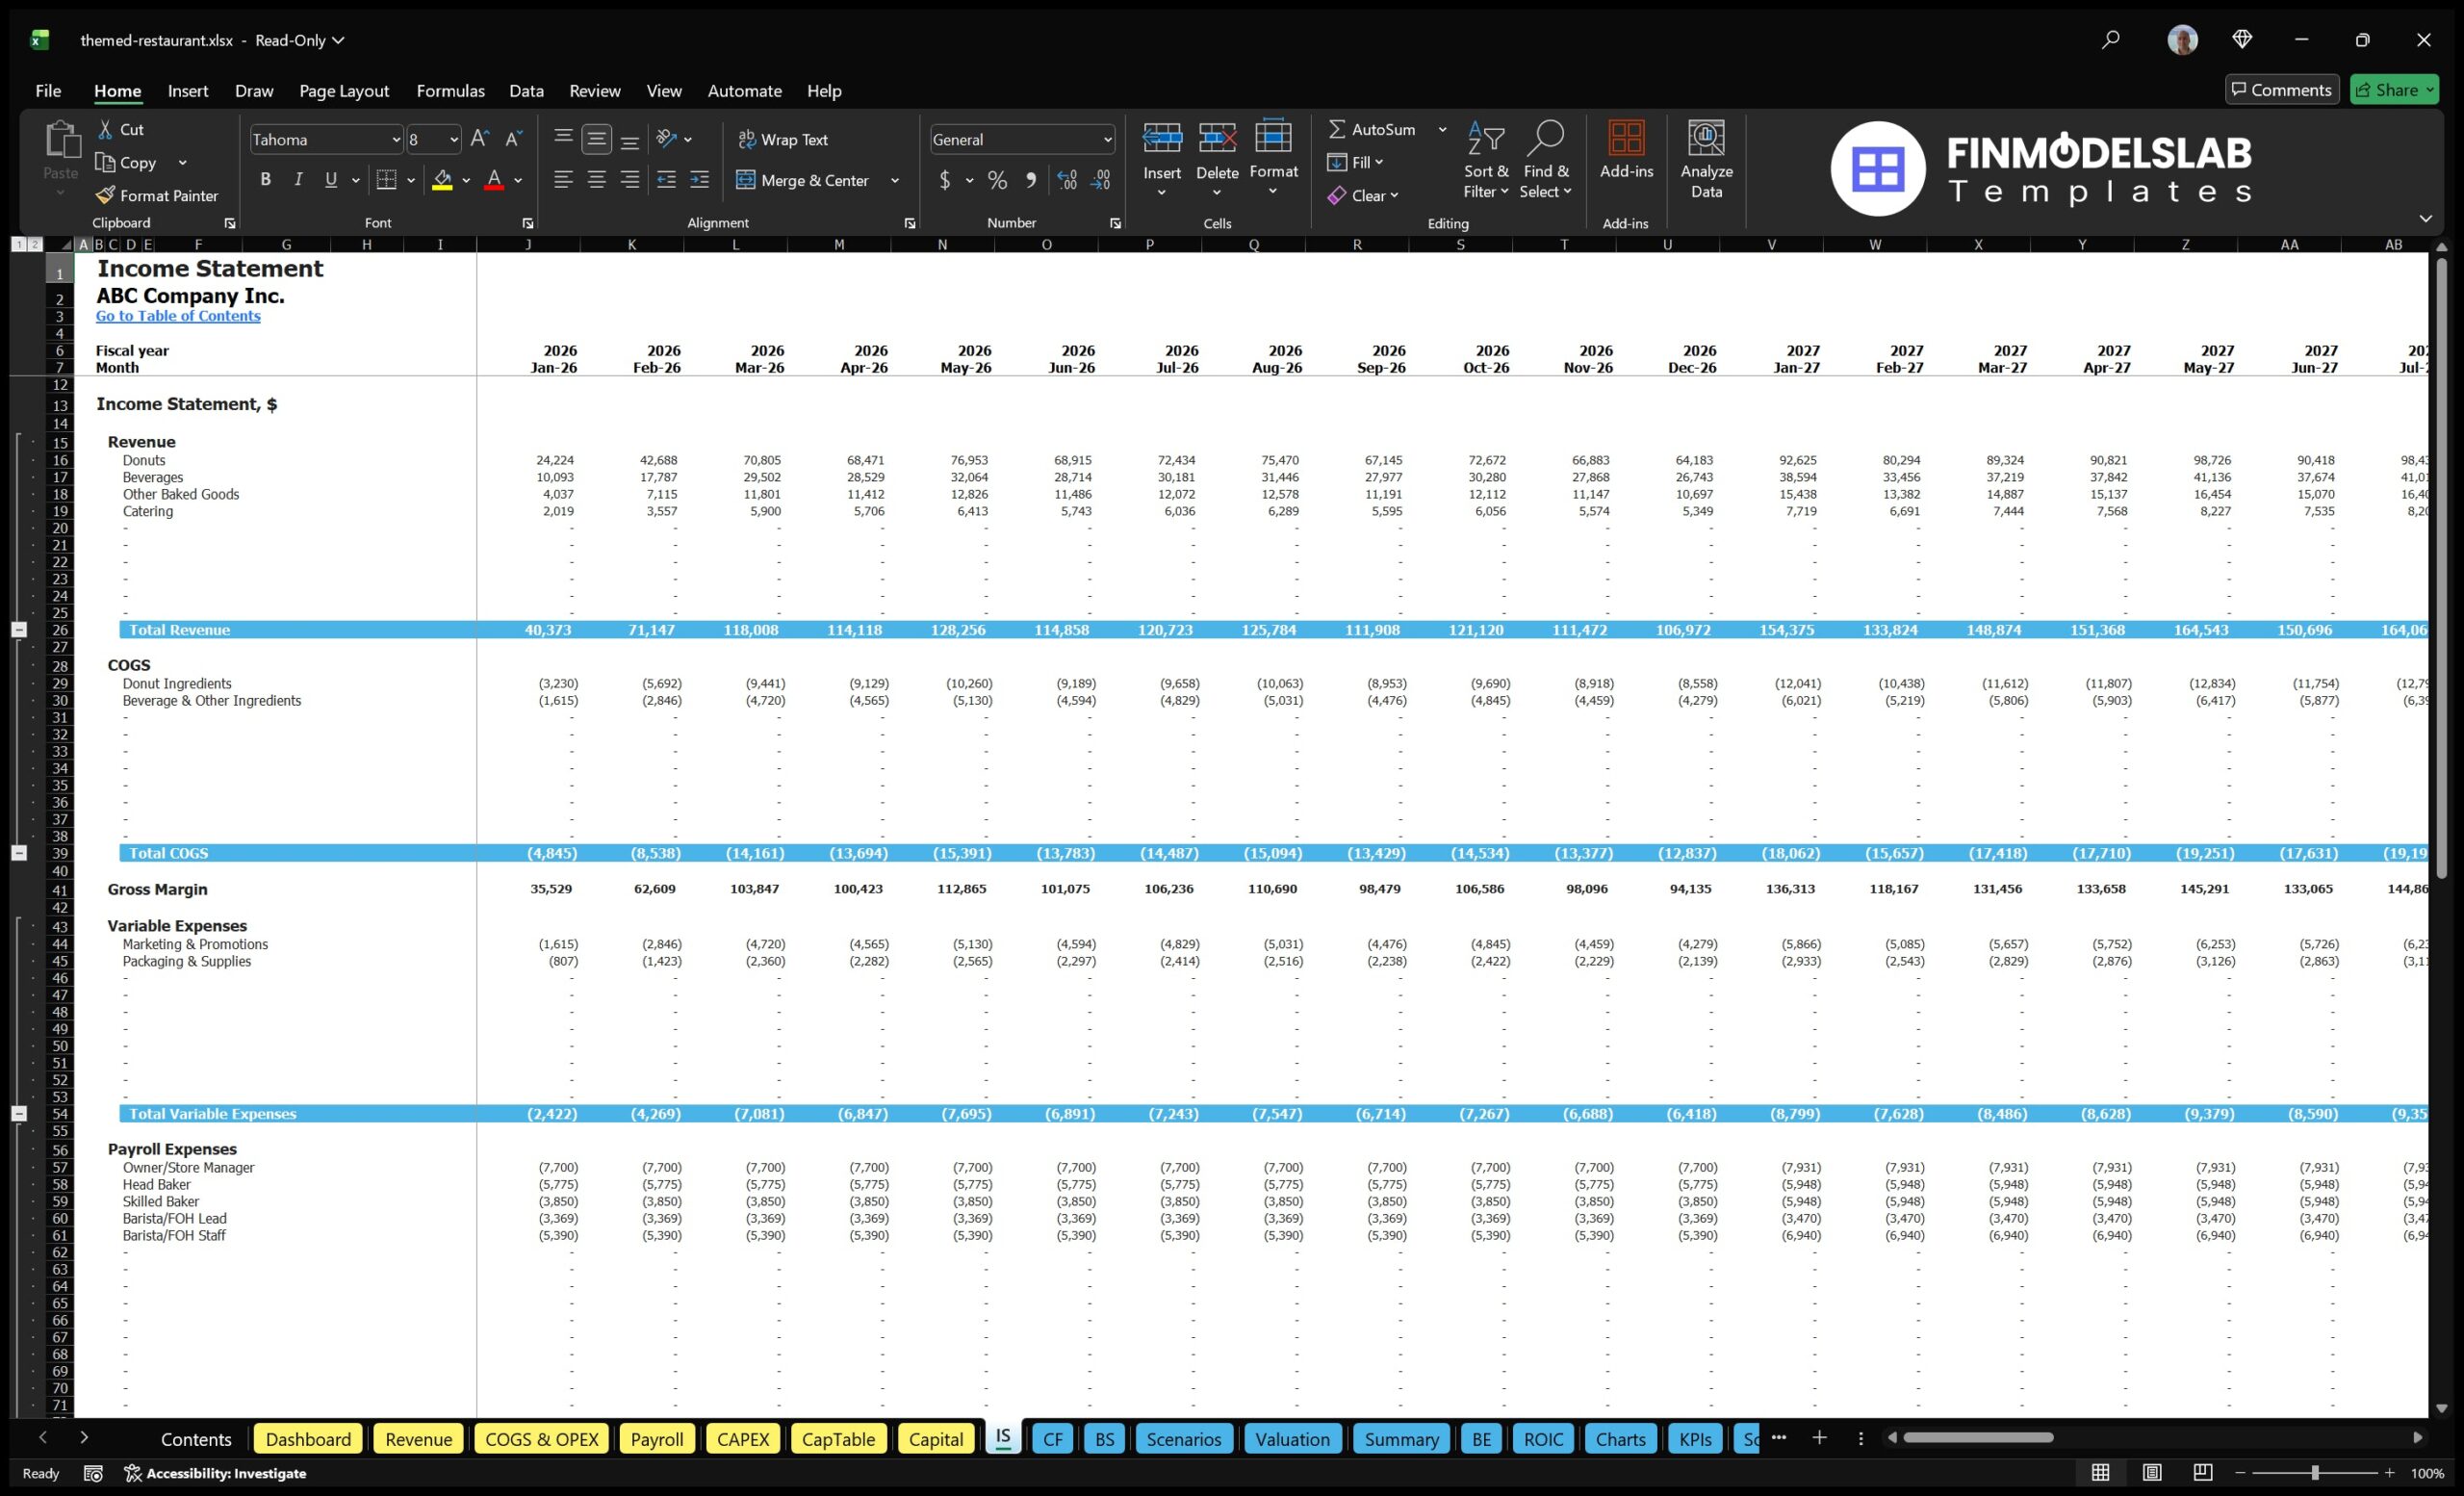
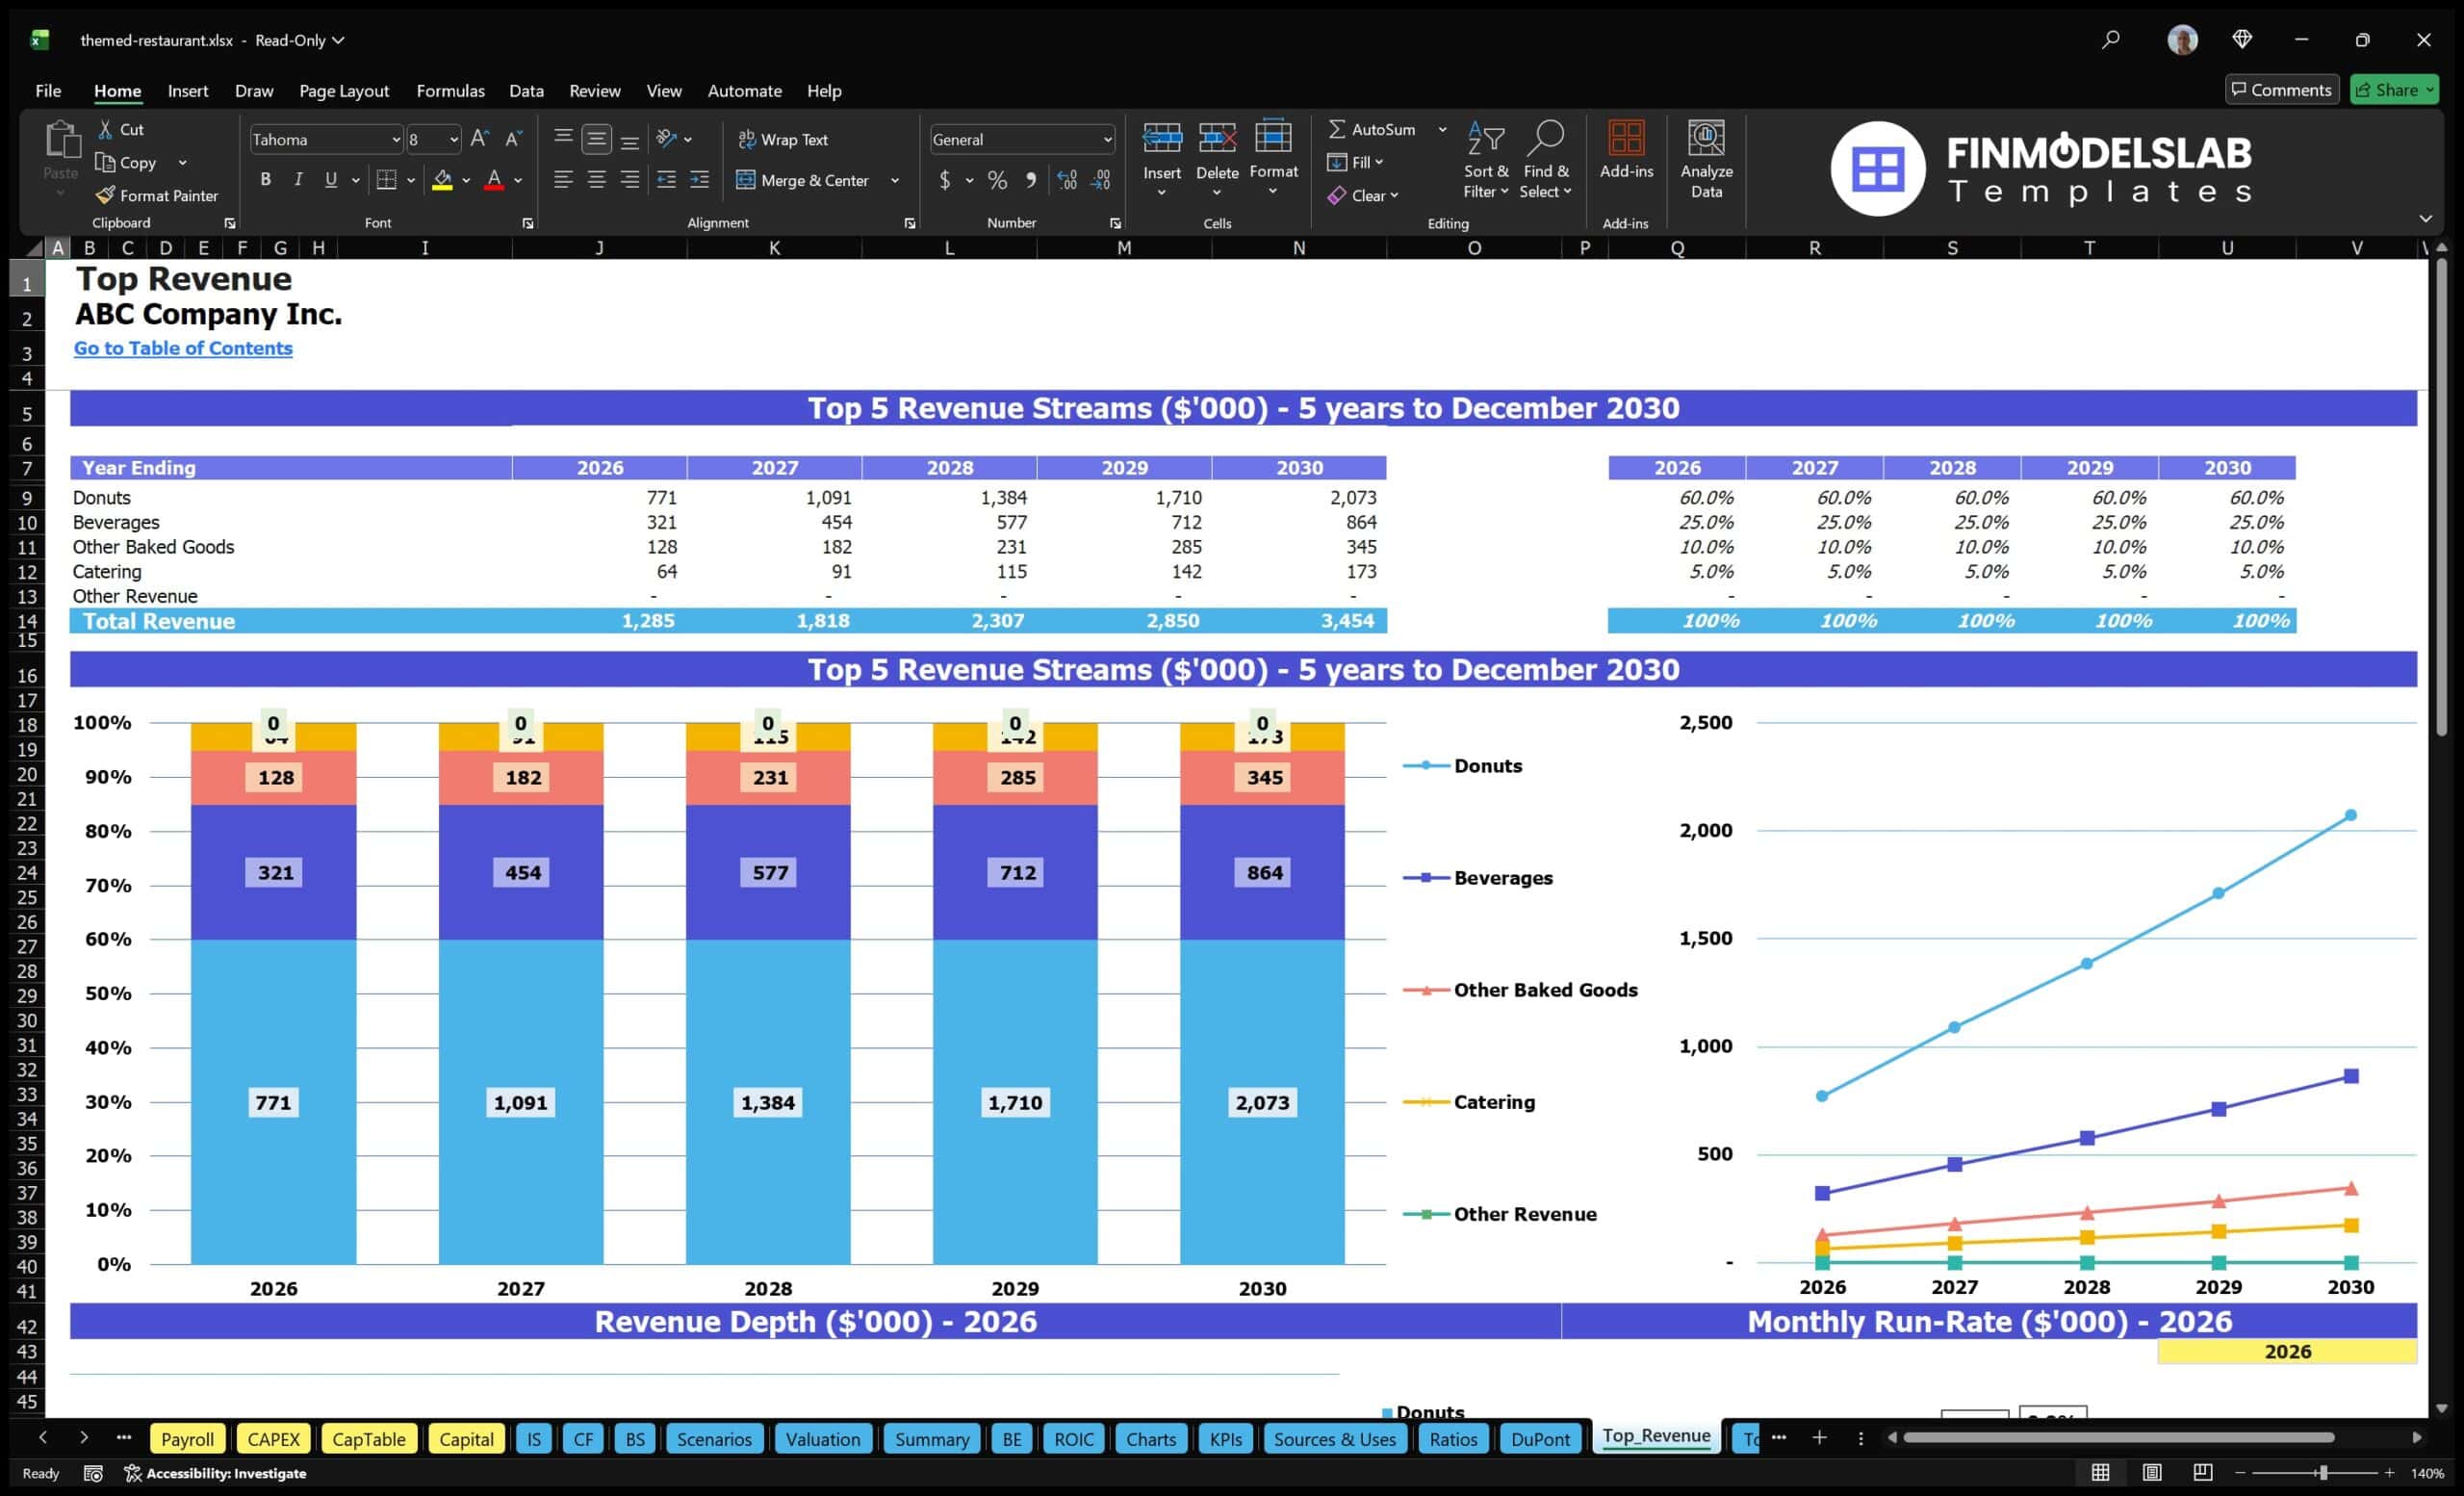
The revenue breakdown section gives users a detailed view of how total sales are generated across different revenue streams. Instead of treating restaurant income as one number, the model can separate categories such as core food sales, beverages, specialty menu items, desserts or baked goods, catering, private events, merchandise, promotions, or other concept-specific revenue lines. This is important for a themed restaurant because the business may rely on a unique mix of dine-in sales, premium experiences, branded products, group bookings, or event-driven demand. Users can enter assumptions for the percentage of sales by category, price levels, customer volumes, and growth patterns, then review how each stream contributes to total revenue and gross margin. The outputs help identify which categories are most important to profitability and which may need stronger marketing, pricing changes, or operational attention. For example, a high-margin beverage program or catering line may improve overall profitability even if core food margins are under pressure. This section also supports menu planning and strategic decision-making because it shows whether the restaurant is too dependent on one sales channel or whether additional revenue streams can improve stability. For investors and operators, the revenue breakdown provides transparency into the business model and helps explain how the concept will generate income over time.
KPI Dashboard
The KPI dashboard focuses on performance metrics that help users monitor whether the themed restaurant is operating in line with expectations. It may include indicators such as revenue growth, gross profit margin, EBITDA margin, net profit margin, cash balance, average check, customer traffic, cost of goods sold percentage, payroll as a percentage of revenue, return on equity, payback period, and other restaurant-specific benchmarks. These metrics are generated from the model’s revenue assumptions, cost structure, staffing plan, capital investment, and financial statements. For a themed restaurant, KPI tracking is essential because strong sales alone do not guarantee a healthy business if labor costs are too high, food waste is excessive, marketing spend is inefficient, or cash reserves are shrinking. The KPI dashboard helps users compare actual or forecasted performance against targets and industry benchmarks, making it easier to spot issues early. It also helps communicate performance to stakeholders in a concise way, especially when preparing monthly reviews, board updates, investor reports, or funding presentations. By consolidating operational and financial indicators into one view, this component supports better decision-making around pricing, staffing, procurement, marketing, expansion timing, and cost control.
Startup Cost Breakdown
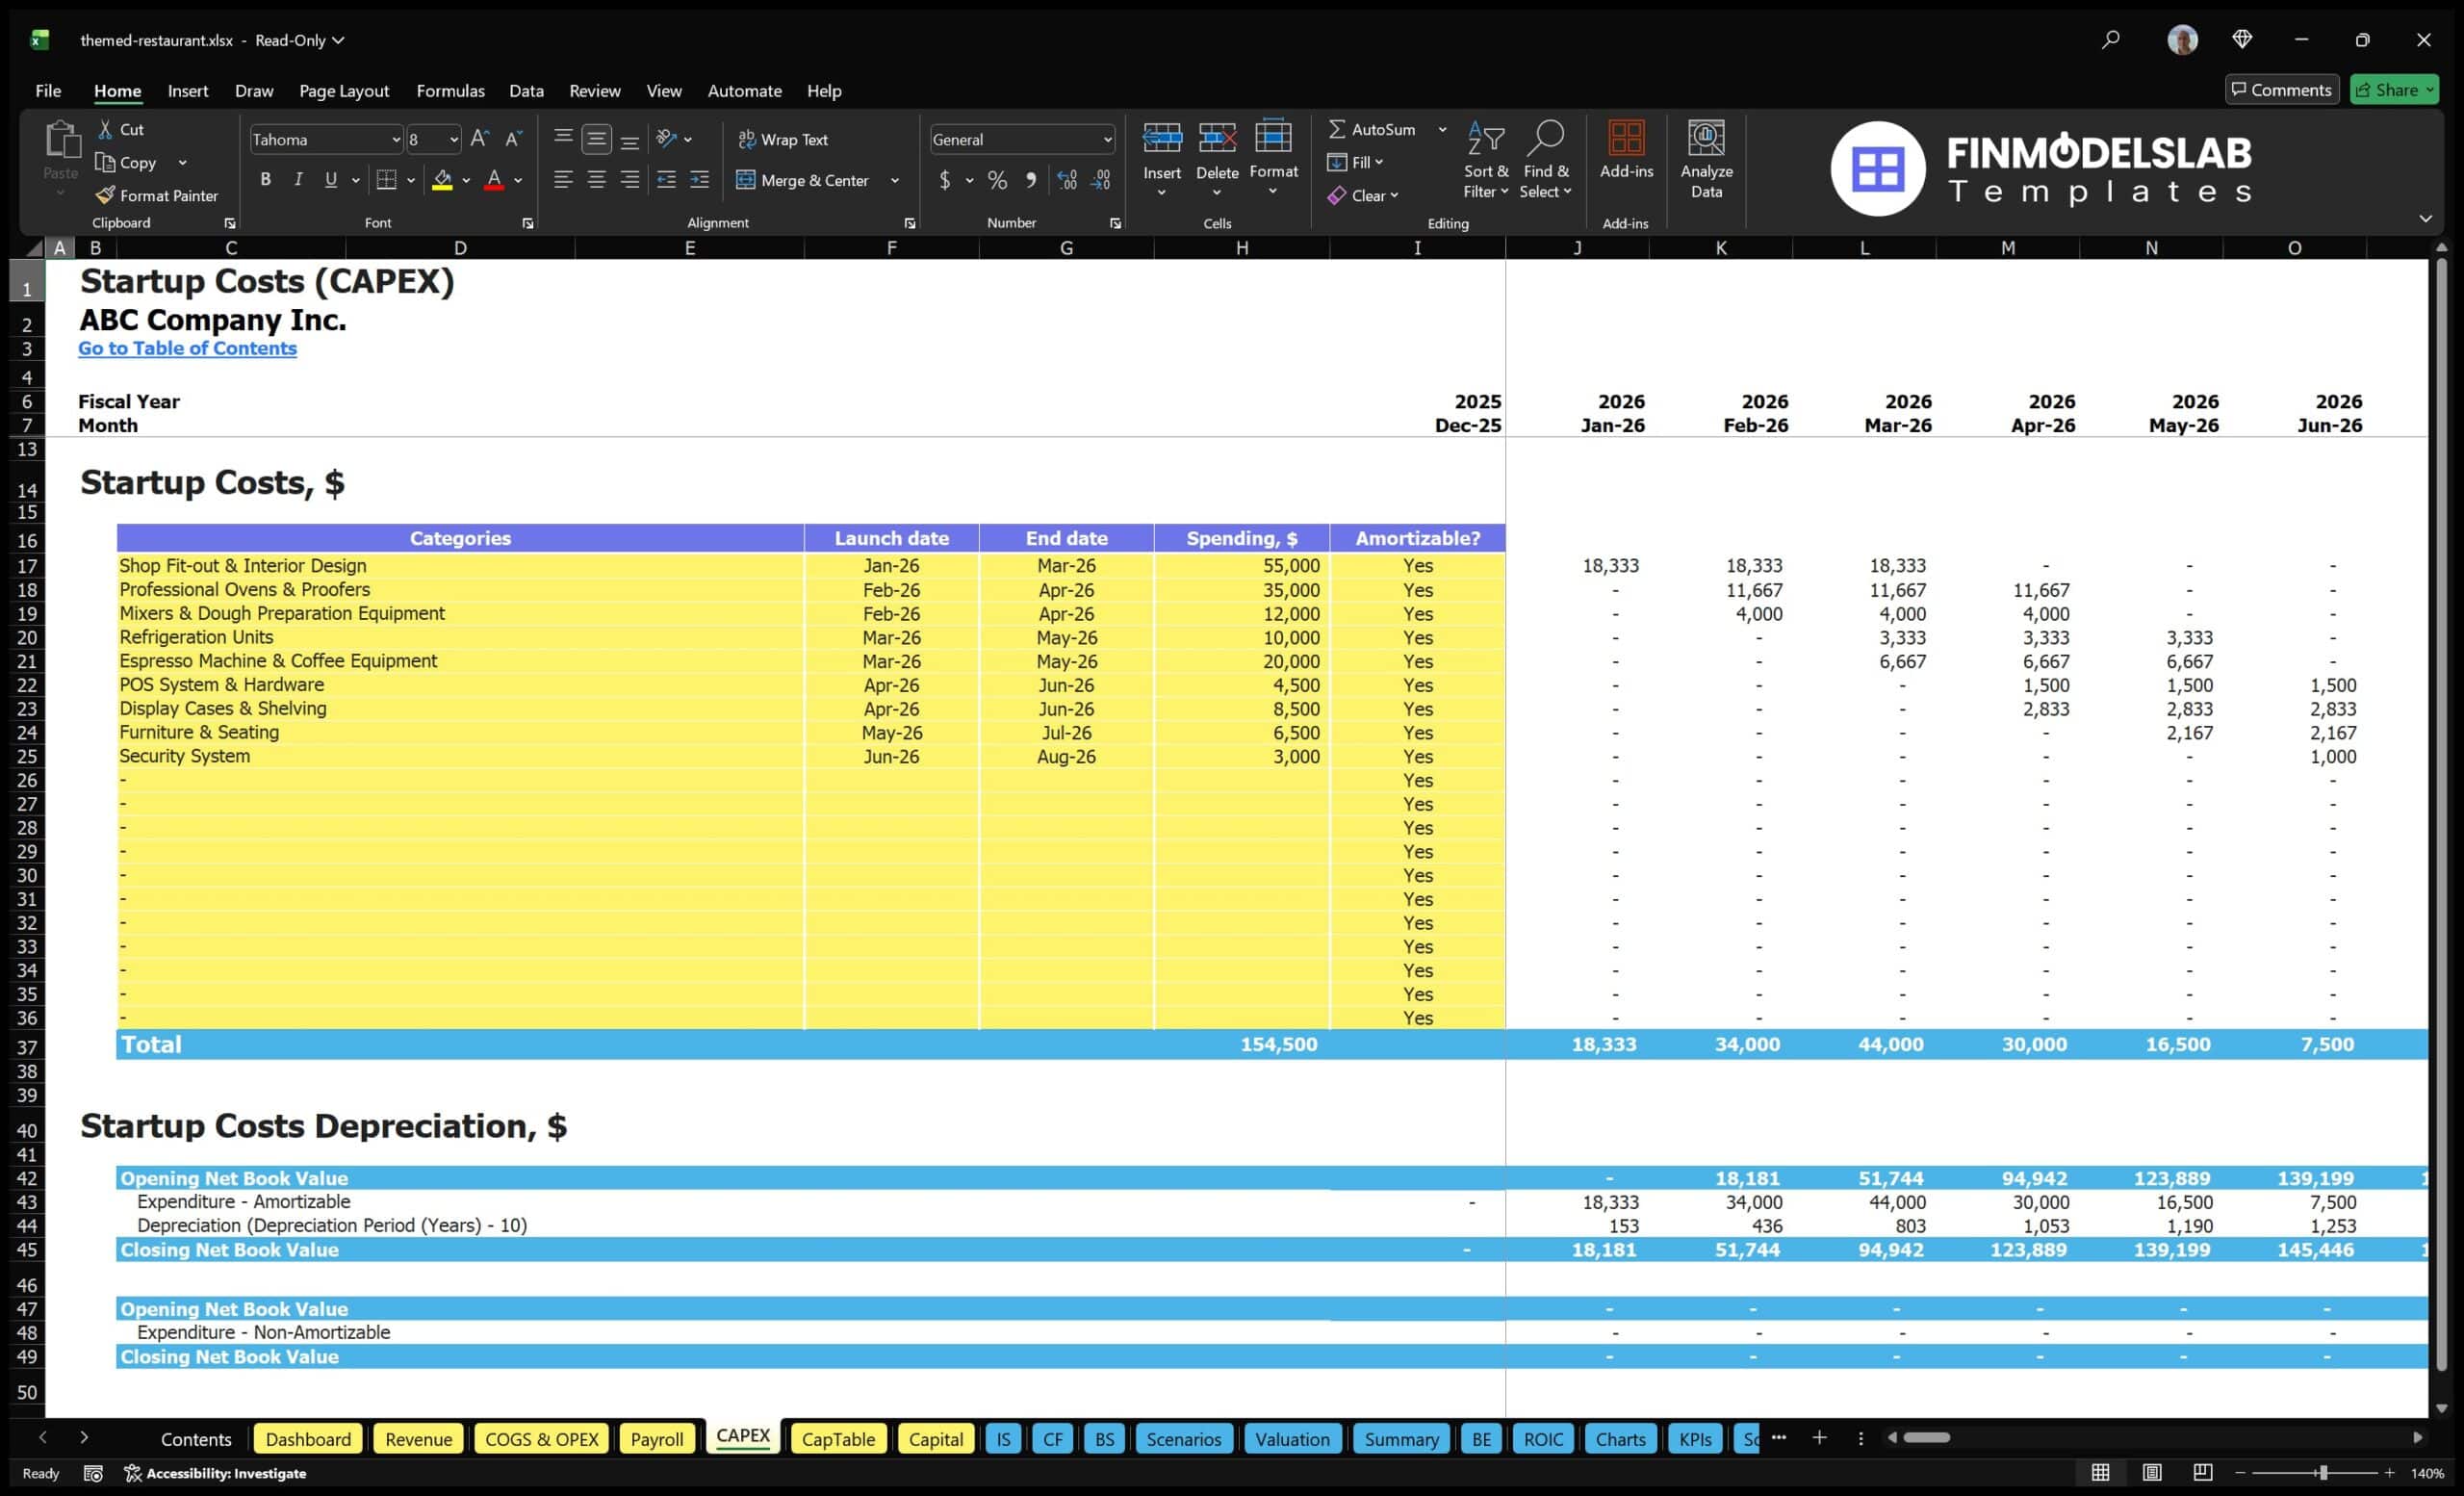
The startup cost breakdown section organizes the initial investment required to open or expand the themed restaurant. This component may include assumptions for lease deposits, interior design, themed décor, shop fit-out, kitchen equipment, ovens, refrigeration, coffee or beverage equipment, furniture, point-of-sale systems, signage, licenses, permits, professional fees, pre-opening payroll, launch marketing, initial inventory, insurance, security systems, and working capital reserves. The purpose is to help users understand how much funding is needed before revenue begins and to avoid underestimating the cash required to reach opening day. Outputs from this section can feed into the balance sheet, cash flow forecast, funding plan, depreciation schedule, and investor reporting. For a themed restaurant, startup costs can be higher or more specialized than a basic food service operation because the guest experience may require custom design, immersive features, branded fixtures, or entertainment-related assets. This section helps users separate one-time capital expenditures from recurring operating expenses, making the financial plan clearer and more credible. It is useful for budgeting, fundraising, loan applications, investor discussions, and launch planning because it shows exactly where capital will be spent and how much cash should be available to support early operations.
Break-Even Analysis
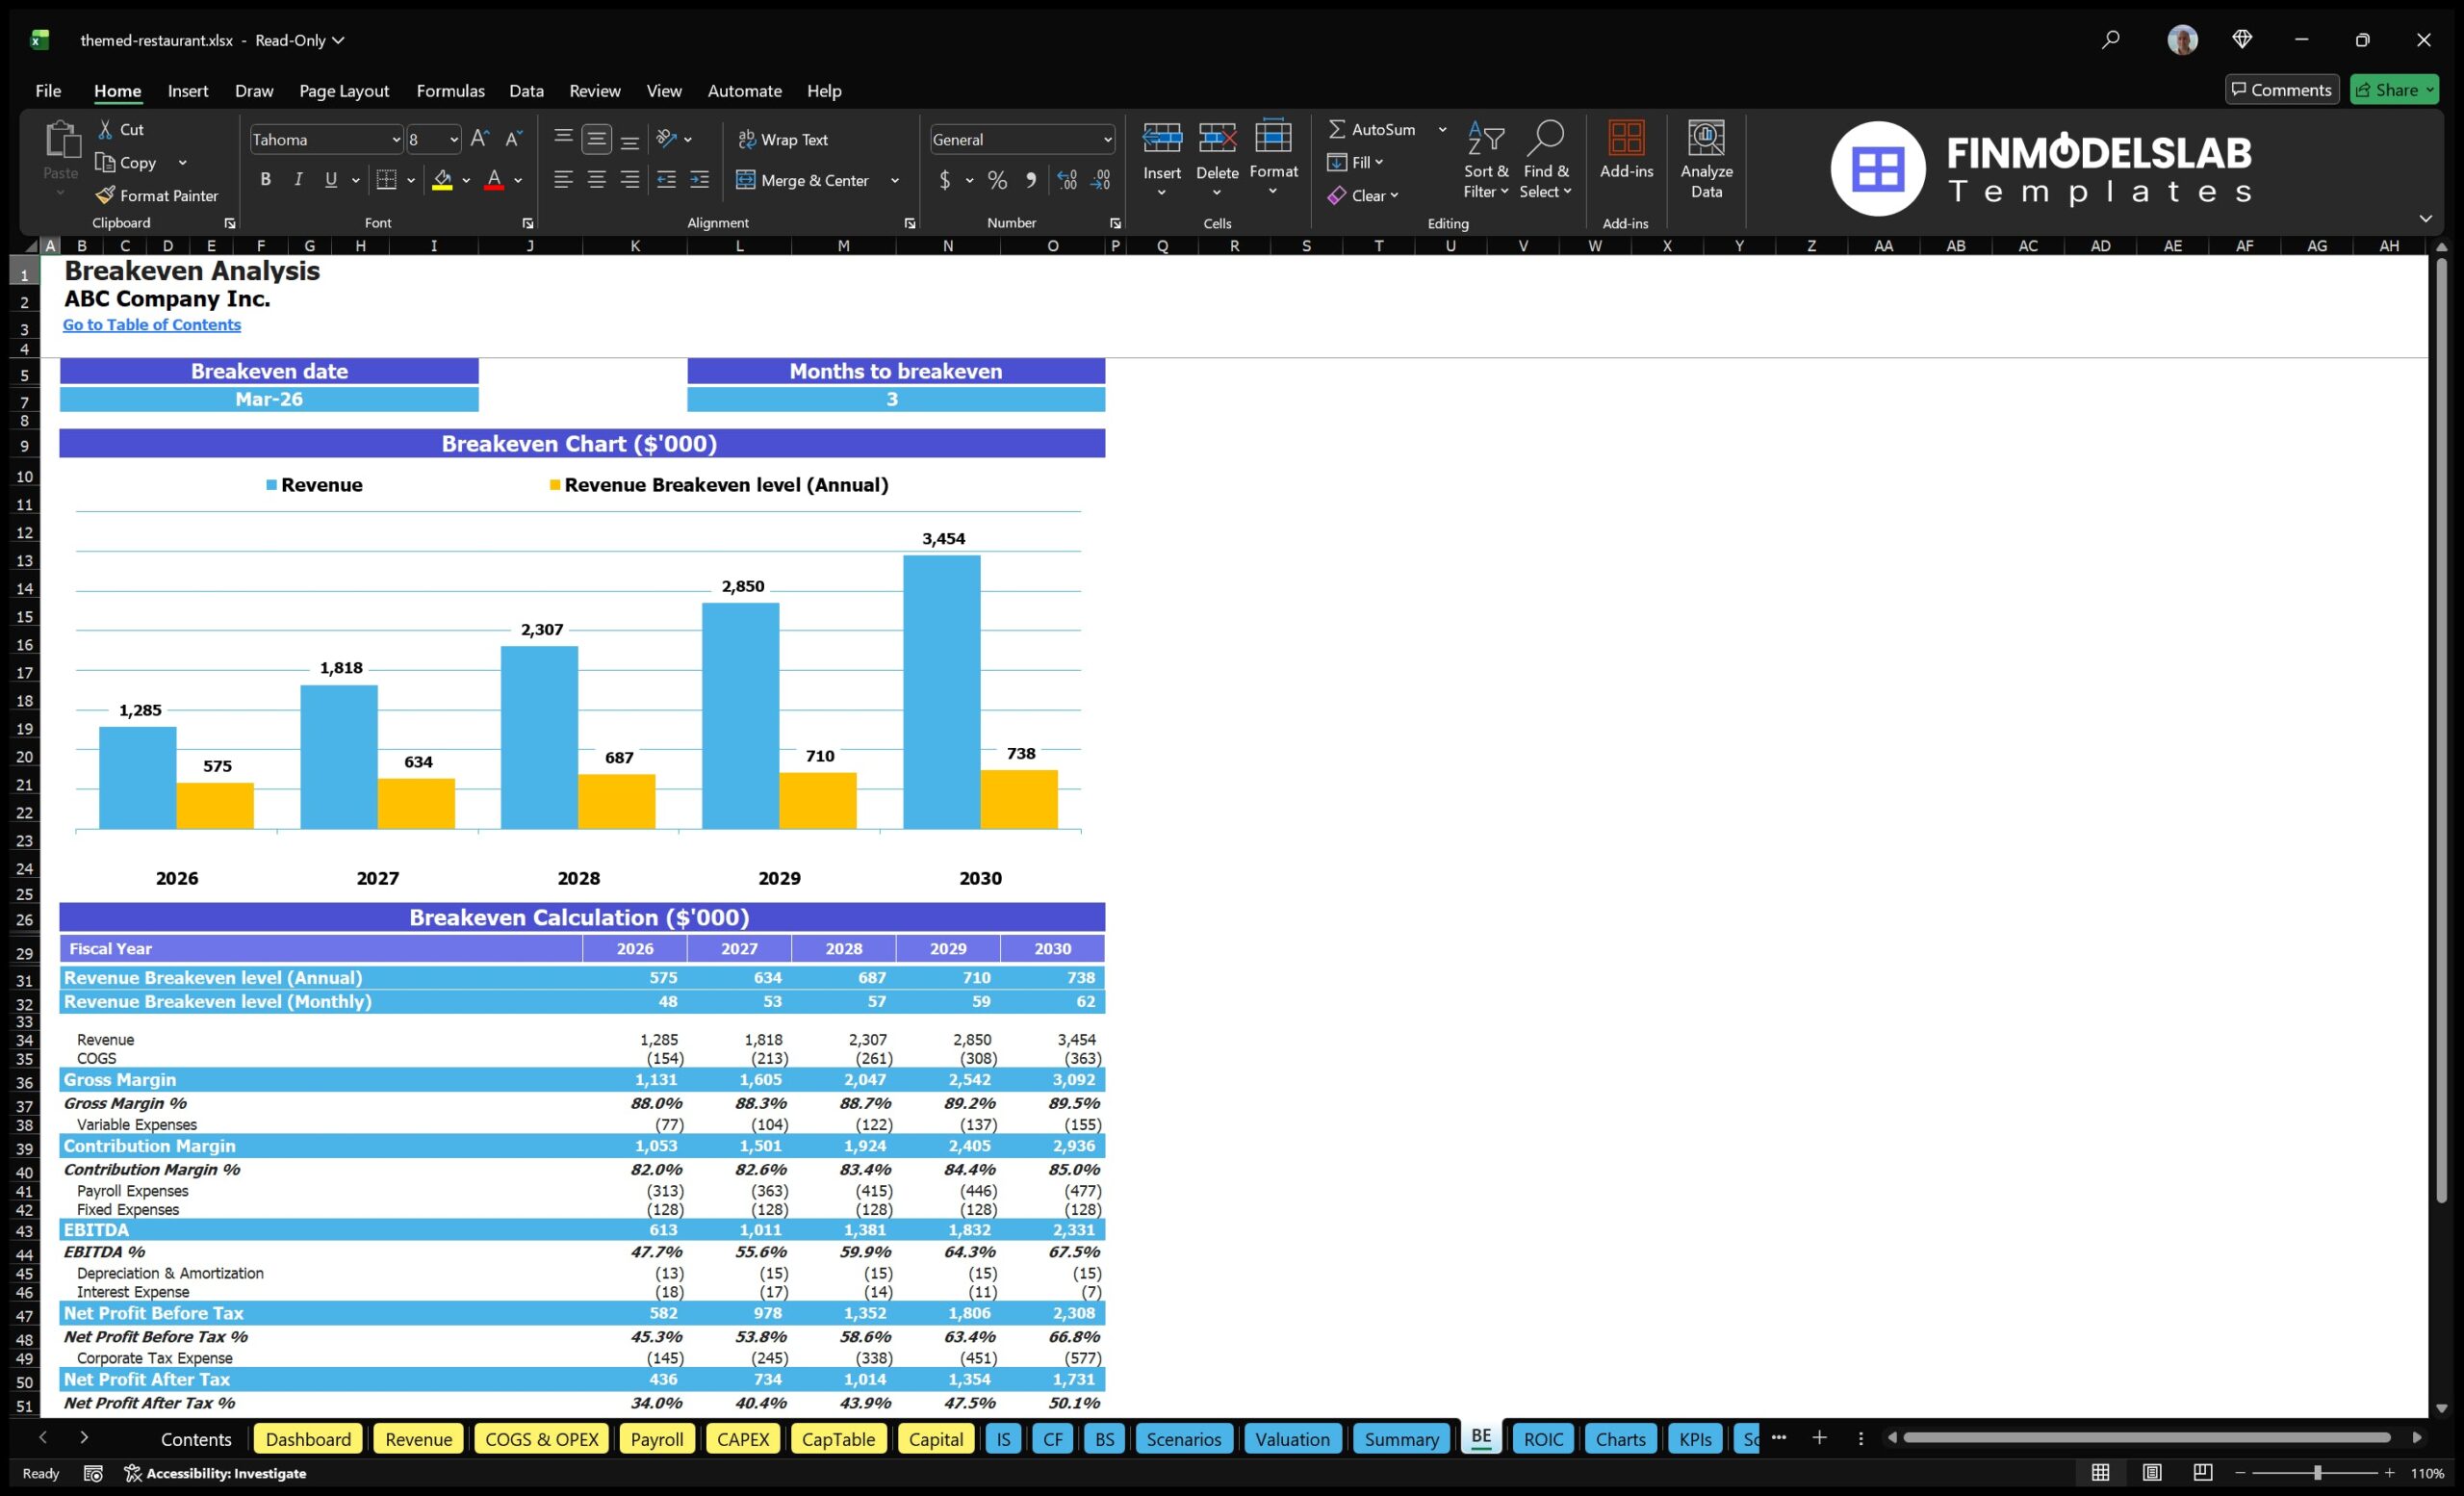
The break-even analysis section helps users determine when the themed restaurant is expected to cover its fixed and variable costs and begin generating profit. This component uses assumptions such as revenue by stream, average check size, customer traffic, cost of goods sold, payroll, rent, utilities, marketing, insurance, and other operating expenses to calculate the sales level or time period required to break even. For a restaurant, this is one of the most important planning outputs because it shows how many customers must be served, how much they must spend, and how tightly costs must be managed to reach sustainability. Users can test how changes in customer volume, menu pricing, food costs, labor scheduling, or fixed expenses affect the break-even point. This makes the section valuable for pricing decisions, staffing strategy, marketing plans, and funding needs. If break-even is delayed under a conservative scenario, users can plan additional working capital or reduce costs before launch. If break-even occurs quickly under the base case, the model can support a stronger investment narrative.
File types:
Excel – Single-User: .xlsx
Excel – Multi-User: .xlsx
Similar ProductsOther customers were also interested in...

 HenrySheykin
Restaurant Financial Model Excel Template
" The Restaurant Financial Model helps users turn a restaurant concept into a structured, editable f... Read more
Cafe Financial Model Excel Template
The Cafe Financial Model is a ready-to-use financial model template designed to help entrepreneurs, ... Read more
Pizzeria Financial Model Excel Template
The Pizza Restaurant Financial Model Template helps entrepreneurs, restaurant owners, consultants, a... Read more

Fast Casual Restaurant Financial Model Excel Templ...
The Fast Casual Restaurant Financial Model helps entrepreneurs, restaurant owners, consultants, anal... Read more

Pub Financial Model Excel Template
The Pub Financial Model helps entrepreneurs, pub owners, consultants, analysts, and business planner... Read more

Fine Dining Restaurant Financial Model Excel Templ...
The Fine Dining Restaurant Financial Model helps entrepreneurs, restaurant owners, consultants, anal... Read more

A La Carte Restaurant Financial Model Excel Templa...
The A La Carte Restaurant Financial Model Financial Model Template helps entrepreneurs, restaurant o... Read more
Catering Financial Model Excel Template
The Catering Service Financial Model helps users turn a catering business plan into a structured, ed... Read more
Gourmet Food Store Financial Model Excel Template
The Gourmet Food Store Financial Model helps entrepreneurs, founders, business owners, consultants, ... Read more
Banquet Hall Financial Model Excel Template
The Banquet Hall Financial Model helps entrepreneurs, venue owners, consultants, analysts, and busin... Read more
You must log in to submit a review.