
0 ITEMS

Banquet Hall Financial Model Excel Template
The Banquet Hall Financial Model helps entrepreneurs, venue owners, consultants, analysts, and business planners build a structured forecast for an event venue business without starting from a blank spreadsheet. It is designed around how banquet halls actually generate revenue and manage costs, including event bookings, package pricing, guest counts, deposits, bar upgrades, equipment rentals, ancillary income, staffing needs, renovation expenses, and ongoing operating costs. By organizing these assumptions into a ready-to-use financial model template, it helps users estimate whether a banquet hall concept can become financially viable before committing major capital. This template is especially useful for people preparing a banquet hall business plan, investor presentation, loan application, internal budget, or expansion analysis. Users can enter their own revenue assumptions, startup costs, operating expenses, payroll plans, and financing structure to create financial projections that reflect their specific market, venue size, pricing strategy, and event mix. Instead of relying on rough estimates, the model connects key business drivers with revenue, cost of goods sold, profitability, cash flow, and return metrics, making it easier to understand how decisions affect the overall financial outlook. The Banquet Hall Financial Model supports practical financial planning by showing how the business may perform over time under different assumptions. It helps users review monthly and annual projections, evaluate cash flow pressure, estimate the path to profitability, and understand break-even timing. For a capital-intensive business such as an event hall, this is particularly important because renovations, kitchen equipment, audiovisual systems, furniture, decor, deposits, licenses, marketing, and working capital can create a significant funding requirement before the venue begins producing consistent income. Built for decision-making, the template gives users a clearer way to test pricing, booking volume, staffing levels, supplier costs, and growth scenarios. It can help identify whether the business needs stronger pre-launch sales, higher-margin add-ons, tighter expense control, or additional funding support. With editable assumptions, professional outputs, and forecasting logic tailored to banquet hall operations, this financial model template provides a practical foundation for planning, presenting, and managing an event venue business with greater confidence.


Financial Model Overview
The Banquet Hall Financial Model is a ready-to-use financial model template created for entrepreneurs, venue operators, consultants, analysts, and founders planning or expanding an event hall, wedding venue, reception space, or private function facility. A banquet hall is not a simple generic service business because revenue depends on event bookings, package pricing, guest counts, seasonality, deposits, bar upgrades, equipment rentals, vendor fees, parking, staffing levels, and the cost of delivering each event. This model brings those drivers together in one structured planning tool so users can estimate revenue potential, startup investment, operating expenses, payroll, cash flow, profitability, funding needs, and investor returns. It is useful for building a business plan, preparing a bank loan package, reviewing an investment opportunity, testing a new venue concept, or managing financial expectations before launch. The template is fully editable, allowing users to replace the built-in assumptions with their own local pricing, capacity, cost structure, hiring plan, financing terms, and growth expectations. By connecting operational assumptions to financial statements and visual outputs, the Banquet Hall Financial Model helps users move beyond guesswork and make better decisions about pricing, capacity utilization, cost control, cash reserves, and long-term profitability.
All-in-One Dashboard
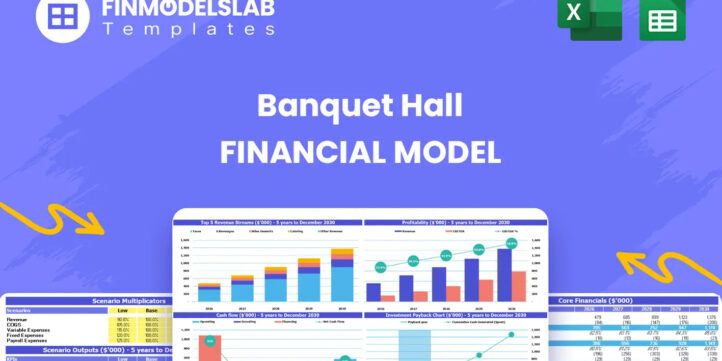
The all-in-one dashboard provides a central view of the most important inputs and outputs in the Banquet Hall Financial Model. Instead of forcing users to search through separate tabs to understand performance, the dashboard summarizes the key assumptions and financial results that matter most for a banquet hall business. Inputs may include the number of event bookings, average event package price, estimated guest counts, add-on sales, cost percentages, staffing assumptions, startup investment, and financing details. Outputs may include projected revenue, gross profit, EBITDA, net income, cash balance, funding requirements, payback period, and selected return metrics. This component is useful because it gives owners, investors, lenders, and advisors a fast way to understand the business model at a glance. For a banquet hall, where profitability can shift quickly based on booking volume and event margins, the dashboard helps users see how operational assumptions translate into financial performance. It also supports decision-making by making it easier to identify whether the venue is underpriced, overstaffed, underfunded, or dependent on too few revenue streams. For presentations, internal reviews, and funding discussions, the dashboard acts as the executive summary of the financial model.
Low, Base, and High Scenario Analysis
The Low, Base, and High scenario analysis component helps users evaluate how the banquet hall may perform under different market conditions. A venue business can be affected by changes in demand, seasonality, local competition, event pricing, customer budgets, supplier costs, labor availability, and economic conditions. This section allows users to compare conservative, expected, and optimistic cases by adjusting key drivers such as annual event bookings, average package price, bar upgrade penetration, rental income, food and beverage cost percentages, payroll levels, and capital spending. The outputs help show how revenue, profitability, cash flow, break-even timing, cash reserves, and investor returns change across scenarios. This is particularly useful for funding preparation because banks and investors often want to understand downside risk as well as upside potential. A low-case scenario may reveal whether the business can survive slower booking growth, while a high-case scenario may show the financial impact of strong demand or premium pricing. The base case can be used as the primary business planning forecast. By including scenario analysis, the Banquet Hall Financial Model gives users a practical way to stress-test assumptions and make more informed decisions before signing a lease, investing in renovations, hiring staff, or committing to long-term financing.
Professional Charts
The professional charts component turns the financial projections into clear visual reports that are easier to interpret and present. Banquet hall projections often include many moving parts, such as event package revenue, bar upgrades, rental income, ancillary fees, direct event costs, payroll, fixed overhead, startup costs, debt service, cash flow, and profitability. Charts help simplify these numbers by showing trends over time, comparisons between revenue streams, expense composition, profitability growth, cash movement, and key performance indicators. Inputs for this section are typically pulled automatically from the forecast, including monthly and annual revenue, EBITDA, net income, cash balances, margins, and investment return outputs. The resulting charts can be useful in investor decks, loan applications, board discussions, and internal planning meetings because stakeholders can quickly understand the financial story behind the business. For example, users can show how revenue grows as event bookings increase, how profitability improves after fixed costs are absorbed, or how cash balances change during the launch period. The visual format also helps identify trends that might be missed in rows of numbers, such as periods of cash pressure, margin compression, or uneven seasonality. This component makes the Banquet Hall Financial Model more presentation-ready and more practical for real-world decision-making.
ROE Components and DuPont Analysis
The ROE components section uses DuPont-style analysis to help users understand what is driving return on equity in the banquet hall business. Return on equity is important for investors and owners because it shows how effectively the business converts invested capital into profit. In a capital-intensive venue business, ROE can be affected by profit margins, asset usage, financing structure, debt levels, and the pace at which the business ramps up bookings. This component may break ROE into drivers such as net profit margin, asset turnover, and financial leverage, allowing users to see whether returns are being driven by strong profitability, efficient use of assets, or debt-funded expansion. Inputs may include projected net income, revenue, total assets, equity investment, debt balances, and balance sheet outputs. The analysis helps users evaluate whether the business is producing sufficient returns relative to the amount of equity required for renovations, kitchen equipment, audiovisual systems, furniture, decor, deposits, licenses, and launch working capital. It is especially useful for investors comparing the banquet hall to other opportunities because it explains the quality of returns rather than simply presenting a single percentage. For owners, it can highlight whether improvement should come from higher pricing, better margins, stronger asset utilization, or a more balanced financing structure.
Revenue Inputs
The revenue inputs component is where users define the commercial engine of the banquet hall business. This section is designed around revenue assumptions that are specific to event venues rather than generic sales estimates. Users may enter the expected number of event package bookings, average package price, event capacity, guest count assumptions, bar upgrade revenue, equipment rental income, vendor fees, parking income, coat check income, service charges, and other ancillary revenue items. The model can then calculate total revenue by stream and show how each driver contributes to overall sales. This is important because banquet halls often rely on both core event packages and high-margin add-ons to reach attractive profitability. A venue may appear profitable based on package pricing alone, but the true earnings potential may depend on upgrades, rental services, and ancillary fees. The revenue inputs section also helps users test pricing strategies, event volume targets, weekday specials, off-season promotions, and premium package options. For business planning, it provides a defensible way to explain revenue assumptions to lenders or investors. For operational planning, it helps owners understand how many bookings are needed, what average event value must be achieved, and how important each revenue stream is to the overall financial forecast.
Bank-Ready Reports
The bank-ready reports component organizes the outputs of the Banquet Hall Financial Model into lender-friendly financial statements and summaries. Banks and other financing partners typically want to see structured projections that clearly explain revenue, expenses, profitability, cash flow, debt repayment ability, startup costs, and funding requirements. This section may include projected profit and loss statements, cash flow forecasts, balance sheet summaries, debt schedules, financing assumptions, and key ratios relevant to loan review. Inputs are drawn from the wider model, including revenue assumptions, operating costs, payroll, capital expenditures, working capital needs, loan amount, interest rate, repayment period, and owner equity contribution. The outputs help users present a more professional case when applying for financing to renovate a venue, purchase equipment, install kitchen systems, build out audiovisual infrastructure, or fund launch operations. For a banquet hall, this is valuable because upfront capital requirements can be substantial and lenders need to understand whether projected cash flow can support repayment. Bank-ready reports also help users identify potential weaknesses before submitting a funding request, such as low cash reserves, insufficient EBITDA, excessive debt service, or unrealistic revenue ramp-up. This component saves time and improves the quality of funding conversations by presenting the business in a format that stakeholders can evaluate more easily.
Revenue Breakdown
The revenue breakdown component provides a detailed view of how total sales are generated across the banquet hall’s revenue streams. Rather than showing only one total revenue line, this section separates event package sales, bar upgrades, equipment rentals, vendor fees, parking, coat check, service charges, and other ancillary income where applicable. Inputs may include volume assumptions, pricing assumptions, utilization rates, guest counts, attach rates for add-ons, and expected changes over time. Outputs can show monthly and annual revenue by category, percentage contribution by revenue stream, growth trends, and the relative importance of core packages compared with add-on income. This component is useful because event venue profitability often depends on understanding which streams drive margin and which streams simply support volume. For example, a banquet hall may find that bar upgrades and equipment rentals improve margins significantly, while lower-priced package sales mainly help fill the calendar. The revenue breakdown also supports pricing decisions, sales strategy, marketing focus, and vendor negotiations. It can help users decide whether to promote premium packages, target corporate events, increase wedding bookings, offer weekday discounts, or develop new ancillary services. For funding and investor presentations, this section makes the revenue model more transparent and credible by showing exactly where projected sales come from.
KPI Dashboard
The KPI dashboard component tracks the performance metrics that matter most for a banquet hall business. Financial statements show the overall results, but key performance indicators help explain why those results are happening. This section may include metrics such as total events booked, average revenue per event, average package price, revenue per guest, event capacity utilization, gross margin, EBITDA margin, payroll as a percentage of revenue, cost of goods sold percentage, cash balance, payback period, and return metrics. Inputs are pulled from revenue assumptions, cost assumptions, staffing plans, and financial statement outputs. The dashboard helps users monitor whether the venue is operating efficiently and whether the business is moving toward its financial goals. For example, if revenue is growing but margins are falling, the KPI dashboard can help identify whether food costs, staffing costs, or supplier expenses are increasing too quickly. If bookings are below target, users can evaluate the impact on cash flow and break-even timing. This component is useful for both planning and ongoing management because it turns the financial model into a performance monitoring tool. It also helps stakeholders compare the banquet hall’s projected performance against internal targets or broader industry expectations, making the forecast easier to evaluate and improve.
Startup Cost and CapEx Planning
The startup cost and CapEx planning component helps users estimate the initial investment required to open, renovate, equip, and prepare the banquet hall for operations. A venue business often requires significant upfront spending before it can generate meaningful revenue, so this section is essential for understanding funding needs. Inputs may include lease deposits, venue renovation and fit-out, kitchen equipment, refrigeration, audiovisual systems, lighting, sound systems, tables, chairs, linens, decor, signage, licenses, permits, professional fees, software, initial marketing, staff recruitment, pre-opening payroll, insurance, and working capital reserves. The model can organize these costs into categories, calculate total startup investment, separate one-time capital expenditures from ongoing expenses, and connect the funding requirement to the cash flow forecast. This is useful because many banquet hall plans fail to account for the full cost of launch, especially when renovations, equipment, and working capital are underestimated. A clear CapEx plan helps users determine how much owner equity, debt financing, or outside investment may be needed before opening. It also supports more realistic conversations with contractors, lenders, landlords, and investors. By showing where the money goes and when it is needed, this section helps reduce funding surprises and improves the quality of the overall business plan.
Break-Even Analysis
The break-even analysis component helps users identify when the banquet hall is expected to become profitable and what level of sales is needed to cover costs. This section connects fixed costs, variable costs, pricing, event volume, gross margin, and operating expenses to calculate the point at which revenue is sufficient to offset the cost structure.
Similar ProductsOther customers were also interested in...


 HenrySheykin
Catering Financial Model Excel Template
The Catering Service Financial Model helps users turn a catering business plan into a structured, ed... Read more
Gourmet Food Store Financial Model Excel Template
The Gourmet Food Store Financial Model helps entrepreneurs, founders, business owners, consultants, ... Read more

Buffet Financial Model Excel Template
The Buffet Restaurant Financial Model helps turn a buffet restaurant concept into a structured, edit... Read more

Hospitality Financial Model Template Bundle
Planning to start a business in the hospitality industry? Do you want to try starting a Hotel busine... Read more
 Pushkar
Multi Cuisine Cafe – 3 Statement Financial M...
This Multi-Cuisine Café business Plan Model is a perfect tool for a financial feasibility study on ... Read more

 Giorgos
Cloud Kitchen Financial Model – 5 Year Financial...
A Cloud Kitchen—also referred to as a “ghost kitchen” or “virtual kitchen”—is a commerci... Read more
 anthony
Hotel/Guesthouse/Resort Development Model and Valu...
This Hotel / Holiday Resort Development Model will take you through a 20-year period of Three Statem... Read more
 Andreas
Catering Services Business Financial Model (10+ Yr...
The catering services business financial model is a comprehensive tool designed to analyze the finan... Read more
Bundle – Business Financial Forecasting Mode...
The purpose of this Bundle of Business Forecasting and Financial Models is to assist Business Owners... Read more

 eFinancialModels
Hospitality Financial Model Template Package
This is a collection of financial model templates for businesses in the hospitality industry and its... Read more
You must log in to submit a review.