
0 ITEMS

Fine Dining Restaurant Financial Model Excel Template
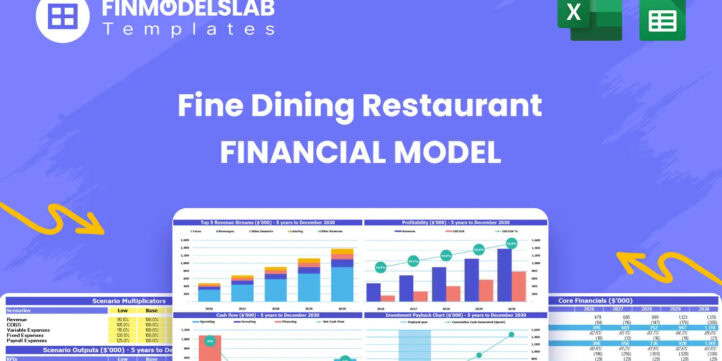
The Fine Dining Restaurant Financial Model helps entrepreneurs, restaurant owners, consultants, analysts, and founders turn an upscale dining concept into a structured financial forecast. Instead of relying on a generic restaurant spreadsheet, this template is built around the drivers that matter in fine dining, including table turns, daily covers, weekday and weekend traffic, average check size, food and beverage mix, labor planning, startup investment, and operating expense assumptions. It gives users a practical way to estimate whether a premium restaurant concept can generate enough revenue, margin, and cash flow to support launch, growth, and long-term profitability. This financial model template is designed for business planning, funding preparation, internal budgeting, and strategic decision-making. Users can customize revenue assumptions, startup costs, operating expenses, payroll, cost of goods sold, and growth expectations to reflect their own location, concept, seating capacity, service model, menu positioning, and pricing strategy. By connecting these assumptions to projected income statements, cash flow, profitability metrics, and performance indicators, the model helps users understand how changes in covers, average check, staffing, supplier costs, or launch spending may affect overall financial performance. For a fine dining restaurant, small assumption changes can have a major impact on results. A shift in weekend covers, wine sales, food cost percentage, labor scheduling, or renovation budget can quickly change cash needs and profitability. This template helps users test these assumptions before committing capital, signing leases, hiring staff, or approaching lenders and investors. It supports break-even analysis, cash flow planning, and profitability review so users can identify the path to sustainable operations and make better decisions with a clearer financial picture. The Fine Dining Restaurant Financial Model is fully editable and ready to use in Excel or Google Sheets, making it suitable for both first-time founders and experienced finance professionals. It can support business plans, investor presentations, loan applications, expansion planning, and ongoing performance reviews. With pre-built formulas, organized assumptions, and presentation-ready outputs, the template saves time while helping users build a more credible, data-driven, and investor-ready financial plan for a premium dining business.


![Excel cash flow statement for ABC Company with monthly columns (2026–2027), blue highlights, and tabbed bottom sheet labels (dashboard, revenue, etc.).]','](https://www.efinancialmodels.com/wp-content/uploads/edd/2026/06/fine-dining-restaurant-financial-model-cash-flow-financialmodelslab_54087de9-3bd0-418b-b626-7b67784232ee-scaled.jpg "fine-dining-restaurant-financial-model-cash-flow-financialmodelslab_54087de9-3bd0-418b-b626-7b67784232ee | eFinancialModels")


Financial Model Overview
The Fine Dining Restaurant Financial Model is a ready-to-use financial model template designed for planning, launching, funding, and managing an upscale restaurant concept. Fine dining businesses have a different financial profile from casual restaurants because performance depends heavily on service capacity, table turns, reservation demand, average check size, beverage mix, food cost control, chef and front-of-house payroll, opening capital expenditures, and the ability to maintain a premium guest experience while protecting margins. This template brings those drivers into one structured model so entrepreneurs, restaurant owners, consultants, analysts, and business planners can build a practical five-year forecast without starting from a blank spreadsheet. Users can customize assumptions for covers, pricing, revenue streams, operating expenses, staffing, startup costs, capital investment, profitability, and cash flow, then review the financial outputs needed for decision-making, business plans, lender discussions, or investor presentations. The model is built to help users answer the most important questions before opening or expanding a fine dining restaurant, including how much capital is required, how revenue will be generated, what expenses must be controlled, when the business can break even, and whether the concept can produce attractive returns over time.
All-in-one Dashboard
The all-in-one dashboard gives users a central view of the most important inputs and outputs in the Fine Dining Restaurant Financial Model. This component is useful because restaurant planning often involves many connected assumptions, including daily covers, average check values, weekday and weekend demand, revenue mix, food and beverage costs, payroll, rent, marketing, startup investment, and working capital. Instead of forcing users to search through separate sheets for every key number, the dashboard brings the core assumptions and headline results into a clear summary view. Users can review sales, expenses, cash flow, EBITDA, net income, margins, return metrics, and other summary outputs from one place, making it easier to understand how the business is expected to perform. For founders and operators, the dashboard supports faster decision-making by showing whether the model is aligned with the restaurant’s pricing strategy, cost structure, and growth plan. For consultants and analysts, it provides a professional control center that can be used to review assumptions with clients or stakeholders. For investors and lenders, it makes the financial story easier to follow because the key outputs are organized and connected to the underlying forecast. The dashboard is especially valuable in a fine dining context because small changes in table utilization, guest spending, staffing levels, and cost of goods sold can have a significant effect on profitability and cash flow. By centralizing those drivers, this section helps users move from raw spreadsheet data to a practical view of business performance.
Low, Base, and High Scenario Analysis
The low, base, and high scenario analysis component helps users test how the fine dining restaurant may perform under different market and operating conditions. A restaurant forecast is never a single fixed outcome, especially for a premium dining concept where demand can shift due to seasonality, local competition, reviews, corporate dining trends, private events, tourism, menu pricing, and changes in consumer spending. This scenario section allows users to compare a conservative case, an expected case, and an optimistic case using adjustable assumptions such as customer volume, average check size, sales mix, food and beverage cost percentages, payroll efficiency, rent burden, marketing spend, and growth rates. The outputs help show how changes in these assumptions affect revenue, gross margin, EBITDA, cash flow, profitability, and funding needs. This is useful for planning because it shows the range of possible outcomes rather than relying on one forecast. In a low scenario, users can identify risk points, such as weak midweek demand, slower ramp-up, higher supplier costs, or lower table turns. In a base scenario, they can set realistic budgets and operational targets. In a high scenario, they can evaluate upside potential from stronger weekend traffic, private dining, premium beverage sales, or improved capacity utilization. Scenario analysis is also valuable for funding discussions because investors and lenders often want to know what happens if the business underperforms. With this component, users can present a more resilient and transparent plan that acknowledges uncertainty while showing how the restaurant can be managed under different conditions.
Professional Charts
The professional charts component turns the financial forecast into visual outputs that are easier to review, explain, and present. Fine dining restaurant financial planning involves many moving parts, including revenue streams, operating expenses, payroll, cash balances, EBITDA, net profit, startup investment, and key performance indicators. Charts help simplify this information by showing trends, comparisons, and relationships across the forecast period. This section may include visual summaries of revenue growth, expense composition, profitability trends, cash flow movement, margin development, scenario comparisons, and investment return metrics. These charts are especially useful when preparing a business plan, investor deck, loan package, or internal strategy review because stakeholders often need to understand the financial story quickly. Instead of reading through rows of assumptions and formulas, users can present the expected growth path, cost structure, cash flow dynamics, and profit potential in a clear format. For a fine dining restaurant, visual reporting can also help highlight important operating insights, such as how increasing beverage sales may improve margins, how payroll as a percentage of revenue changes over time, or how startup investment is recovered through operating cash flow. The charts are designed to be presentation-ready, which saves time for entrepreneurs and consultants who need polished outputs for meetings. They also support better internal decision-making because trends are easier to identify visually than in a long spreadsheet. By translating the model into clear visuals, this component helps users communicate the business case more confidently and professionally.
ROE Components and DuPont Analysis
The ROE components and DuPont analysis section helps users understand the drivers behind return on equity and overall value creation in the fine dining restaurant. Return on equity is an important metric for owners and investors because it shows how effectively the business is using invested capital to generate profit. DuPont analysis breaks this return into more specific performance drivers, typically including profitability, asset efficiency, and leverage-related factors. In the context of a fine dining restaurant, this means users can look beyond a single return number and evaluate how operating margin, revenue generation, asset usage, and capital structure contribute to the final result. Inputs may include net income, revenue, total assets, equity, debt, capital expenditures, and forecasted balance sheet values. The model uses these assumptions and financial outputs to show how the restaurant’s economics improve or weaken over time. This is useful because an upscale restaurant often requires meaningful upfront investment in kitchen equipment, dining room furniture, renovations, bar setup, technology, design, and opening inventory. Owners and investors need to know whether that capital can be converted into sustainable financial performance. The DuPont-style view helps identify whether return is being driven by strong operating profitability, efficient use of assets, or reliance on financing. It also helps users evaluate improvement opportunities, such as raising average check size, improving table utilization, reducing food waste, controlling labor costs, or avoiding unnecessary capital spending. For funding presentations, this component adds analytical depth and demonstrates that the model is not just projecting revenue, but also evaluating the quality and sustainability of returns.
Revenue Inputs
The revenue inputs section is where users define the commercial assumptions that drive the fine dining restaurant forecast. This component is essential because revenue in a premium dining business is shaped by guest volume, pricing, service schedule, seat capacity, table turns, weekday versus weekend traffic, average check size, and sales mix across food, beverages, takeout, delivery, catering, tasting menus, wine pairings, private events, and other potential offerings. Users can adjust these assumptions to reflect their own restaurant concept, location, operating hours, menu positioning, and expected demand ramp-up. For example, a restaurant with a strong weekend reservation base, a premium wine program, or a private dining room will likely have a different revenue profile from a smaller chef-led tasting menu concept with fewer covers and higher check averages. The revenue inputs section allows users to build the forecast from the operational reality of the restaurant rather than using generic sales assumptions. The outputs from this section flow into the revenue forecast, profit and loss statement, cash flow projections, scenario analysis, and KPI summaries. This makes the section one of the most important parts of the model because every cost, margin, staffing decision, and funding requirement ultimately depends on realistic sales expectations. For business planning, this component helps users determine whether the restaurant can generate enough sales to support rent, payroll, food costs, marketing, debt service, and owner returns. For investors or lenders, clearly documented revenue assumptions make the financial plan more credible because they show exactly how the forecasted sales are built.
Bank-Ready Reports
The bank-ready reports component organizes the financial outputs that lenders, investors, advisors, and stakeholders typically expect to see when evaluating a fine dining restaurant business. A lender will not only want to know that the restaurant has an attractive concept, but also whether the forecast supports repayment, stable cash flow, sufficient liquidity, and disciplined expense management. This section helps present the financial model in a structured and professional format, often including projected profit and loss statements, cash flow forecasts, balance sheet summaries, revenue and expense reports, debt service views, profitability summaries, and key financial metrics. The reports use the assumptions entered throughout the model, such as startup costs, revenue drivers, cost of goods sold, payroll, operating expenses, financing terms, and growth expectations, to generate outputs that can be used in a loan package or funding discussion. For a fine dining restaurant, this is particularly important because initial capital needs can be substantial and may include renovations, equipment, furniture, fixtures, permits, pre-opening payroll, deposits, marketing, and working capital. A well-organized financial report helps explain how those funds will be used and how the business expects to generate enough cash to support operations and repayment obligations. This component is also valuable for internal management because it gives owners a more complete view of financial performance across the forecast period. By presenting the model’s outputs in a lender-friendly format, this section helps users save time, reduce formatting work, and improve the credibility of their financial planning documents.
Revenue Breakdown
The revenue breakdown section provides a detailed view of how total sales are generated across the different revenue streams of the fine dining restaurant. While total revenue is useful, it does not show whether the business is relying mainly on dine-in food sales, beverages, wine, cocktails, private dining, catering, events, takeout, delivery, tasting menus, chef’s table experiences, or other premium offerings. This component separates the revenue streams so users can analyze the contribution of each category and understand how the sales mix affects profitability. Inputs may include the percentage of sales allocated to each stream, average spend by category, cover counts, order frequency, event bookings, beverage attachment rates, or growth assumptions. The outputs help users see which revenue channels are the largest, which may offer higher margins, and which can be expanded to improve the restaurant’s overall financial performance. In fine dining, this is especially important because beverages, wine pairings, private events, and premium experiences can materially change margin structure and cash flow. A restaurant that relies heavily on food sales may face more pressure from ingredient costs, while a concept with strong beverage and event revenue may have a different profit profile. The revenue breakdown also helps with operational planning because each stream may require different staffing, inventory, marketing, space usage, and service processes. For decision-making, this section helps users evaluate whether to focus on increasing weekend covers, promoting private dining, improving wine sales, expanding catering, or optimizing menu pricing. It gives users a clearer understanding of what is driving sales and how the concept can grow intelligently.
KPI Dashboard
The KPI dashboard component tracks the performance metrics that matter most for a fine dining restaurant and helps users compare projected results against practical benchmarks. Key performance indicators may include total revenue, revenue growth, gross margin, EBITDA margin, net profit margin, food cost percentage, beverage cost percentage, payroll as a percentage of revenue, average check, daily covers, table utilization, cash balance, break-even timing, return metrics, and other operating ratios. These metrics help users move beyond basic financial statements and evaluate the health of the business in a more actionable way. For example, a profit and loss statement may show that expenses are increasing, but KPI tracking can reveal whether the issue is food cost inflation, underperforming beverage sales, inefficient staffing, low midweek traffic, or excessive fixed costs. The KPI dashboard is useful for entrepreneurs who need clear targets before opening, operators who want to monitor performance after launch, and consultants who need to communicate performance drivers to clients. It can also support investor and lender presentations by showing that the business is being evaluated against meaningful operating measures, not just headline sales.
Excel – Single-User: .xlsx
Excel – Multi-User: .xlsx
Similar ProductsOther customers were also interested in...

 HenrySheykin
Restaurant Financial Model Excel Template
" The Restaurant Financial Model helps users turn a restaurant concept into a structured, editable f... Read more
Cafe Financial Model Excel Template
The Cafe Financial Model is a ready-to-use financial model template designed to help entrepreneurs, ... Read more
Pizzeria Financial Model Excel Template
The Pizza Restaurant Financial Model Template helps entrepreneurs, restaurant owners, consultants, a... Read more

Fast Casual Restaurant Financial Model Excel Templ...
The Fast Casual Restaurant Financial Model helps entrepreneurs, restaurant owners, consultants, anal... Read more

Pub Financial Model Excel Template
The Pub Financial Model helps entrepreneurs, pub owners, consultants, analysts, and business planner... Read more

A La Carte Restaurant Financial Model Excel Templa...
The A La Carte Restaurant Financial Model Financial Model Template helps entrepreneurs, restaurant o... Read more
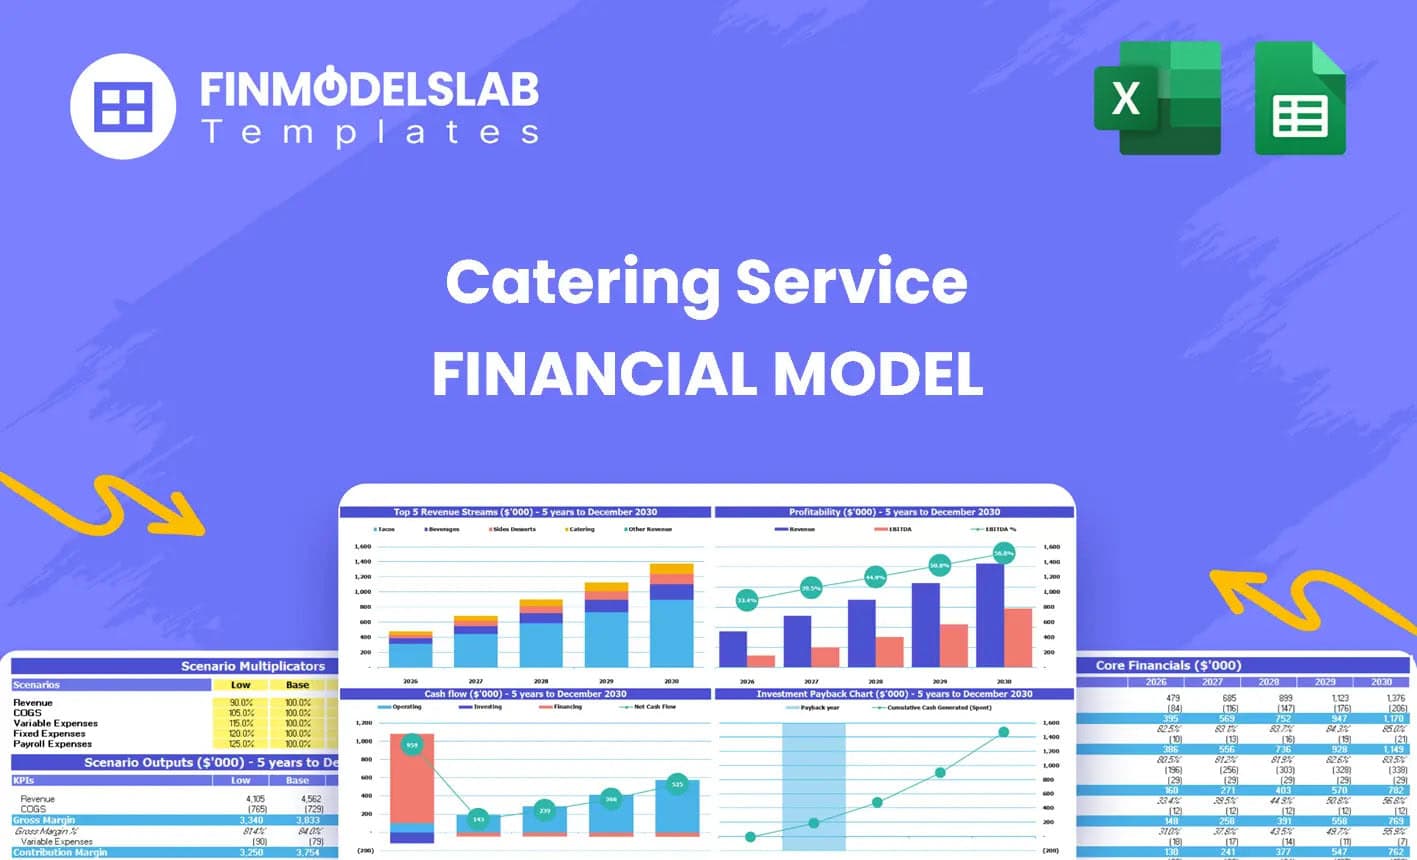
Catering Financial Model Excel Template
The Catering Service Financial Model helps users turn a catering business plan into a structured, ed... Read more
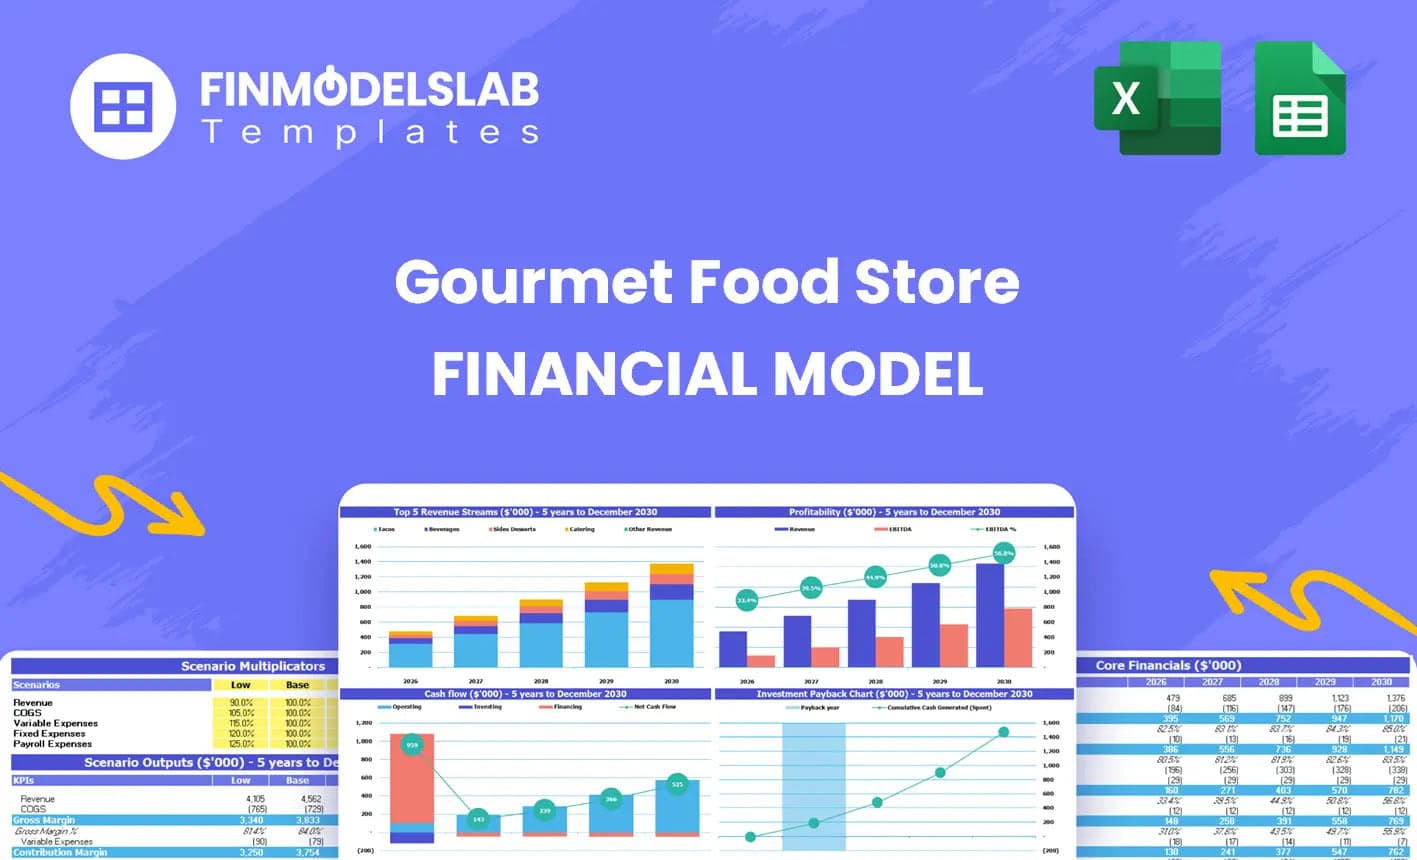
Gourmet Food Store Financial Model Excel Template
The Gourmet Food Store Financial Model helps entrepreneurs, founders, business owners, consultants, ... Read more
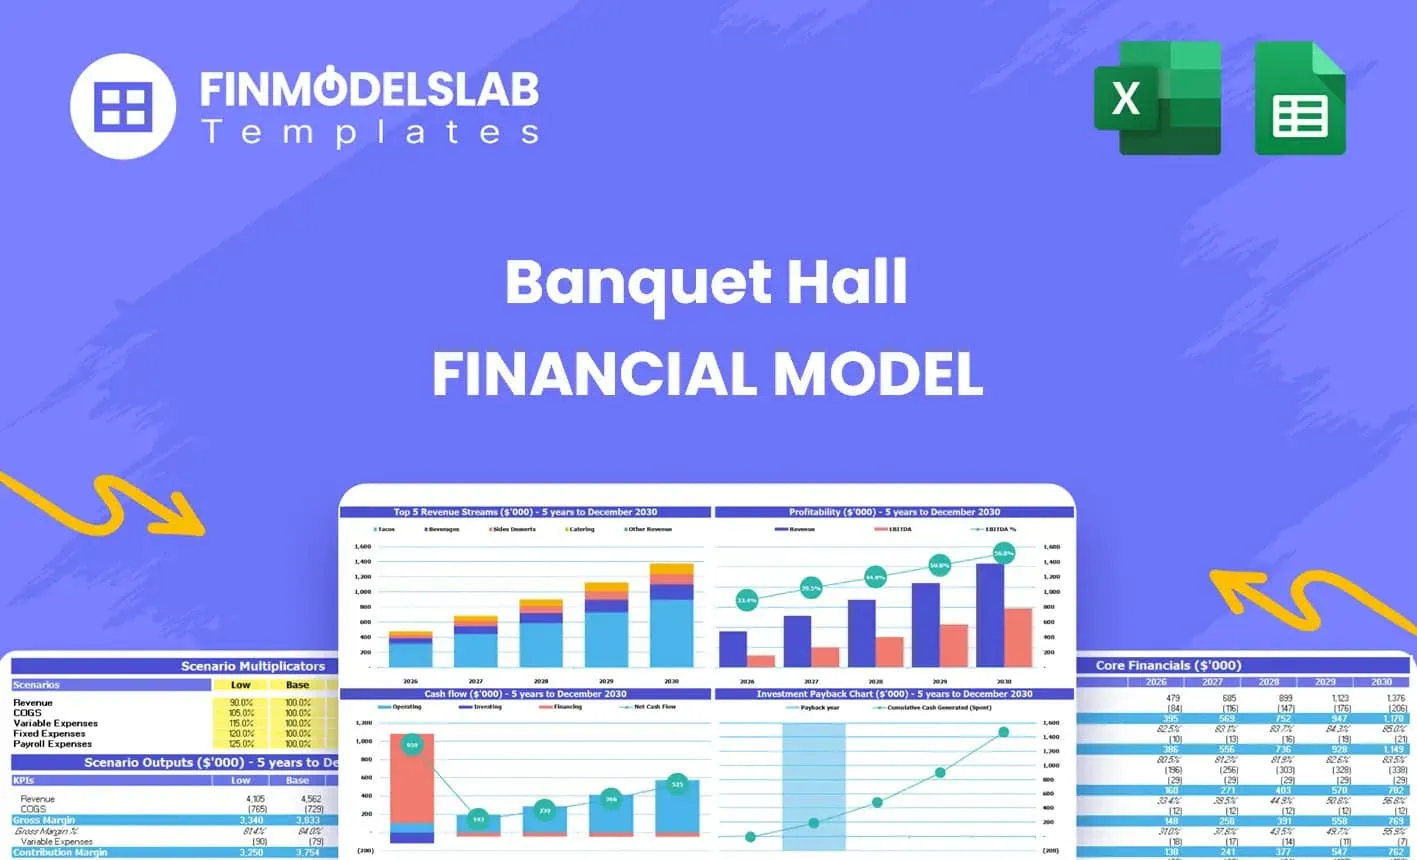
Banquet Hall Financial Model Excel Template
The Banquet Hall Financial Model helps entrepreneurs, venue owners, consultants, analysts, and busin... Read more
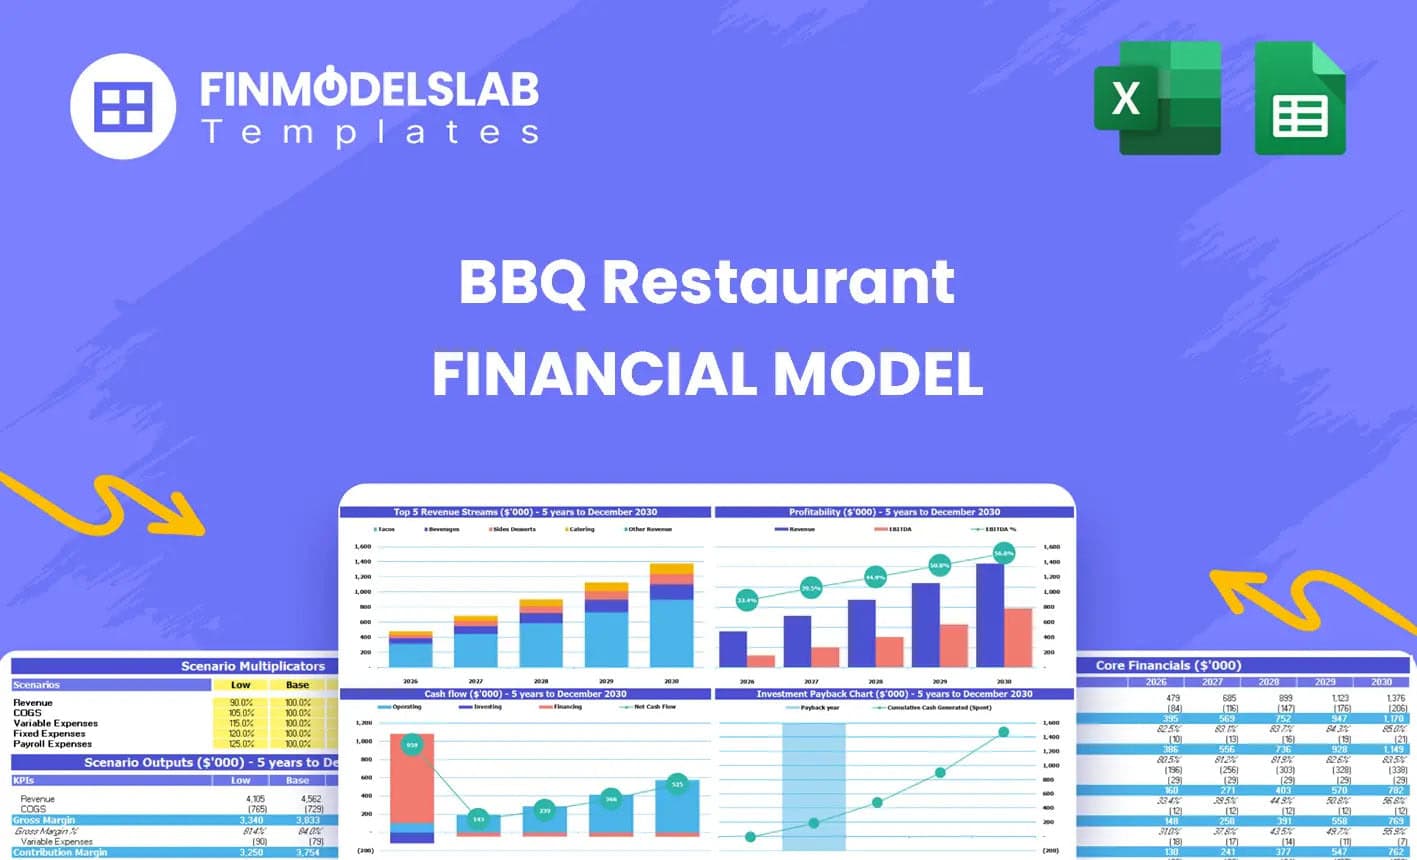
BBQ Restaurant Financial Model Excel Template
The BBQ Restaurant Financial Model Financial Model Template helps entrepreneurs, restaurant owners, ... Read more
You must log in to submit a review.