
0 ITEMS

Real Estate Portfolio Investment Model Excel – 10-Year, 50 Properties, LP/GP Waterfall & US Tax Estimates
A premium 10-year Excel portfolio investment model for up to 50 properties, including 15 editable fictional examples, rental and NOI projections, debt amortization, refinancing, portfolio NAV and IRR, property comparisons, an LP/GP distribution waterfall and configurable US tax estimates. Includes 18 interconnected worksheets, 10 native charts, annual model checks and a detailed 28-page PDF user guide.



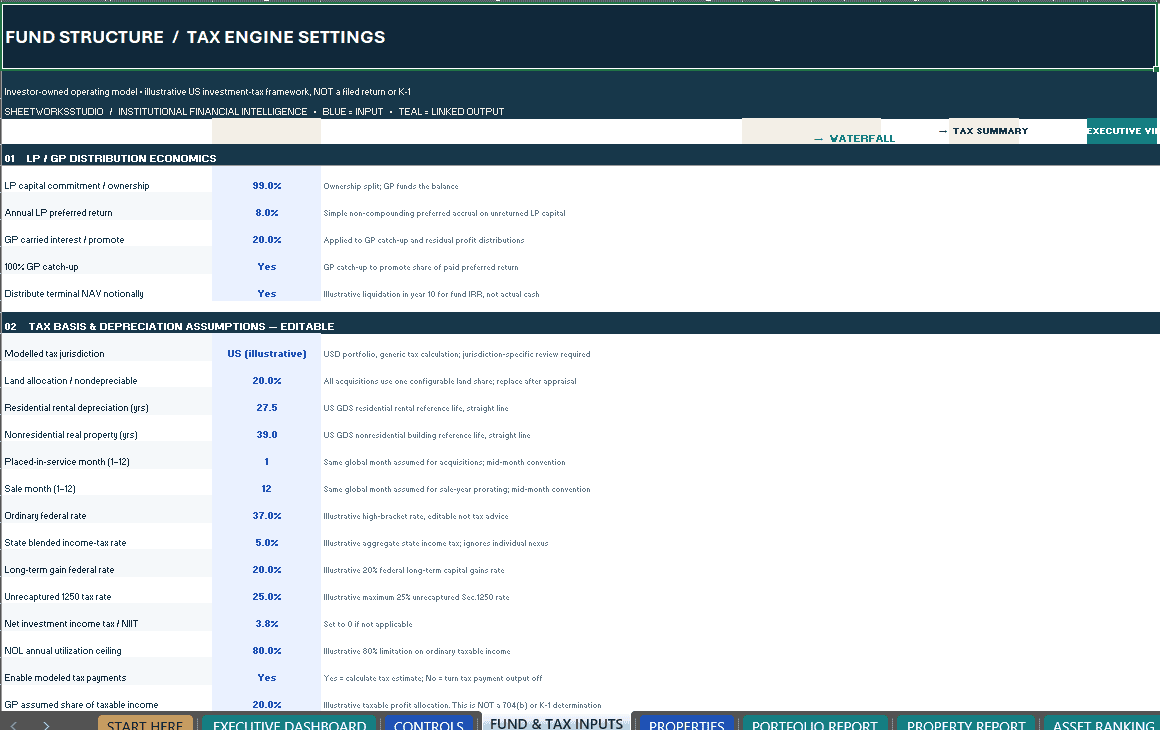
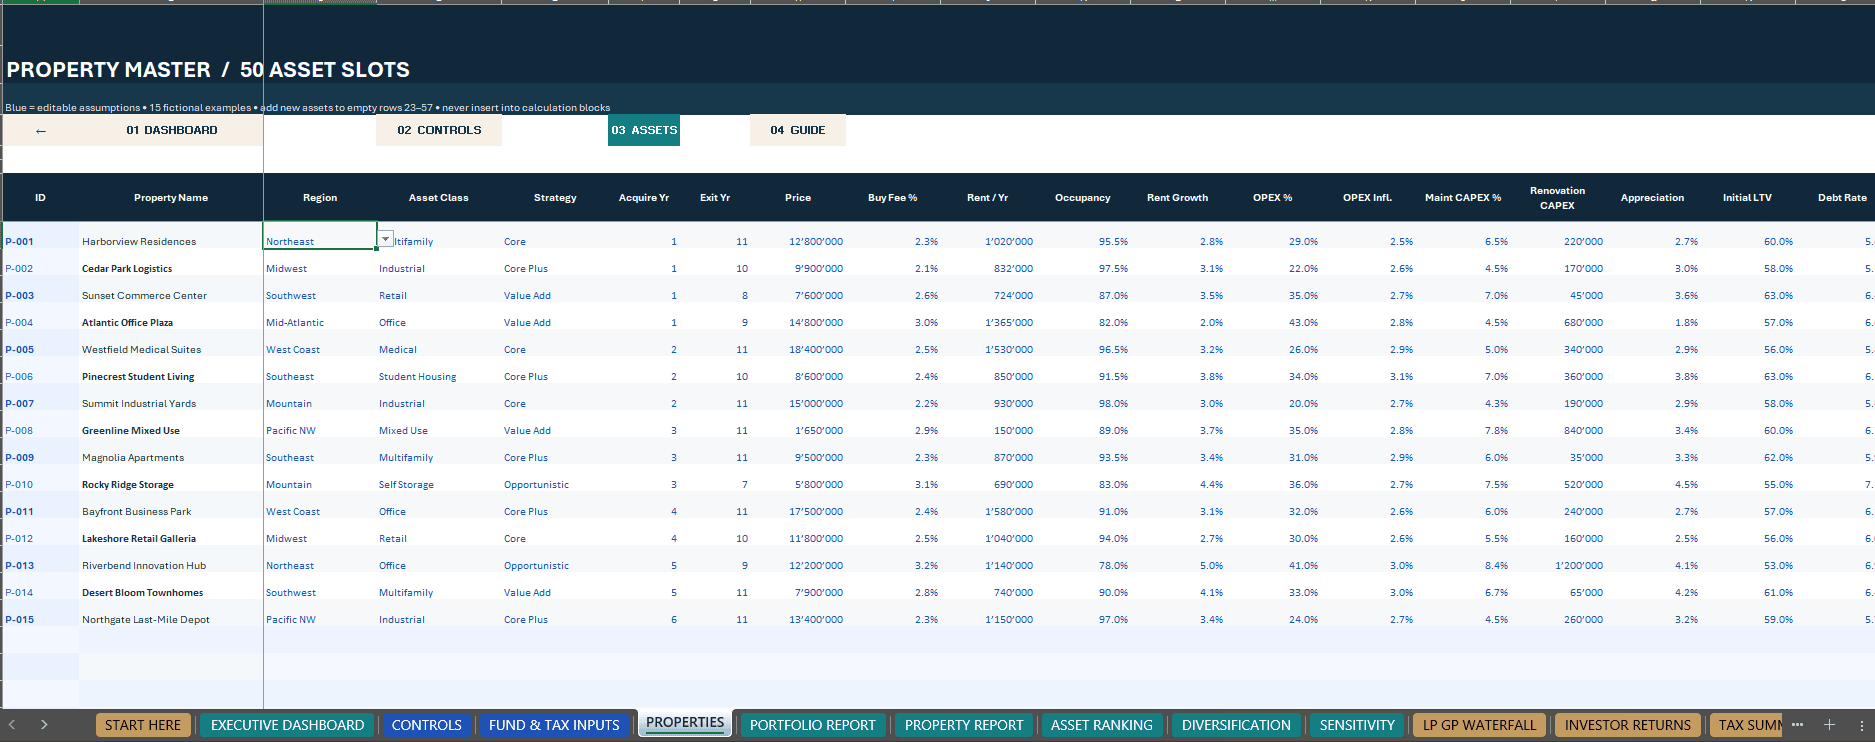
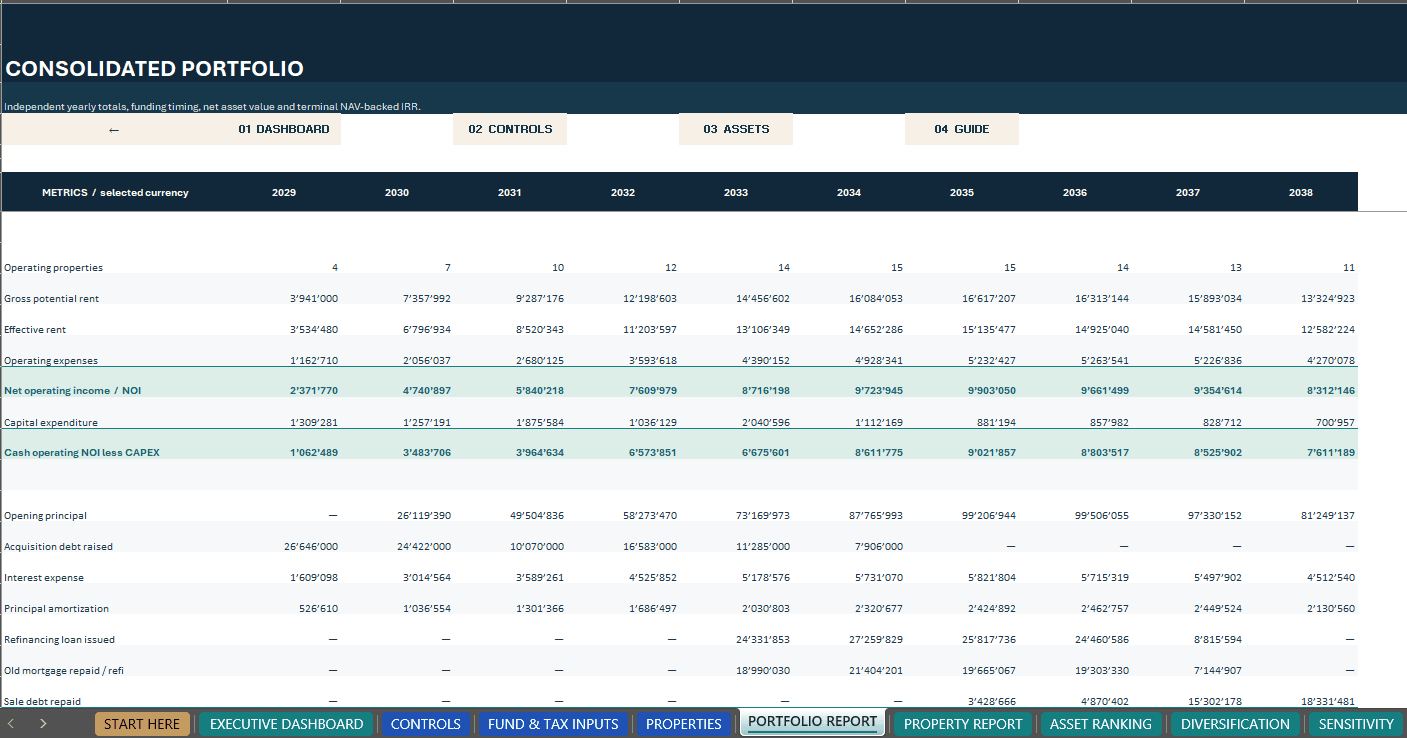
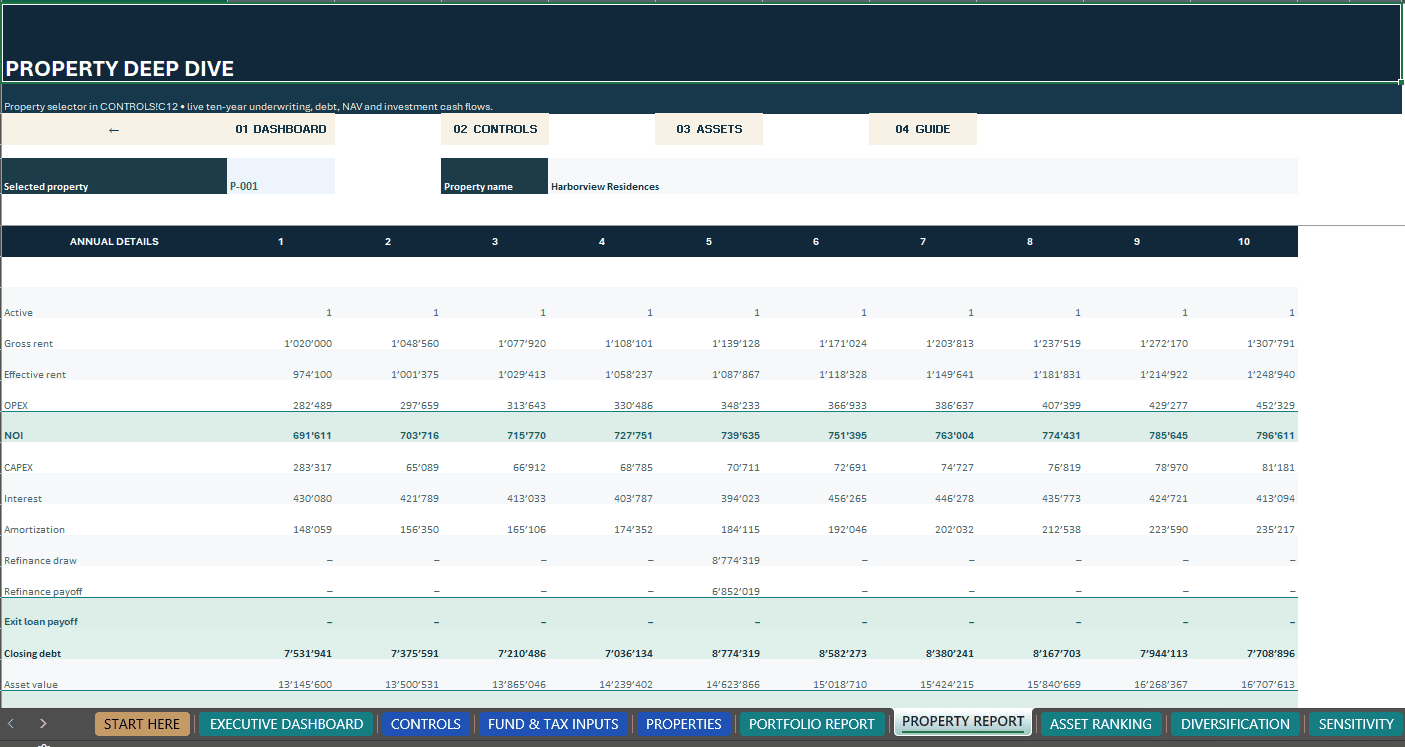
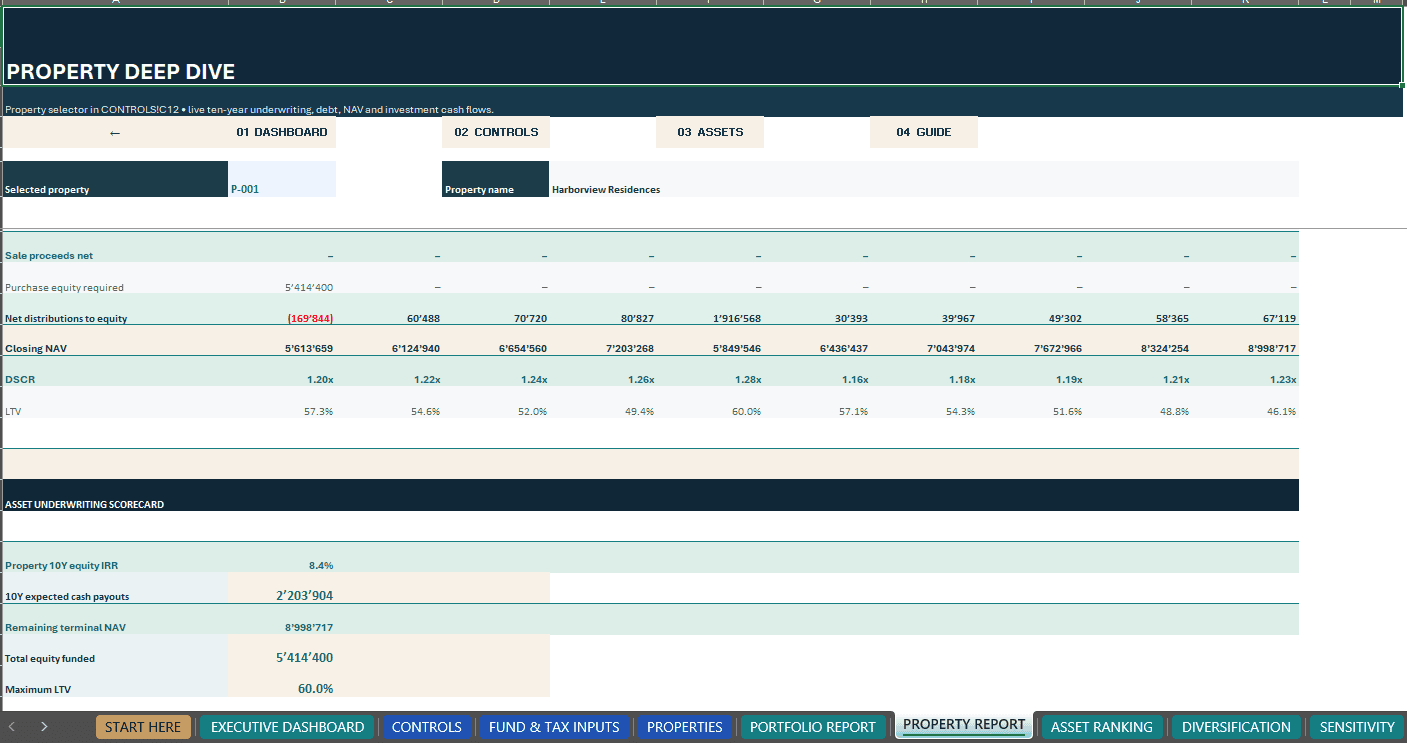
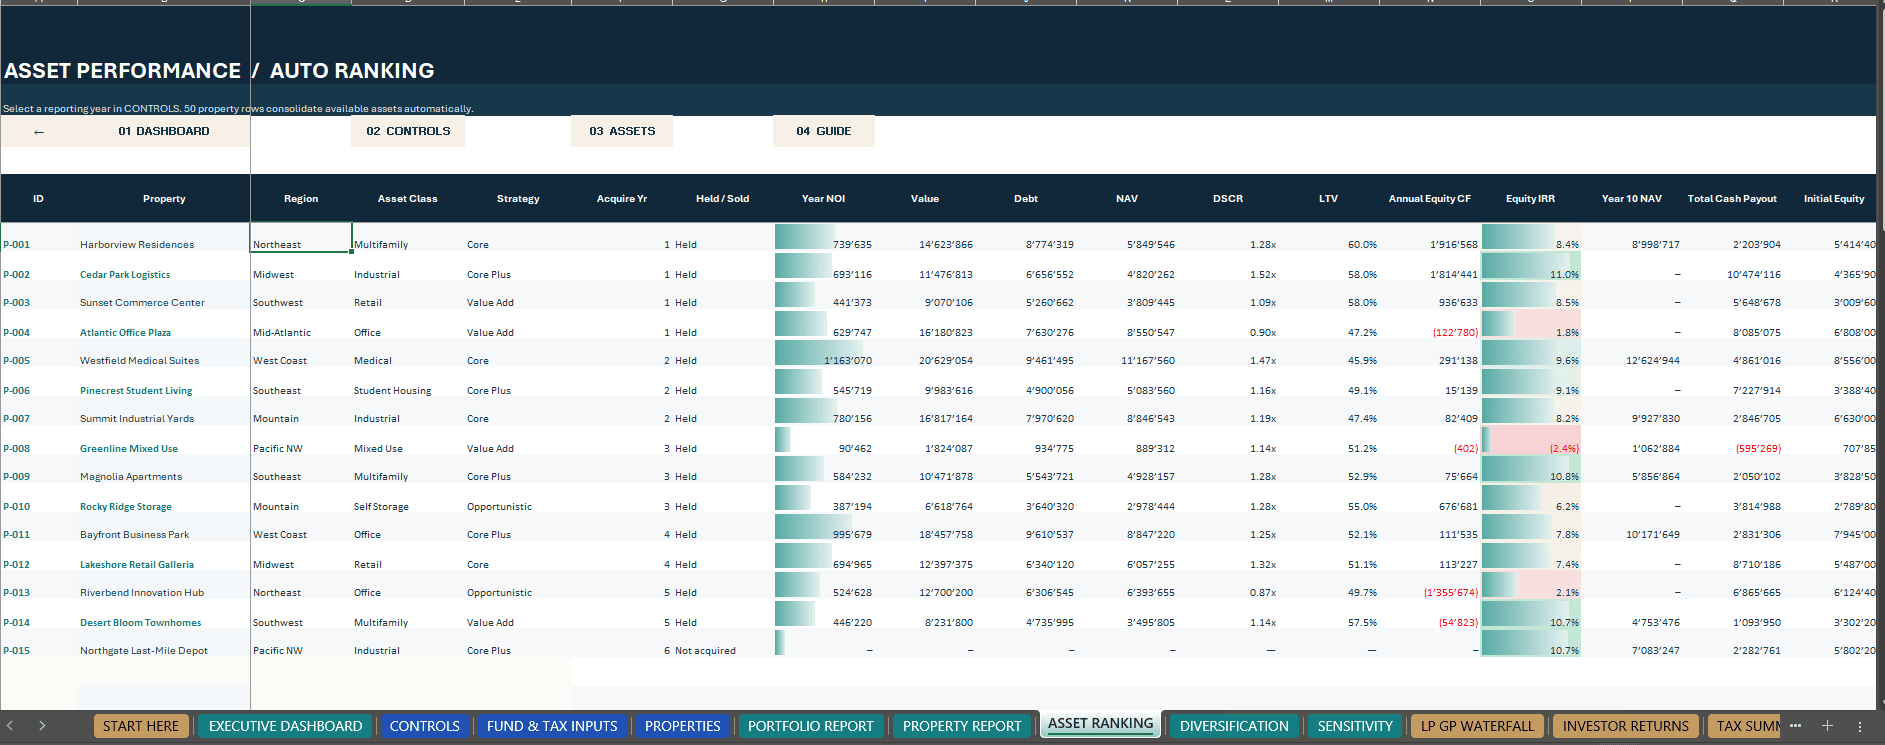
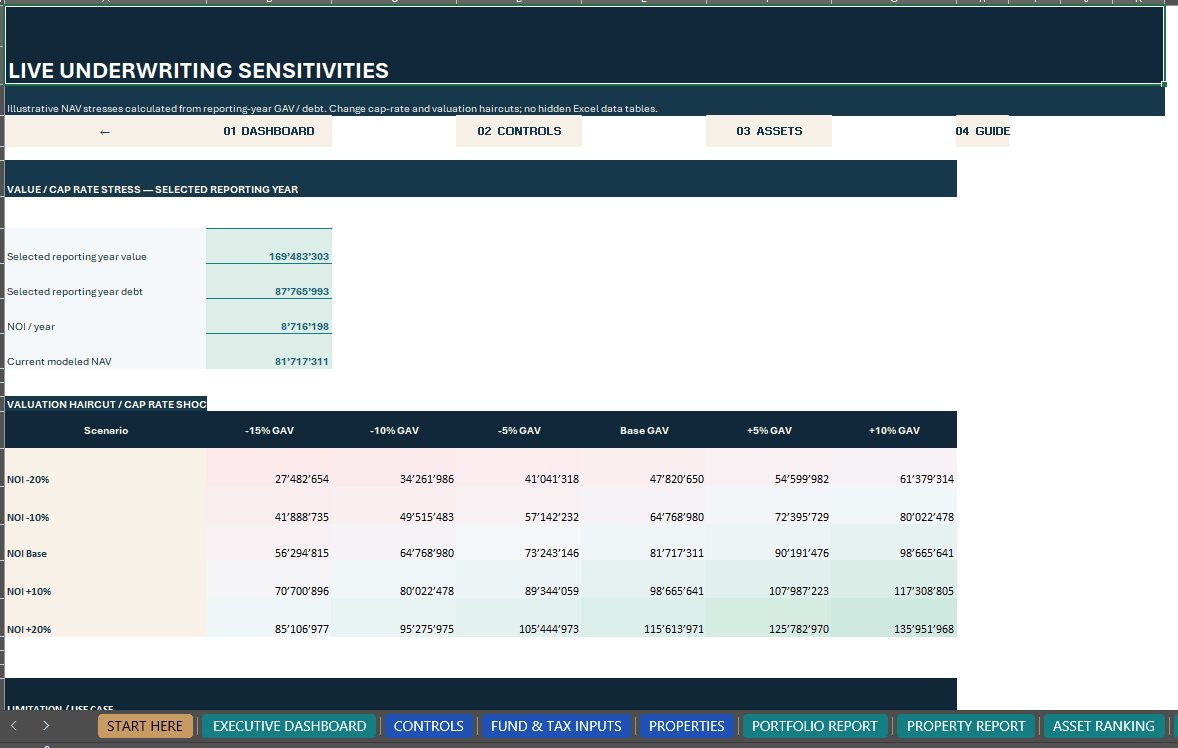
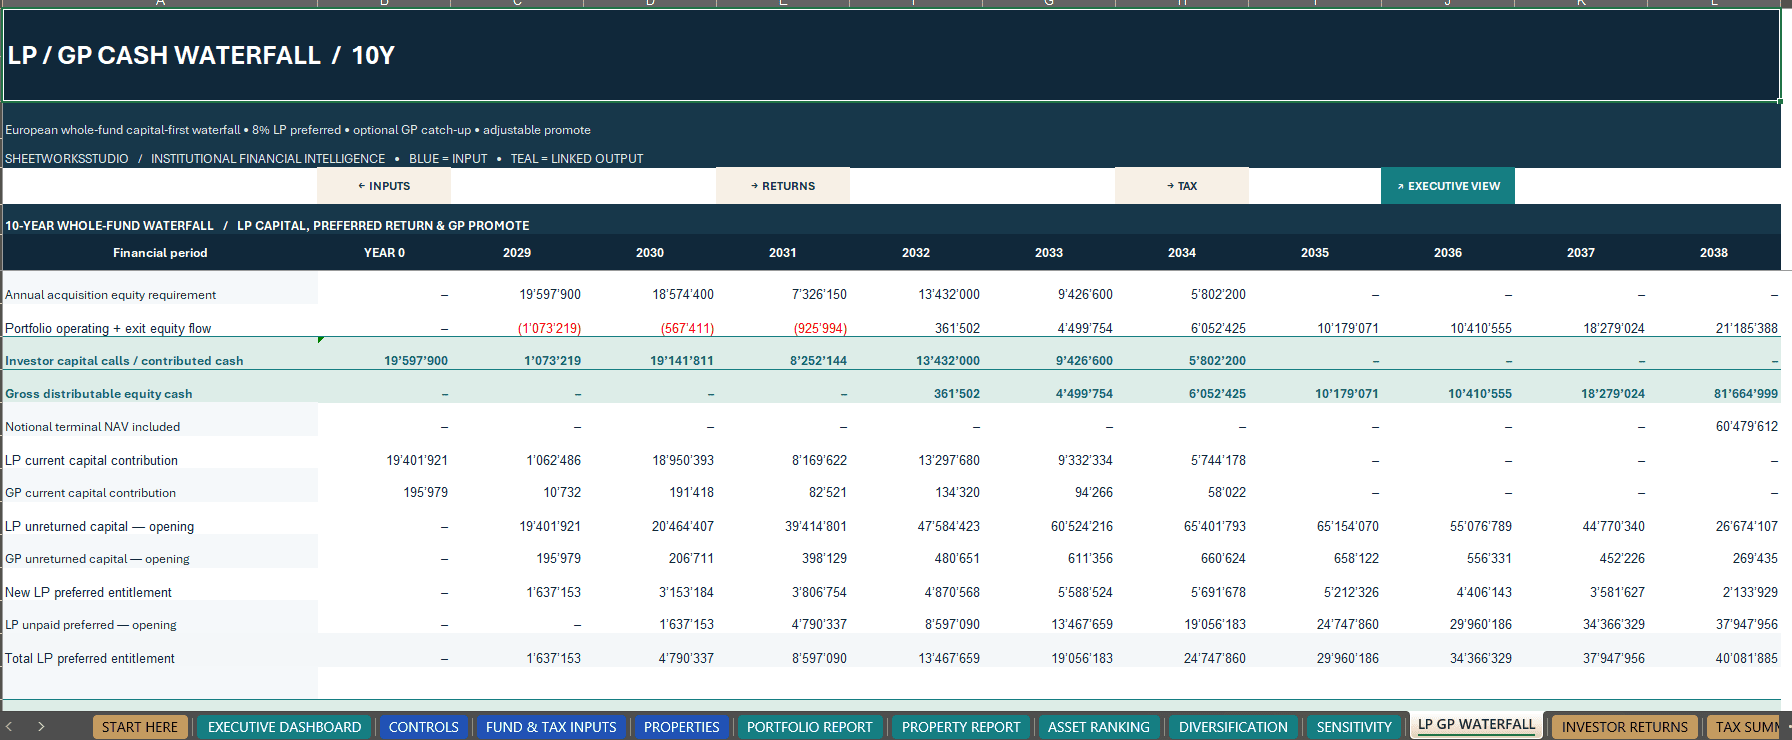


From Property Acquisition and Rental Operations to Refinancing, Portfolio Valuation and LP/GP Investor Distributions — One Fully Connected Excel Investment Model.
The Real Estate Portfolio Investment Model by SheetworksStudio brings property-level underwriting, consolidated financial reporting, investment return analysis, a whole-fund distribution waterfall and configurable US tax estimates into one professional Excel workbook.
Built around a 10-year annual investment horizon, the model supports up to 50 properties, with 15 fictional example assets included to demonstrate the calculation framework.
Designed for real estate investors, acquisition analysts, asset managers, fund sponsors and investment professionals, this model provides a structured foundation for analyzing income-producing properties and understanding how individual investments contribute to overall portfolio performance.
Unlike disconnected property calculators, the workbook links acquisition assumptions, operating performance, debt financing, refinancing, valuations, investor distributions and financial controls within a transparent, editable framework.
🏢 1. PROPERTY OPERATIONS & INVESTMENT CASH FLOWS
Manage the complete investment life cycle of individual real estate assets within 50 prepared property slots.
Property Investment Features:
- Property identification, location and asset class
- Acquisition timing and purchase assumptions
- Rental revenue and occupancy forecasting
- Operating expenses and Net Operating Income (NOI)
- Capital expenditure planning
- Debt financing and mortgage amortization
- Interest expense and scheduled debt service
- Refinancing assumptions and proceeds
- Property appreciation and capitalization-rate valuation
- Asset sales, exit proceeds and equity cash flows
The dedicated PROPERTY YEARS calculation engine supports 500 property-year combinations, allowing up to 50 assets to be evaluated across 10 annual forecast periods.
Each property’s assumptions feed the consolidated financial reports while preserving its individual operating and investment characteristics.
📊 2. EXECUTIVE DASHBOARD & PORTFOLIO PERFORMANCE
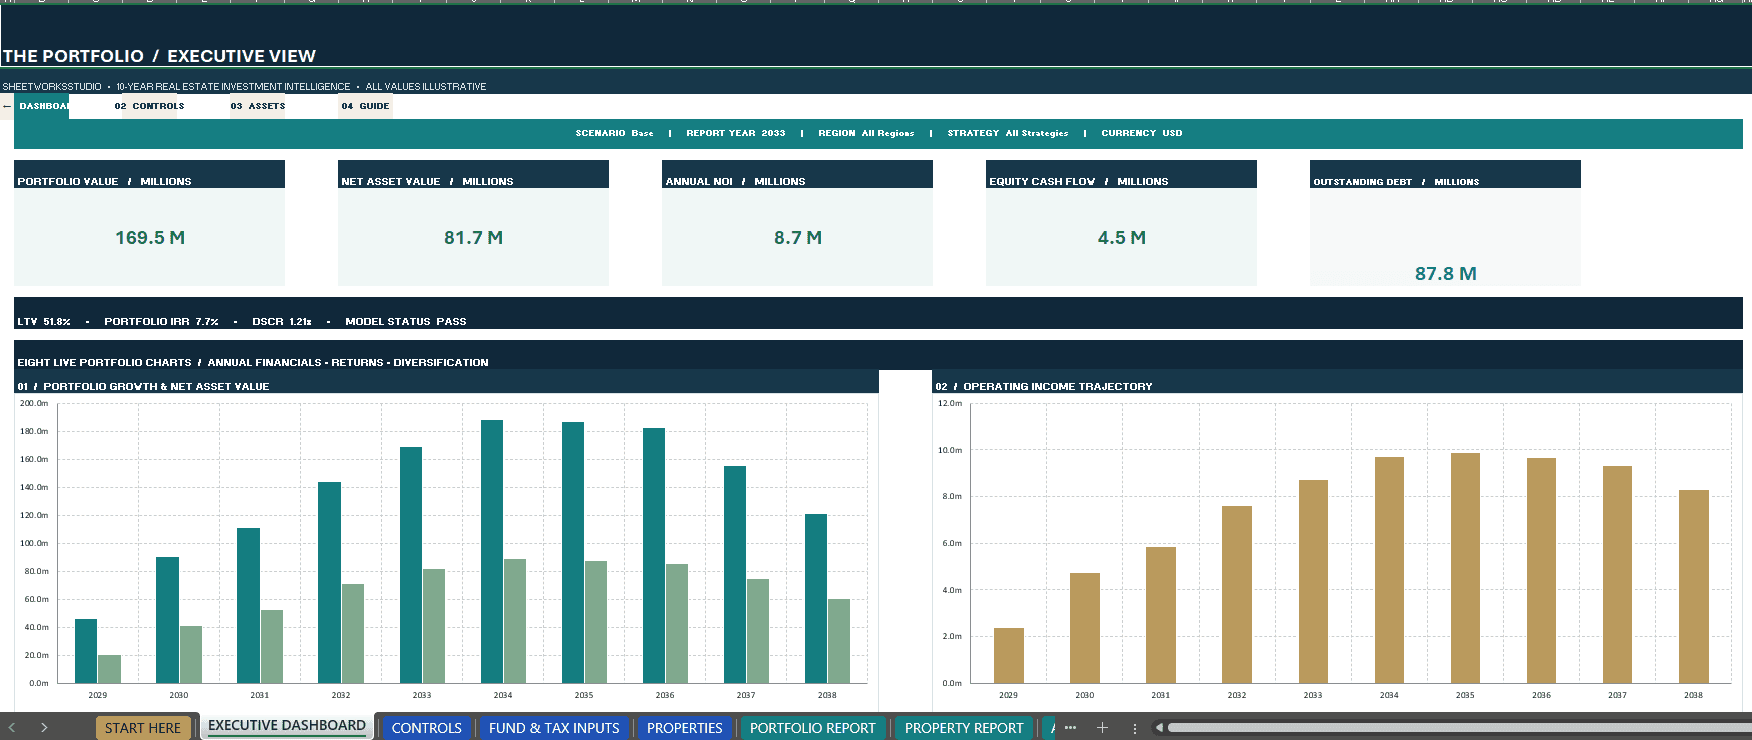
The premium Executive Dashboard consolidates critical portfolio financial metrics in a coordinated navy, teal and muted-gold reporting environment.
Key Performance Indicators Include:
- Portfolio Market Value
- Net Asset Value (NAV)
- Net Operating Income
- Annual Equity Cash Flow
- Outstanding Debt
- Loan-to-Value Ratio (LTV)
- Debt Service Coverage Ratio (DSCR)
- Portfolio Equity Internal Rate of Return (IRR)
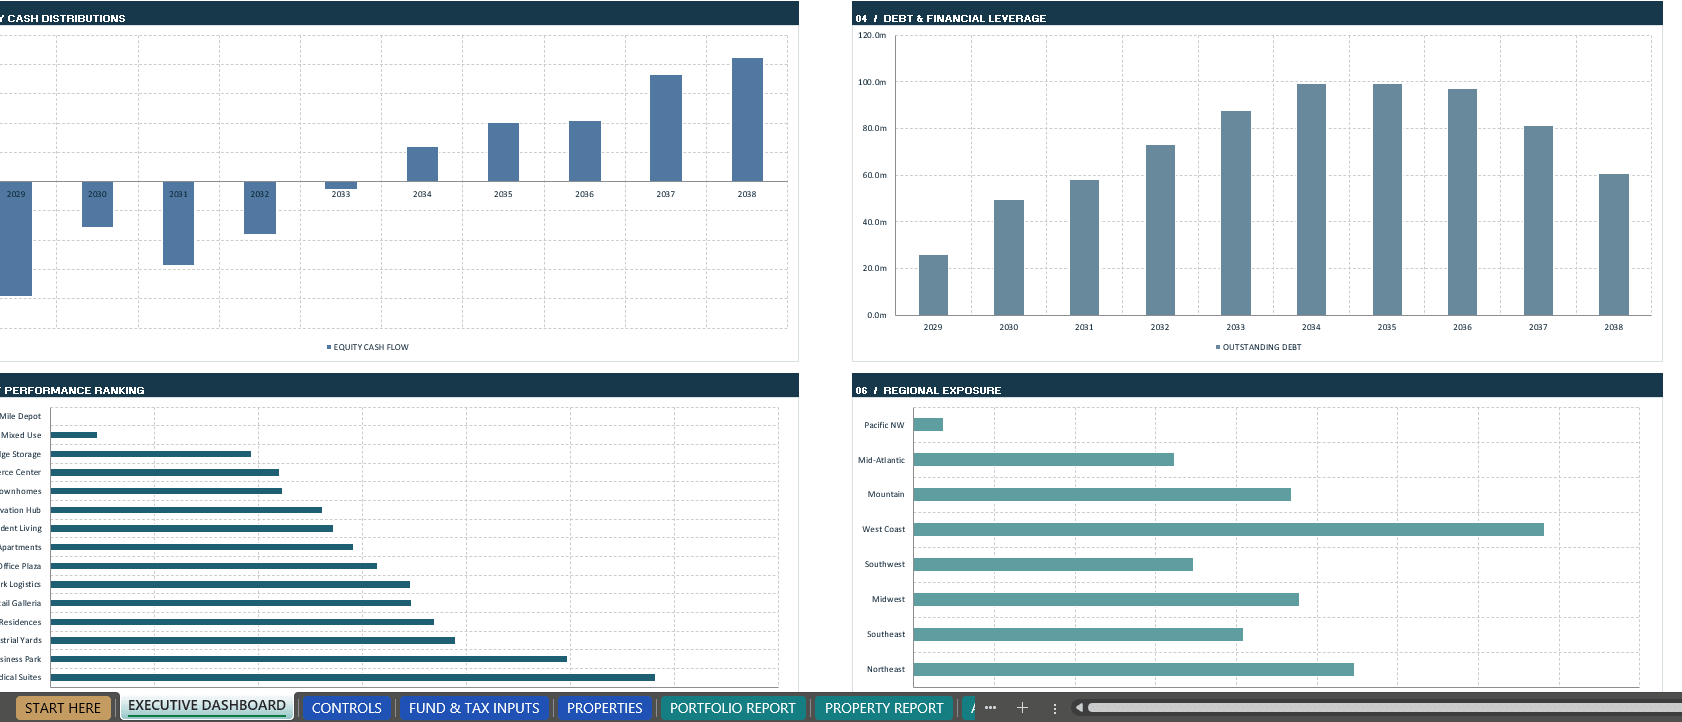
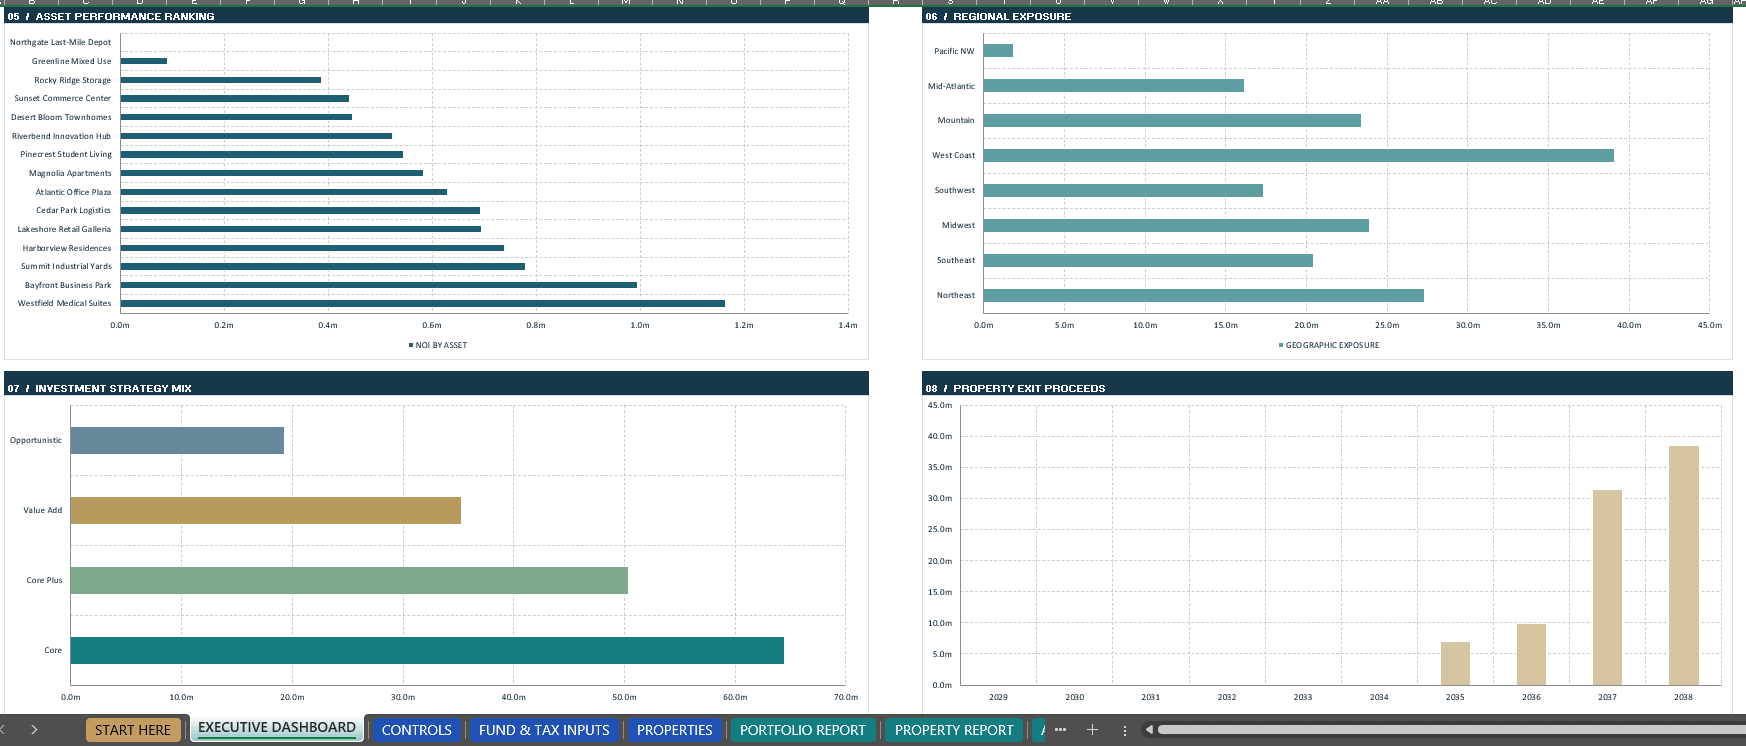
The workbook contains 10 native, data-linked Excel charts, including eight Executive Dashboard charts and two specialized investor and tax reporting charts.
Visual reporting covers portfolio value, equity, operating profitability, financing, property composition, geographic diversification and investment distributions.
The model also allows users to review relevant property, region and investment strategy summaries.
Annual trend charts represent the complete portfolio, while regional and strategy selections apply to the relevant selected-period reporting views.
📈 3. PROPERTY COMPARISON, DIVERSIFICATION & SCENARIO ANALYSIS
Evaluate portfolio performance beyond a single consolidated financial return.
Dedicated reporting modules provide:
- Individual property performance analysis
- Asset ranking and comparison
- Portfolio diversification
- Geographic concentration
- Investment strategy exposure
- Property valuation analysis
- Financial sensitivity calculations
- Operating and financing risk indicators
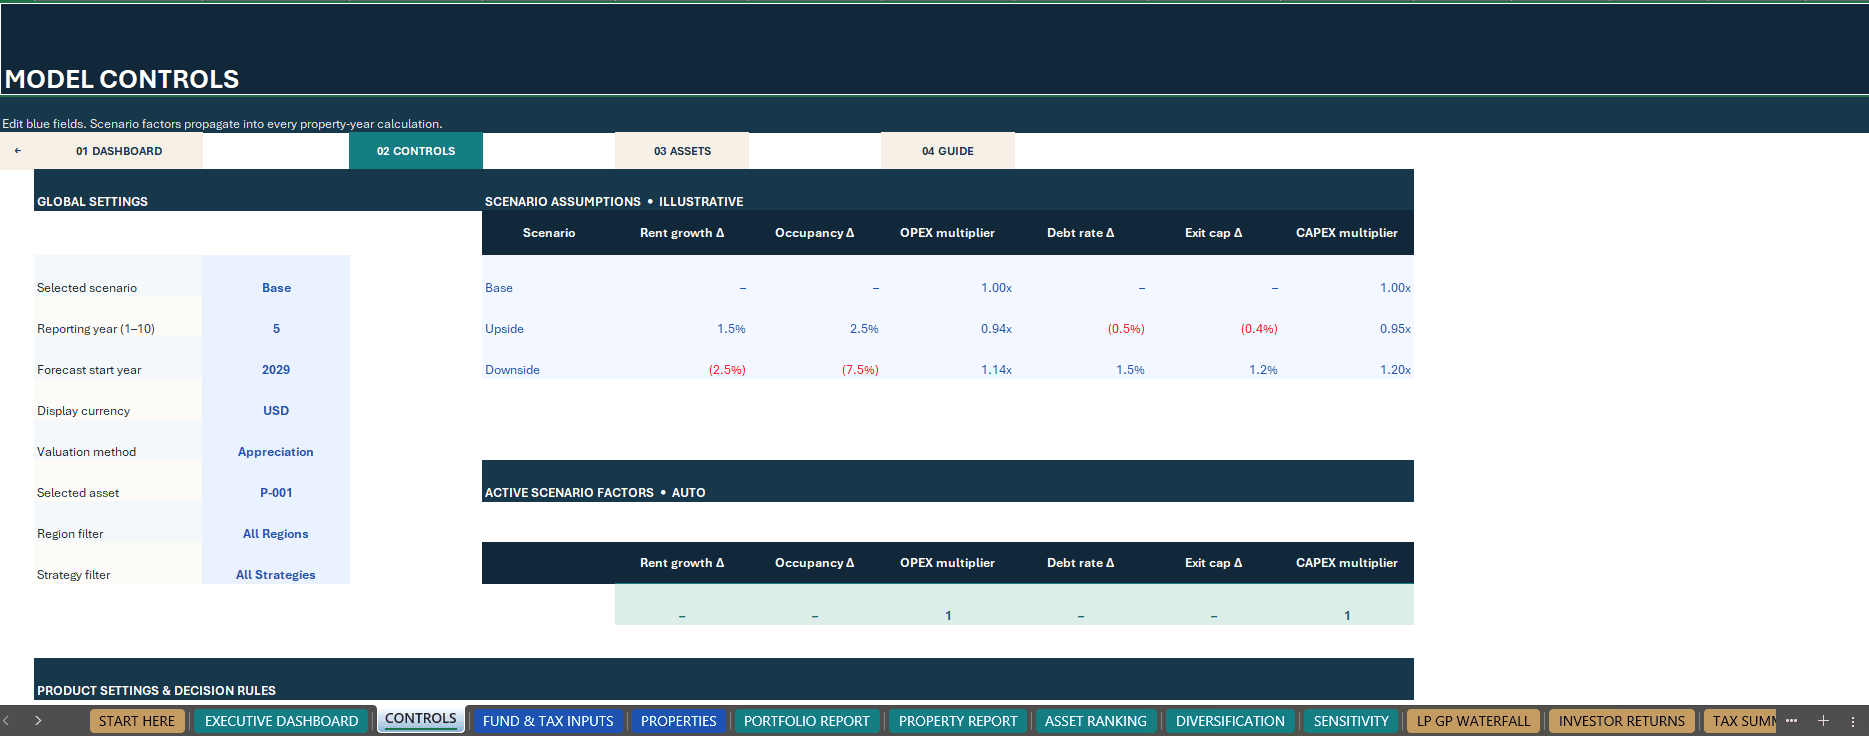
Three integrated scenarios — Base, Upside and Downside — allow users to evaluate alternative underwriting assumptions.
Scenario drivers include rental growth, occupancy, operating expenses, financing interest rates, exit capitalization rates and capital expenditures.
Users can examine how changing assumptions influences operating income, debt coverage, valuation and investor economics.
The workbook supports property appreciation and NOI/capitalization-rate-based valuation methods, providing alternative perspectives on asset values within the model’s simplified underwriting framework.
💼 4. EUROPEAN-STYLE LP/GP DISTRIBUTION WATERFALL
Connect property investment cash flows to fund-level investor distributions.
The integrated European-style, whole-fund, capital-first waterfall models the allocation of distributable portfolio cash flows between Limited Partners (LPs) and the General Partner (GP).
Configurable Waterfall Assumptions:
- LP and GP capital participation
- Return of invested capital
- Accrued LP preferred return
- Optional GP catch-up
- GP promote participation
- Residual profit-sharing percentages
- Annual investor cash distributions
- Remaining unreturned capital
The linked INVESTOR RETURNS worksheet provides separate LP and GP investment cash flows, contributions, distributions, pre-tax IRRs, estimated after-tax IRRs and investment multiples.
Terminal NAV Modeling
An optional terminal-NAV assumption enables users to examine the impact of a notional realization of remaining portfolio value on final investment returns.
Terminal NAV is an illustrative modeling assumption and does not automatically represent an actual property disposal or realized investor cash distribution.
This framework supports analysis of fund economics, distribution priorities and potential differences between LP and GP investment performance.
🧮 5. CONFIGURABLE US TAX ESTIMATES
Extend investment analysis with an illustrative US-oriented tax estimation layer.
The model incorporates property-level tax calculations and a consolidated tax summary that connects estimated tax obligations with investor-level cash flow projections.
Included Tax Analysis Features:
- Acquisition cost basis
- Capitalized property improvements
- Adjusted tax basis
- Simplified property depreciation
- Operating income and mortgage interest deductions
- Illustrative ordinary loss carryforwards
- Capital gains and losses on property disposals
- Depreciation-related gain components
- Configurable federal income tax assumptions
- Configurable blended state income tax
- Capital gains and unrecaptured Section 1250 rates
- Net Investment Income Tax (NIIT) assumptions
- LP/GP tax allocations
- Estimated investor tax reserves
- After-tax investor cash flow analysis
Users can adjust applicable tax parameters to explore how different assumptions affect estimated investment outcomes.
Important: These are simplified financial-modeling estimates, not a complete US tax compliance system. The workbook does not prepare Form 1065, Schedule K-1 or investor tax returns.
✅ 6. FINANCIAL MODEL CHECKS & QUALITY CONTROLS
The workbook includes dedicated assurance modules designed to improve transparency and support model review.
Model Integrity Features:
- Debt balance reconciliation
- Portfolio NAV consistency
- Financial cash-flow checks
- Acquisition and exit timing controls
- Property value and debt indicators
- LP/GP distribution reconciliation
- Investor capital continuity checks
- Tax allocation reconciliation
- Depreciation and tax-basis controls
- Separate underwriting risk indicators
The MODEL CHECKS and FUND TAX QA worksheets help users identify calculation inconsistencies and assumptions requiring further review.
Financial risk warnings are deliberately separated from model integrity results.
A PASS status confirms only the relevant encoded reconciliation checks. It does not guarantee investment profitability, financing suitability or complete accounting and tax compliance.
📦 7. WHAT’S INCLUDED
FILE 1 — REAL ESTATE PORTFOLIO INVESTMENT MODEL (.XLSX)
One fully editable Excel financial model containing:
- 18 integrated worksheets
- 10-year annual investment forecast
- Capacity for up to 50 properties
- 15 fictional illustrative example assets
- 10 native Excel charts
- Property-level operating and investment projections
- Portfolio reporting and performance analysis
- Debt amortization and refinancing calculations
- Property valuation and sensitivity analysis
- Base, Upside and Downside scenarios
- LP/GP distribution waterfall
- Investor return calculations
- Configurable US tax estimates
- Model integrity and fund/tax reconciliation controls
FILE 2 — COMPLETE HOW-TO-USE GUIDE (.PDF)
A professional 28-page English-language operating manual featuring:
- Step-by-step model setup
- Workbook navigation and input instructions
- Property configuration
- Rental operations and financing guidance
- Scenario analysis explanations
- Portfolio reporting instructions
- LP/GP waterfall methodology
- Tax-estimation module guidance
- Financial control explanations
- Troubleshooting
- Financial modeling glossary
- Final user review checklist
Both purchased files are supplied together in one downloadable ZIP package.
8. WHO IS THIS MODEL FOR?
Designed for:
- Real Estate Investors
- Property Acquisition Analysts
- Asset and Portfolio Managers
- Investment Analysts
- Real Estate Investment Teams
- Private Equity and Fund Sponsors
- Real Estate Financial Consultants
- Investment Committees
- Property and Finance Advisers
The workbook is particularly suitable for professionals seeking a transparent framework to assess multiple real estate investments, understand portfolio cash flows and evaluate investor distribution economics.
9. HOW TO USE
STEP 1 — Review START HERE
Create a working copy of the Excel workbook and familiarize yourself with its navigation, assumptions and financial modeling structure.
STEP 2 — Configure the Model
Set the forecast start year, reporting selections, valuation method and investment scenario.
STEP 3 — Customize Your Properties
Replace the 15 fictional examples with your own assumptions and populate additional prepared property slots where required.
STEP 4 — Configure Investor & Tax Assumptions
Adjust LP/GP participation, preferred returns, optional catch-up, promote sharing and illustrative tax assumptions.
STEP 5 — Analyze Portfolio Performance
Review the Executive Dashboard, individual property reports, consolidated financial results, diversification and investor returns.
STEP 6 — Review Financial Controls
Investigate model integrity checks, financing indicators and investment risk warnings before relying on the calculations for decision-making.
10. TECHNICAL SPECIFICATIONS
- Product: Real Estate Portfolio Investment Financial Model
- Forecast Horizon: 10 Annual Periods
- Property Capacity: 50 Assets
- Illustrative Sample Data: 15 Properties
- Worksheets: 18
- Native Excel Charts: 10
- Operating Scenarios: Base, Upside, Downside
- Investor Analysis: LP/GP Waterfall and Investor Returns
- Tax Analysis: Configurable US Tax Estimates
- Documentation: 28-Page English PDF Guide
- File Format: Microsoft Excel (.xlsx)
- Recommended Software: Microsoft Excel Desktop
- VBA / Macros: Not Required
- External Excel Links: Not Required
- Delivery: Digital ZIP Download
Software Compatibility: Microsoft Excel Desktop is recommended. Google Sheets import and functional compatibility have not been independently verified. Equivalent formula calculations, charts, navigation, dropdowns and formatting are therefore not guaranteed.
The currency setting changes the display label only and does not perform automatic foreign-exchange conversion.
11. MODEL LIMITATIONS & IMPORTANT DISCLAIMER
This is an illustrative annual investment cash-flow model, not a monthly rent-collection application or a complete statutory accounting package.
The workbook includes fictional example properties and sample financial results intended to demonstrate model functionality. These examples do not constitute verified real estate market assumptions, investment recommendations or guaranteed financial outcomes.
Financing, valuation, LP/GP distribution and tax calculations incorporate simplified financial-modeling conventions that may not reflect all conditions of a specific transaction, partnership agreement or jurisdiction.
The workbook is not a certified property valuation, lender-approved underwriting solution, audited accounting system or US tax filing application.
Users should replace the example assumptions with independently verified information and seek appropriate investment, legal, accounting and tax advice before making real-world decisions.
ACQUIRE. OPERATE. FINANCE. DISTRIBUTE. ANALYZE.
One Connected Excel Model for Professional Real Estate Portfolio Analysis and LP/GP Investor Economics.
SheetworksStudio | Professional Financial Modeling Templates
Similar ProductsOther customers were also interested in...



 eFinancialModels
Electric Vehicle (EV) Charging Station Financial M...
With this comprehensive 5- or 10-year monthly tool, investors can assess the viability of setting up... Read more

Financial Model for Mobile App | Mobile App Busine...
The Mobile App Financial Plan Template in Excel allows you to develop financial projections when lau... Read more

 HenrySheykin
Food Truck Financial Model Excel Template
The Food Truck Financial Model helps entrepreneurs, founders, business owners, consultants, and anal... Read more

Green Hydrogen Production from Wind Energy Financi...
The Green Hydrogen from Wind Financial Model aims to comprehensively forecast a horizon of 40 years ... Read more

Simple Mutual Non-Disclosure Agreement Template
Protect your business secrets with ease using our Simple Mutual Non-Disclosure Agreement Template. S... Read more

Solar Energy Financial Model
The Solar Energy Financial Model Spreadsheet Template in Excel assists you in preparing a sophistica... Read more

 Peter Graf
The Customer-Centric Financial Model for Restauran...
Starting a restaurant without a financial plan is like driving a car blindfolded. You wouldn´t do i... Read more
You must log in to submit a review.