
0 ITEMS

Potato Chips Factory Business Plan Financial Model Excel Template
The Potato Chip Manufacturing Financial Model Template helps users turn a snack production concept into a structured financial forecast built around the realities of a chip manufacturing plant. Instead of relying on a generic spreadsheet, this model focuses on the drivers that matter for potato chip production, including product mix, batch volume, raw ingredient costs, packaging, freight, capital equipment, staffing, and operating overhead. It gives entrepreneurs, founders, business owners, consultants, and analysts a practical way to estimate how a potato chip business may perform before committing major capital. This template is designed for financial planning, business plan preparation, investor presentations, lender discussions, and internal decision-making. Users can customize revenue assumptions for different chip varieties, adjust pricing and unit volume, estimate startup costs, review operating expenses, plan payroll, and understand the impact of cost of goods sold on gross margin and profitability. The model helps connect commercial strategy with production economics, showing how changes in sales volume, raw material costs, packaging costs, distributor fees, or staffing levels may affect long-term results. For a manufacturing business, cash flow can be just as important as profit. This financial model helps users forecast monthly and annual cash flow, assess funding needs, evaluate capital expenditure timing, and identify potential liquidity pressure before it becomes a problem. It also supports profitability analysis, break-even analysis, and scenario planning so users can compare low, base, and high cases rather than depending on a single forecast. These outputs are especially useful when preparing funding documents, validating a launch plan, or deciding whether to scale production capacity. The Potato Chip Manufacturing Financial Model Template is fully editable and ready to use in Excel or Google Sheets, making it suitable for both startup planning and expansion analysis. It includes structured assumptions, professional outputs, investor-friendly reports, visual charts, KPI tracking, and financial statements that can be adapted to a specific market, currency, operating model, or growth strategy. By organizing the key financial drivers in one place, the template saves time, improves clarity, and helps users make better decisions about pricing, production, capital investment, profitability, and business sustainability.


Financial Model Overview
The Potato Chip Manufacturing Financial Model Template is a ready-to-use planning tool designed for entrepreneurs, founders, business owners, consultants, and analysts who need to evaluate the financial potential of a potato chip manufacturing business. It is built around the practical economics of snack production, including unit sales, flavor mix, ingredient costs, packaging, production capacity, freight, distributor commissions, staffing, startup capital expenditures, and ongoing operating expenses.
Rather than forcing users to build a complex forecast from scratch, the template provides a structured framework for estimating revenue, cost of goods sold, cash flow, profitability, funding needs, and investor returns over a multi-year forecast period. For anyone preparing a business plan, pitch deck, bank loan application, investment memo, or internal budget, this model helps translate assumptions into organized financial projections that can support clearer decision-making.
All-in-One Dashboard
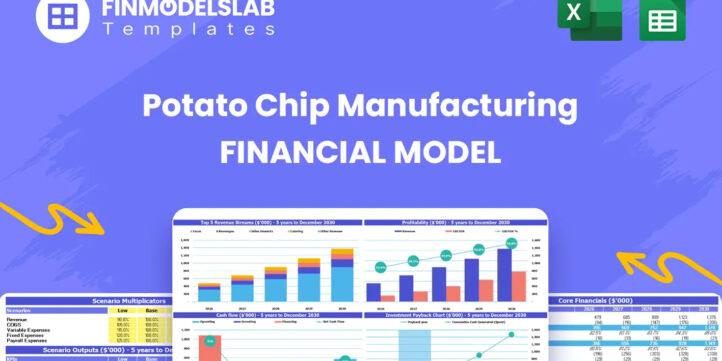
The all-in-one dashboard brings the most important inputs and outputs of the Potato Chip Manufacturing Financial Model into one central view, helping users understand the business quickly without searching through multiple worksheets. This component is designed to summarize core assumptions such as production volume, pricing, revenue growth, cost structure, capital investment, and operating expense levels, while also displaying major outputs such as total revenue, EBITDA, cash balance, net income, investor returns, and break-even timing.
For a potato chip manufacturing company, this is especially useful because performance depends on many connected drivers, including batch production levels, unit costs for potatoes and cooking oil, packaging expense, labor efficiency, and retail or distributor sales channels. The dashboard gives founders and advisors a practical control center where they can update assumptions, review results, and see whether the projected business plan remains financially realistic. It is also valuable for stakeholder presentations because it condenses the financial model into a more accessible format, making it easier to explain the economics of the plant, the scale of expected sales, the level of capital required, and the expected path toward profitability.
Low, Base, and High Scenario Analysis
The low, base, and high scenario analysis section helps users evaluate how the potato chip manufacturing business may perform under different market and operating conditions. Instead of relying on a single forecast, users can test multiple outcomes by changing assumptions such as unit sales growth, average selling price, raw material inflation, production efficiency, packaging cost, distributor commissions, payroll levels, and capital expenditure timing.
A low case may reflect slower retail adoption, higher ingredient costs, or lower plant utilization, while a base case may represent the expected plan, and a high case may reflect stronger demand, better pricing, or improved operating leverage. The outputs from this component help users compare revenue, gross margin, EBITDA, cash flow, profitability, and funding requirements across different scenarios. This is particularly important in food manufacturing because small changes in production volume or variable cost per unit can have a major effect on margins.
By using scenario analysis, founders can stress-test the model, understand downside risk, identify growth opportunities, and prepare more credible financial plans for investors, lenders, or internal decision makers.
Professional Charts
The professional charts section converts the financial model’s key outputs into clear visual reports that can be used for analysis, presentations, business plans, and investor discussions. These charts may display trends in revenue, gross profit, EBITDA, net income, cash flow, cost of goods sold, operating expenses, and other important financial metrics over the forecast period. For a potato chip manufacturing company, visual reporting helps users quickly see how scaling production volume affects revenue growth, how cost structure changes over time, and whether profitability improves as fixed costs are spread across more units.
Charts can also make it easier to communicate financial results to stakeholders who do not want to review detailed spreadsheet tabs line by line. Instead of explaining every formula, users can present a chart showing the forecasted revenue trajectory, margin improvement, or cash balance trend. This component supports better decision-making by making complex financial information more understandable, helping users identify performance patterns, spot potential cash constraints, and communicate the business opportunity in a polished and professional way.
ROE Components and DuPont Analysis
The ROE components and DuPont analysis section helps users evaluate the quality of financial performance by breaking return on equity into the drivers that influence it. In a potato chip manufacturing business, investor returns are shaped not only by net profit but also by asset utilization, cost efficiency, leverage, and the amount of equity required to fund equipment, factory build-out, working capital, and growth. This component may analyze profit margin, asset turnover, and equity multiplier to show how the business generates returns from its operating model and capital structure. Users can review how changes in pricing, production efficiency, fixed asset investment, inventory levels, or financing strategy affect return on equity.
For investors and lenders, this type of analysis provides a deeper view of the business beyond simple revenue growth. It helps show whether the company is generating strong returns because of healthy margins, efficient use of assets, appropriate use of financing, or a combination of these factors. For founders, the section is useful for understanding which levers can improve returns, such as optimizing equipment utilization, reducing waste, controlling overhead, or improving sales mix toward higher-margin premium chip products.
Revenue Inputs
The revenue inputs section is where users define the commercial assumptions that drive the sales forecast for the potato chip manufacturing business. This component may include product lines such as sea salt chips, black pepper chips, and premium flavors, along with assumptions for unit volume, average selling price, annual growth, sales mix, production ramp-up, and potential channel differences. Because revenue in chip manufacturing depends on both volume and price, this section allows users to model how many units are expected to be sold, what each product is expected to sell for, and how demand may grow as distribution expands.
It can also support assumptions for retail, wholesale, distributor, or direct-to-consumer sales, depending on the user’s strategy. The outputs from this section feed into the revenue forecast, gross margin calculations, cash flow projections, and profitability analysis. For planning purposes, this component is essential because it connects the market strategy to the financial model. Users can test whether their proposed sales volumes are sufficient to cover fixed factory overhead, whether premium products improve margins, and how sensitive total revenue is to pricing decisions or changes in product mix.
Bank-Ready Reports
The bank-ready reports section provides lender-friendly financial outputs that can support financing discussions, loan applications, and formal business planning. A potato chip manufacturing company may require substantial upfront investment for production line equipment, packaging machinery, factory renovation, working capital, inventory, and early operating expenses, so lenders typically need a clear view of projected income, cash flow, assets, liabilities, debt capacity, and repayment ability.
This component organizes financial results into professional reports such as income statement projections, cash flow forecasts, balance sheet summaries, debt schedules, and key profitability metrics. It helps users present the business in a structured format that is easier for banks, credit committees, investors, or grant reviewers to evaluate.
The section may also show how operating cash flow supports debt service, how much funding is required at launch, and whether the business maintains adequate liquidity after major capital expenditures. For founders and business owners, these reports reduce the time needed to prepare financial documentation and improve the credibility of funding requests by showing a clear link between assumptions, financial statements, and repayment potential.
Revenue Breakdown
The revenue breakdown section provides a detailed view of how total sales are generated across different product streams, flavors, package types, or channels. In a potato chip manufacturing business, total revenue may come from several product categories with different price points and margins, such as classic chips, seasoned chips, premium flavors, private-label products, wholesale accounts, distributor sales, or direct retail sales. This component helps users separate those revenue streams so they can see which products contribute the most to total income and which may offer the strongest profit potential.
Inputs may include unit sales by product, selling price by product, growth assumptions, seasonal demand changes, and planned changes in product mix over time. Outputs may show revenue contribution, percentage of total sales, year-over-year growth, and the effect of shifting volume toward premium or higher-margin products.
This is useful for decision-making because it allows users to identify the most valuable parts of the business, refine production priorities, support pricing discussions, and build a stronger sales strategy. It also makes the forecast more transparent for investors and lenders by showing exactly how revenue is expected to be earned rather than presenting one undifferentiated sales number.
KPI Dashboard
The KPI dashboard tracks the performance metrics and benchmarks that matter most for a potato chip manufacturing business. This component may include financial and operational indicators such as gross margin, EBITDA margin, net profit margin, revenue growth, cost of goods sold as a percentage of revenue, average revenue per unit, production volume, operating expense ratio, cash balance, return on equity, and break-even status. It can also support comparison against internal targets or industry benchmarks, helping users evaluate whether the forecast is realistic and competitive.
For a snack food manufacturer, KPIs are important because profitability depends on managing both production efficiency and market performance. If raw material costs rise, packaging expenses increase, or distributor fees reduce net revenue, the KPI dashboard can help users see how margins are affected. If production volume grows faster than overhead, the dashboard can show improving operating leverage. This section is useful for regular performance review, investor reporting, management meetings, and strategic planning because it gives users a concise view of business health. It helps translate detailed financial statements into practical metrics that support faster and more informed decisions.
Startup Cost and CapEx Planning
The startup cost and CapEx planning section helps users estimate the initial investment required to launch or expand a potato chip manufacturing operation. This component may include production line equipment, fryers, slicers, seasoning systems, packaging machinery, quality control equipment, factory build-out, renovation, installation, licenses, deposits, initial inventory, pre-opening payroll, marketing, and working capital reserves. Because manufacturing businesses often require significant upfront capital before revenue begins, this section is critical for understanding the full funding requirement and avoiding undercapitalization.
Users can adjust the timing and cost of major capital items, compare purchase versus leasing assumptions, and evaluate how investment decisions affect depreciation, cash flow, and financing needs. The outputs from this section feed into the balance sheet, cash flow forecast, funding plan, and profitability projections. For business planning, this component helps founders create a realistic launch budget and prepare better investor or lender discussions. It also supports strategic decisions about whether to begin with a smaller production line, phase equipment purchases over time, or invest upfront in capacity that can support faster growth.
Break-Even Analysis
The break-even analysis section helps users identify when the potato chip manufacturing business is expected to become profitable and what level of sales is required to cover fixed and variable costs. This component may use assumptions for selling price per unit, variable cost per unit, gross margin, monthly fixed expenses, payroll, rent, utilities, insurance, administrative costs, and production overhead. It can calculate the revenue or unit volume needed to cover the cost structure, as well as the projected month when the business moves from loss to profit.
For a chip manufacturing plant, break-even analysis is especially useful because the business may have high fixed costs from equipment, facilities, and staffing, while margins depend heavily on ingredient cost, packaging cost, and production efficiency. Users can test how break-even changes if raw materials increase, pricing changes, production volume falls, or premium products become a larger share of sales. This section supports funding preparation, pricing strategy, cost control, and launch planning because it shows the practical sales target required for sustainability. It also helps investors and lenders evaluate whether the projected path to profitability is reasonable based on the company’s assumptions.
Built for Practical Financial Planning
The Potato Chip Manufacturing Financial Model Template is designed to help users move from rough business idea to organized financial forecast with less time, more structure, and clearer assumptions. It combines product-level revenue planning, manufacturing cost logic, startup investment analysis, operating expense forecasting, financial statements, cash flow planning, investor metrics, scenario testing, and visual reporting into one editable model.
Users can adapt the template for a new chip brand, a regional snack manufacturer, a private-label production facility, or an expansion of an existing food production company. The model is compatible with Excel and Google Sheets, allowing users to customize inputs, collaborate with advisors, and update projections as new information becomes available.
Similar ProductsOther customers were also interested in...


 HenrySheykin
Micro Distillery Business Plan Financial Model Exc...
The Micro-Distillery Financial Model helps founders, operators, consultants, analysts, and business ... Read more
Juice Production Business Plan Financial Model Exc...
The Fruit Juice Concentrate Production Financial Model helps users turn a capital-intensive beverage... Read more
Brewery Business Plan Financial Model Excel Templa...
The Brewery Financial Model helps founders, brewery operators, consultants, and analysts turn a brew... Read more

 David
David
Manufacturing Startup/Existing Business Financial ...
3 statement 5 year rolling financial projection Excel model for a startup /existing manufacturing bu... Read more

 eFinancialModels
Liquor Distillery Financial Plan Template
Distilleries, with their rich history of crafting spirits, have experienced a resurgence in populari... Read more
 Giorgos
Microbrewery – 10 Year Financial Model
Financial Model providing a dynamic up to 10-year financial forecast for a startup or existing Micro... Read more
Fruit Processing Facility – 10 Year Financia...
Financial Model providing a dynamic up to 10-year financial forecast for a startup Fruit Processing ... Read more
Manufacturing Financial Model Templates Bundle
This is a collection of financial model templates in Excel for businesses in the Manufacturing indus... Read more
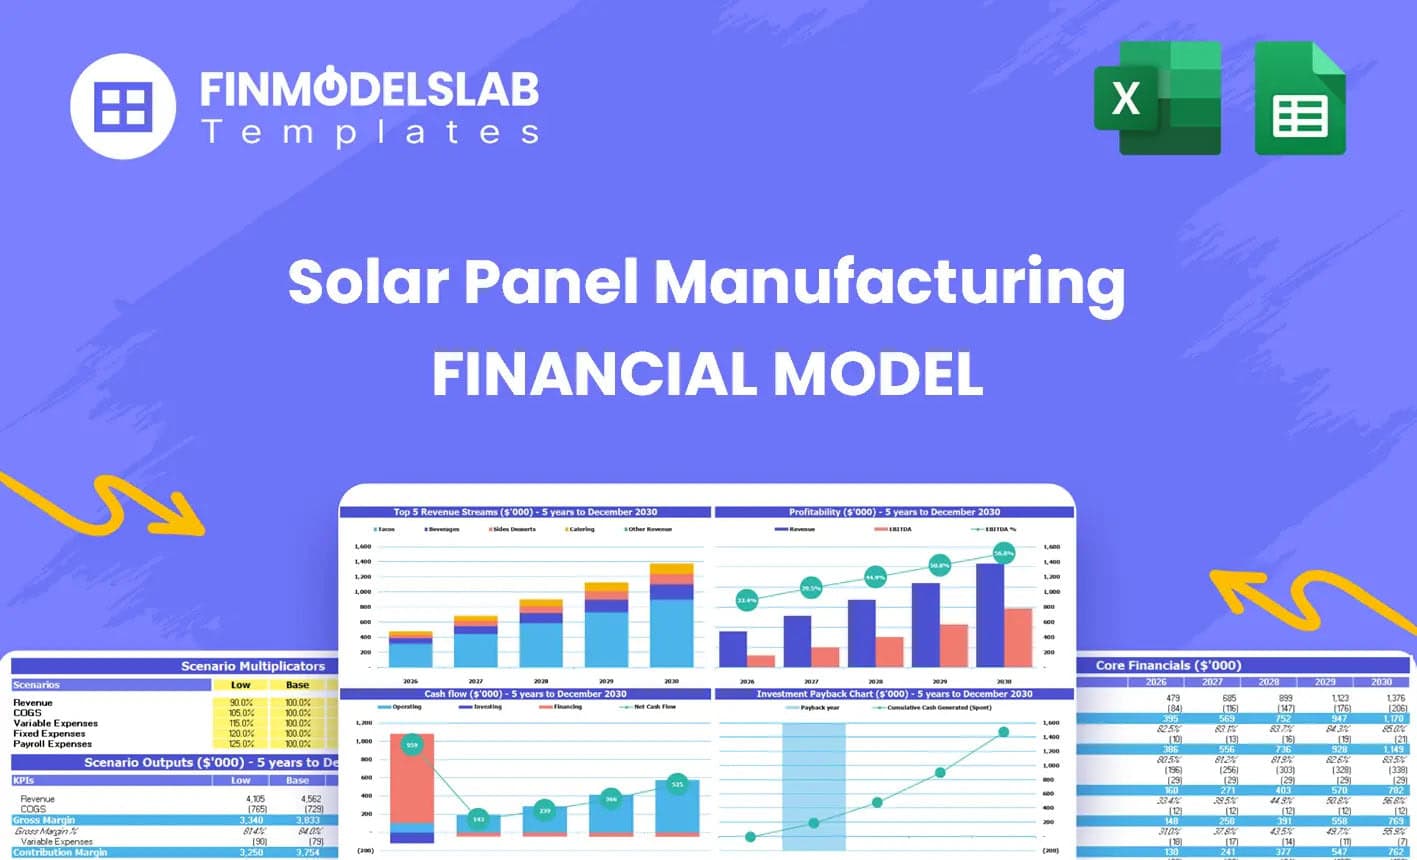
Solar Panel Manufacturing Plant Business Plan Fina...
The Solar Panel Manufacturing Financial Model helps users turn a solar factory concept into a struct... Read more

Fast Casual Restaurant Financial Model Excel Templ...
The Fast Casual Restaurant Financial Model helps entrepreneurs, restaurant owners, consultants, anal... Read more
You must log in to submit a review.