
0 ITEMS

Nursing Home Financial Model Excel Template
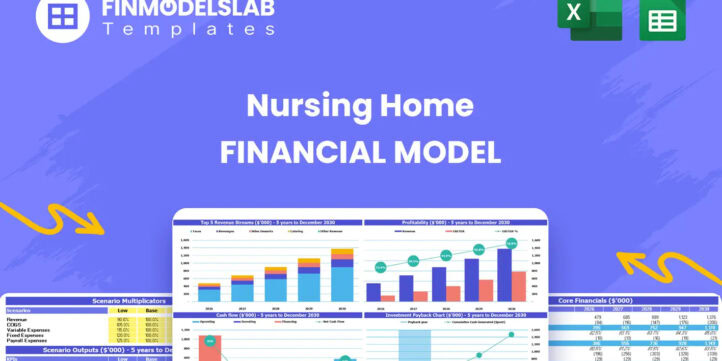
The Nursing Home Financial Model helps users turn a senior care facility concept into a structured, editable financial forecast. It is designed to support financial planning for a new nursing home, assisted living facility, skilled nursing operation, or long-term care business by organizing revenue assumptions, startup costs, operating expenses, payroll, capital expenditures, cash flow, and profitability into one practical model. Instead of trying to build complex projections from scratch, users can begin with a ready-to-use template that reflects the key financial drivers of a nursing home, including resident occupancy, monthly care fees, service mix, staffing requirements, and the cost structure needed to operate a compliant care environment. This template is useful for entrepreneurs, business owners, consultants, financial analysts, founders, and teams preparing business plans, feasibility studies, lender packages, or investor presentations. Nursing homes are capital-intensive businesses, and early decisions about facility size, resident pricing, payroll, equipment, working capital, and care levels can have a major impact on long-term sustainability. The model helps users estimate how much capital may be required before opening, how monthly revenue may build as occupancy grows, and how operating expenses may affect margins during the ramp-up period. It also supports decision-making by showing the relationship between assumptions and results, helping users understand whether the business can reach sustainable profitability. The Nursing Home Financial Model includes structured forecasting for revenue, expenses, cash flow, funding needs, profitability, and break-even analysis over a multi-year planning period. Users can adjust assumptions to reflect their own market, facility capacity, resident mix, care tiers, pricing strategy, staffing plan, supplier costs, and growth timeline. The template is built to make financial outputs easier to review, with dashboards, charts, scenario analysis, and lender-friendly reports that help communicate the business case clearly to stakeholders. For users raising capital or applying for financing, the template provides a professional way to present financial projections with transparent assumptions and organized outputs. For internal planning, it helps identify cash gaps, evaluate break-even timing, test different revenue and expense scenarios, and refine operating decisions before committing funds. Whether used for launch planning, expansion analysis, budgeting, or investor discussions, this financial model template gives nursing home planners a practical framework for forecasting performance and making better financial decisions.


![Spreadsheet screenshot of Startup Costs (CAPEX) with category list and amounts for 2025–2026 (informational).] , but need proper JSON properly](https://www.efinancialmodels.com/wp-content/uploads/edd/2026/05/nursing-home-financial-model-capex-financialmodelslab_3f7491a3-d46b-4794-b647-721899068fc0-scaled.jpg "nursing-home-financial-model-capex-financialmodelslab_3f7491a3-d46b-4794-b647-721899068fc0 | eFinancialModels")


Financial Model Overview
The Nursing Home Financial Model is a ready-to-use financial model template created for planning, analyzing, and presenting the economics of a nursing home or long-term care facility. It helps users estimate how the business may perform based on resident occupancy, service tiers, monthly care fees, staffing levels, startup investment, operating expenses, cash flow, profitability, and funding needs. Nursing homes require careful financial planning because they combine high upfront capital requirements with recurring payroll, compliance, medical supply, food, insurance, maintenance, and resident care costs.
This template gives entrepreneurs, operators, consultants, analysts, and business plan writers a structured way to build a five-year forecast without starting from a blank spreadsheet. It is fully editable, compatible with Excel and Google Sheets, and designed to support lender discussions, investor presentations, feasibility studies, internal budgeting, and operational decision-making.
By connecting assumptions with professional financial outputs, the model helps users understand not only what a nursing home could earn, but also how much cash it may require, when it may become profitable, and which assumptions have the greatest impact on long-term sustainability.
All-in-One Dashboard
The all-in-one dashboard brings the most important inputs and outputs of the Nursing Home Financial Model into one central planning view. This component helps users quickly review the business case by showing core assumptions such as resident capacity, occupancy ramp-up, service mix, average monthly fees, staffing expectations, startup investment, operating expenses, and financing assumptions alongside key outputs such as revenue, EBITDA, net income, cash balance, funding gap, and return metrics.
For a nursing home business, this dashboard is especially useful because the economics depend on several connected drivers, including the number of residents in each care tier, the level of payroll needed to support safe operations, and the fixed costs required to keep the facility running. Instead of searching through multiple tabs to understand the model, users can use the dashboard to see whether the assumptions create a financially viable plan.
It also helps business owners and advisors spot early warning signs, such as negative cash balances, weak margins, or an occupancy level that is too low to support payroll and facility overhead. For presentations, the dashboard provides a concise summary that can be shared with lenders, investors, partners, or internal decision-makers, making it easier to explain the financial logic behind the business plan.
Low, Base, and High Scenario Analysis
The Low, Base, and High scenario analysis section allows users to test how the nursing home forecast changes under different operating conditions. This component is built around the idea that a long-term care facility may not perform exactly as planned, especially during the early ramp-up period when occupancy, staffing, marketing performance, and resident mix can vary significantly.
Users can compare a conservative case with slower resident acquisition, lower occupancy, higher payroll costs, or weaker ancillary revenue against a base case and a more optimistic high case with stronger demand, better pricing, or faster stabilization. The model then shows how these assumptions affect revenue, operating expenses, EBITDA, cash flow, profitability, and funding requirements.
This is valuable for planning because nursing home operators need to know what happens if occupancy takes longer to build, if skilled nursing demand is lower than expected, or if labor costs rise faster than anticipated. It can also support funding discussions by showing lenders and investors that the user has considered risk, not just upside. By reviewing several scenarios before launch or expansion, decision-makers can identify the minimum viable occupancy level, set more realistic working capital targets, and prepare contingency plans for adverse conditions.
Professional Charts
The professional charts component converts the financial forecast into clear visual reports that are easier to interpret and present. Nursing home financial models can include many rows of revenue, payroll, expenses, capital expenditures, cash flow, and profitability calculations, which may be difficult for stakeholders to review in raw spreadsheet form.
The charts help simplify that information by displaying trends such as annual revenue growth, monthly cash movement, expense composition, EBITDA progression, net income, resident occupancy development, and key profitability indicators. This is useful for business planning because it helps users visually identify patterns that may not be obvious from numbers alone, such as a cash shortfall during the ramp-up period, a margin improvement after occupancy stabilizes, or a large expense category that needs closer review.
The charts are also useful when presenting the Nursing Home Financial Model to lenders, investors, partners, board members, or senior management because they make the financial story easier to follow. Instead of relying only on detailed spreadsheets, users can support their pitch or funding documents with presentation-ready visuals that show how the facility is expected to grow, when it may reach profitability, and how the underlying cost structure changes over time.
ROE Components and DuPont Analysis
The ROE components and DuPont analysis section helps users understand the drivers behind return on equity rather than looking at a single return percentage in isolation. In a nursing home business, return on equity can be influenced by profitability, asset utilization, leverage, capital expenditures, debt structure, and the timing of cash recovery.
This component breaks down return performance into more detailed elements so users can see whether returns are being driven by operating margins, revenue efficiency, financing structure, or balance sheet assumptions. Inputs may include projected net income, equity invested, debt balances, total assets, revenue, margins, and other financial statement outputs generated by the model. The resulting analysis helps investors and owners evaluate whether the facility is producing an acceptable return relative to the capital required to launch and operate it.
It is particularly relevant for nursing homes because they often require significant investment in facility setup, resident room furnishings, medical equipment, kitchen and dining equipment, technology systems, and working capital before revenue reaches full potential. By understanding the components of ROE, users can identify whether improving pricing, increasing occupancy, controlling costs, optimizing the service mix, or adjusting the financing structure may have the greatest impact on returns. This makes the analysis useful for both investor evaluation and strategic decision-making.
Revenue Inputs
The revenue inputs section provides the foundation for forecasting nursing home income based on realistic operating assumptions. This component allows users to enter or edit key revenue drivers such as resident capacity, occupancy ramp-up, number of residents by service tier, monthly fees, care levels, ancillary service charges, pricing increases, and the mix between base residency, assisted living support, skilled nursing care, and additional resident services. Because nursing home revenue is typically driven by recurring monthly fees and the level of care each resident requires, this section helps users model the business in a way that reflects actual operations.
For example, a resident receiving basic accommodation may generate a different monthly fee than a resident requiring skilled nursing services, and the model can show how changes in the service mix affect total revenue and margins. The revenue inputs are also useful for testing pricing strategies, local market assumptions, occupancy targets, and growth plans. Users can adjust assumptions to reflect their own facility size, location, payer expectations, resident acquisition timeline, or service offering. These inputs then flow through the financial model to generate revenue forecasts, profitability projections, cash flow outputs, and break-even calculations, making the section essential for building a credible and customized nursing home business plan.
Bank-Ready Reports
The bank-ready reports component organizes the financial outputs into a format that is suitable for lenders, investors, and professional stakeholders. When seeking financing for a nursing home, users need to present more than a simple revenue estimate. Banks and funding partners typically want to understand startup costs, capital expenditures, working capital needs, projected income statements, cash flow forecasts, balance sheet movement, break-even timing, debt service ability, and the assumptions behind the forecast.
This section helps bring those outputs together in a clean and structured way so the business case can be reviewed efficiently. The reports may include monthly and annual projections, profit and loss summaries, cash flow statements, investment requirements, financing assumptions, repayment capacity, and key metrics such as EBITDA, net income, payback period, and cash balance.
For a nursing home, this is particularly important because the lender will want to see whether the facility can survive the occupancy ramp-up period and generate enough cash to support operating expenses and debt obligations. By presenting financial projections in a lender-friendly format, the model helps users prepare for loan applications, investor meetings, grant discussions, partnership reviews, or internal approval processes with greater confidence and clarity.
Revenue Breakdown
The revenue breakdown section gives users a detailed view of how total nursing home income is generated across different revenue streams. Rather than showing one blended revenue number, this component separates the major sources of income so users can understand the contribution of each service category. It may include base residency fees, assisted living service fees, skilled nursing care fees, ancillary services, specialized care add-ons, and other recurring or usage-based charges.
This level of detail is useful because the profitability of a nursing home can depend heavily on the resident mix. A facility with more residents requiring skilled nursing care may generate higher revenue, but it may also require higher staffing, medical supplies, and compliance-related costs. A facility with a larger share of base residency services may have lower average revenue per resident but potentially different margin characteristics.
By breaking revenue into clear streams, the model helps users analyze pricing, service mix, occupancy strategy, and average revenue per resident. It also helps investors and lenders see where projected income is coming from and whether those assumptions are reasonable. Users can use this component to evaluate how adding services, increasing ancillary charges, changing care tiers, or adjusting monthly rates may improve total revenue and long-term financial performance.
KPI Dashboard and Benchmark Metrics
The KPI dashboard and benchmark metrics section helps users monitor the financial and operational indicators that matter most for a nursing home. This component may track measures such as occupancy rate, average revenue per resident, revenue by care tier, EBITDA margin, payroll as a percentage of revenue, operating expense ratio, cash balance, break-even timing, payback period, return on equity, and other senior care performance metrics.
It can also help compare selected outputs against relevant industry benchmarks, giving users context for whether their assumptions and results appear realistic. For example, if payroll is too high relative to revenue, the model may signal that staffing levels, wage assumptions, or occupancy targets need to be reviewed. If the EBITDA margin improves only after a long delay, the user can investigate whether pricing, resident acquisition, or fixed costs are limiting performance.
This dashboard is valuable for both planning and ongoing management because it translates the financial model into measurable indicators that can guide decisions. For funding presentations, KPI metrics can also make the forecast easier to discuss by highlighting the facility’s expected financial health, efficiency, and sustainability. By focusing attention on the numbers that drive performance, the KPI dashboard helps users move from spreadsheet outputs to practical business decisions.
Break-Even Analysis
The break-even analysis component helps users identify when the nursing home is expected to generate enough revenue to cover its fixed and variable operating costs. This section uses assumptions such as monthly resident fees, occupancy levels, service mix, payroll, rent or facility costs, utilities, food, medical supplies, insurance, maintenance, marketing, administrative expenses, and other recurring costs to estimate the point at which the business stops operating at a loss. For a nursing home, break-even timing is a critical planning milestone because the facility may incur substantial expenses before occupancy reaches a stable level.
The model can help users understand how many residents are needed to cover monthly costs, how long the ramp-up period may last, and how sensitive break-even timing is to pricing, payroll, and resident acquisition. This is useful for lenders because it shows when the business may begin generating enough operating cash to support debt service. It is also useful for owners because it helps determine how much working capital may be needed before the business becomes self-sustaining. By reviewing the break-even analysis, users can make more informed decisions about marketing intensity, opening timeline, staffing schedules, care tier pricing, and cost control measures that may help the facility reach profitability sooner.
Startup Costs and Funding Requirements
The startup costs and funding requirements section helps users estimate the initial investment needed to open or expand a nursing home facility. This component may include resident room furnishings, medical equipment, kitchen and dining equipment, community area furnishings, technology systems, licensing, legal and professional fees, facility improvements, deposits, pre-opening payroll, initial marketing, insurance, working capital, and other launch-related costs.
Nursing homes often require significant capital before they can admit residents, and underestimating these needs can create serious cash flow problems early in the project. This section helps users create a detailed startup budget and connect that budget to the broader financial forecast.
Similar ProductsOther customers were also interested in...


 HenrySheykin
Skin Care Financial Model Excel Template
The Skin Care Clinic Financial Model helps entrepreneurs, clinic owners, consultants, analysts, and ... Read more

 Giorgos
Speech Therapy Center – 5 Year Financial Model
Financial Model providing an advanced 5-year financial plan for a startup or operating Speech Therap... Read more
Spa Financial Model Excel Template
The Spa Financial Model helps entrepreneurs, spa owners, consultants, analysts, and business planner... Read more
Mental Health Center Financial Model Excel Templat...
The Mental Health Clinic Financial Model helps users build a structured financial forecast for a the... Read more
Outpatient Clinic Financial Model Excel Template
The Outpatient Clinic Financial Model helps users turn a clinic business concept into a structured, ... Read more
Drug Rehab Clinic Financial Model Excel Template
The Drug and Alcohol Rehab Center Financial Model helps users turn a treatment facility concept into... Read more

Home Health Care Financial Model Excel Template
The Home Health Care Agency Financial Model helps users turn a care services business plan into a st... Read more

Orthopedic Center Financial Model Excel Template
The Orthopedic Clinic Financial Model helps users build a structured five-year forecast for a capita... Read more

Chiropractic Center Financial Model Excel Template
The Chiropractic Clinic Financial Model helps users turn a clinic concept, launch plan, or expansion... Read more

Ambulance Service Financial Model Excel Template
The Ambulance Service Financial Model is a ready-to-use financial model template designed to help en... Read more
You must log in to submit a review.