
0 ITEMS

Italian Restaurant Financial Model Excel Template
The Italian Restaurant Financial Model helps users turn a restaurant concept into a structured five-year financial forecast. It is designed for entrepreneurs, founders, restaurant owners, consultants, analysts, and business plan writers who need a practical way to estimate revenue potential, startup costs, operating expenses, payroll, cash flow, profitability, and funding needs before opening, expanding, or presenting the business to stakeholders. Instead of building a restaurant forecast from scratch, users can start with a ready-made model tailored to an Italian restaurant concept and customize the assumptions to reflect their own location, menu strategy, customer volume, pricing, and launch plan. This template supports financial planning by connecting the most important restaurant drivers in one organized model. Users can adjust assumptions for daily covers, average check size, revenue streams, cost of goods sold, staffing, rent, marketing, utilities, launch investment, and other operating expenses. The model then helps translate those assumptions into forecasted financial performance, including revenue growth, margin development, cash flow movement, and profit potential. This makes it useful for testing whether a restaurant idea is financially viable, identifying funding gaps, and understanding how operational decisions affect the numbers. The Italian Restaurant Financial Model is also useful for business planning and funding preparation. It provides a clear structure for presenting assumptions, financial statements, investor metrics, performance indicators, and visual outputs in a format that is easier to review with lenders, investors, partners, or internal teams. Users can evaluate profitability, analyze break-even timing, review cash requirements, and compare different planning cases before committing capital. For anyone preparing an Italian restaurant business plan with financial projections, this template helps create a more credible and organized financial story. Because the model is fully editable, it can be adapted for a new fine dining Italian restaurant, a casual trattoria, a premium restaurant with events and memberships, or an established restaurant planning expansion. It works as a decision-making tool as well as a presentation-ready planning document. By combining revenue assumptions, expense planning, startup budgeting, payroll estimates, cash flow forecasting, profitability analysis, and scenario testing, the template gives users a practical foundation for making informed decisions and communicating the financial potential of the business with confidence.
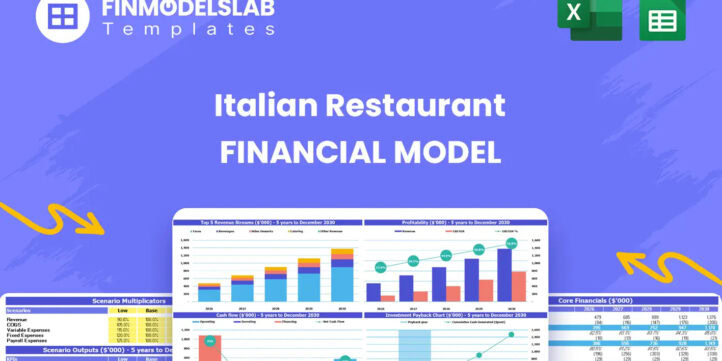


Financial Model Overview
The Italian Restaurant Financial Model is a ready-to-use financial model template created to help entrepreneurs, restaurant owners, consultants, analysts, and business plan writers evaluate the financial potential of an Italian restaurant. It brings together the core assumptions needed to plan revenue, startup investment, operating expenses, payroll, profitability, cash flow, funding needs, and investor returns over a multi-year forecast period. Instead of relying on scattered calculations or building a model from a blank spreadsheet, users can work from a structured template designed around restaurant economics, including customer volume, average spend, food and beverage sales, cost controls, staffing levels, and capital requirements. The model is fully editable, so every assumption can be adapted to a specific concept, location, pricing strategy, service style, or expansion plan. It is useful for preparing an Italian restaurant business plan, reviewing launch feasibility, speaking with lenders, presenting to investors, managing internal budgets, and making better financial decisions before committing significant time and capital.
All-in-One Dashboard
The all-in-one dashboard gives users a central view of the most important inputs and outputs in the Italian Restaurant Financial Model. This section is designed to make the model easier to navigate by combining core assumptions, summary results, and high-level performance indicators in one place. Users can review revenue expectations, expense levels, profitability trends, cash flow position, break-even timing, and other headline metrics without needing to move through every detailed schedule first. The dashboard may draw from assumptions such as daily covers, average check size, revenue mix, cost of goods sold, staffing costs, rent, marketing, and startup investment, then convert those assumptions into concise financial outputs. For planning and decision-making, this component is useful because it gives founders and stakeholders a quick understanding of whether the restaurant plan is financially balanced. It also helps users identify which areas need closer review, such as weak margins, cash pressure, high labor costs, or insufficient sales volume. For investor or lender discussions, the dashboard provides a clean summary that supports faster review and more confident presentation.
Low, Base, and High Scenario Analysis
The low, base, and high scenario analysis component allows users to test how the Italian restaurant may perform under different market conditions and operating assumptions. A base case can represent the expected plan, while a low case can show a more conservative outcome with fewer customers, lower average check size, slower ramp-up, or higher costs. A high case can show the upside potential if the restaurant attracts stronger demand, improves pricing, increases events, grows memberships, or achieves better margins. Inputs may include daily covers, weekend and weekday traffic, average spend per guest, revenue stream mix, cost of goods sold, payroll assumptions, marketing spend, and operating expense growth. The outputs help users compare revenue, EBITDA, net income, cash flow, funding needs, and profitability across scenarios. This is valuable because restaurant performance can be sensitive to small changes in customer volume, pricing, and cost control. Scenario analysis helps founders prepare contingency plans, evaluate risk, set realistic targets, and communicate to investors that the business has been tested beyond a single optimistic forecast. It also supports better decisions about launch timing, staffing, working capital, and growth strategy.
Professional Charts
The professional charts component translates the financial projections into clear visual reports that are easier to understand and present. Instead of relying only on spreadsheet rows and columns, users can review charts that may show revenue growth, gross profit, EBITDA, cash flow, cash balance, expense categories, revenue mix, and key performance trends over the forecast period. These charts are generated from the model’s assumptions and financial statements, allowing users to see how changes in customer volume, pricing, costs, or investment requirements affect the overall outlook. For an Italian restaurant, visual reports are especially useful because stakeholders often want to understand the relationship between sales growth, food and beverage margins, labor costs, and cash flow sustainability. Charts can make it easier to spot patterns, such as whether profitability improves as the restaurant scales, whether cash dips during the early months, or whether certain revenue streams become more important over time. This component is useful for business planning, monthly review meetings, lender packages, investor presentations, and internal decision-making because it helps convert complex financial detail into a concise and presentation-ready format.
ROE Components and DuPont Analysis
The ROE components and DuPont analysis section helps users understand what is driving return on equity in the Italian Restaurant Financial Model. Rather than showing only a single return figure, this component breaks performance into underlying drivers such as profitability, asset efficiency, and financial leverage. It may use inputs and outputs from the income statement, balance sheet, and equity structure, including net income, revenue, total assets, debt, equity, margins, and turnover ratios. For a restaurant business, this can be useful because returns are influenced not only by profit margins but also by how efficiently capital is used for build-out, kitchen equipment, furniture, decor, working capital, and other investments. The analysis helps founders and investors assess whether returns are being created through strong operations, efficient use of assets, or reliance on financing. It also supports more informed conversations about capital structure, expansion planning, and investor expectations. By breaking return on equity into components, the model gives users a more detailed view of financial performance and helps explain how improvements in pricing, cost control, utilization, or asset management can affect long-term value.
Revenue Inputs
The revenue inputs component is where users define the commercial assumptions that drive the Italian restaurant forecast. This section may include weekday covers, weekend covers, average check size, customer growth, seasonality, revenue stream percentages, and assumptions for food sales, beverage sales, cigar sales, memberships, events, or other income categories depending on the concept. These inputs are important because restaurant revenue is usually driven by a combination of traffic, spending per guest, seating capacity, service frequency, and the mix of high-margin and lower-margin items. By separating key revenue drivers, the model allows users to build a forecast that reflects the actual operating logic of the business rather than entering one unsupported sales number. Users can test how changes in covers, pricing, menu strategy, private events, or membership programs affect total sales and profit. This component is useful for business planning because it forces the user to document the assumptions behind the forecast in a transparent way. It also supports funding discussions because lenders and investors can see how revenue was calculated, what assumptions need to be achieved, and where the greatest opportunities or risks may exist.
Bank-Ready Reports
The bank-ready reports component provides structured financial outputs that can be used for lender review, investor packages, partner discussions, and business plan documentation. This section typically brings together key financial statements and summaries, including projected profit and loss, cash flow, balance sheet, revenue forecasts, expense forecasts, profitability metrics, and funding-related outputs. For an Italian restaurant, bank-ready reporting is important because lenders and investors often want to see whether the business can generate enough revenue and cash flow to cover operating expenses, repay debt, support working capital, and reach sustainable profitability. The reports rely on the assumptions entered throughout the model, such as startup costs, revenue drivers, cost of goods sold, payroll, rent, debt financing, and operating expenses. The outputs help users present a consistent financial story instead of separate disconnected calculations. This component is valuable for planning and funding because it helps demonstrate that the restaurant concept has been reviewed through a professional financial lens. It also saves time when preparing loan applications, investor presentations, and internal management documents, since the model organizes key statements in a lender-friendly format.
Revenue Breakdown
The revenue breakdown component gives users a detailed view of where the Italian restaurant’s sales are expected to come from. Rather than treating revenue as one total figure, this section separates revenue streams so users can analyze the contribution of food sales, beverage sales, premium add-ons, memberships, events, private dining, or other categories relevant to the concept. Inputs may include the percentage mix of each stream, price points, customer volume, average check assumptions, event frequency, membership count, and growth rates. The outputs help users see which categories drive the largest share of revenue and which may contribute the strongest margins. This is especially useful for an Italian restaurant because food, beverages, events, and premium experiences may have very different cost structures and profitability profiles. A clear revenue breakdown helps users evaluate pricing strategy, menu design, promotional focus, staffing needs, and inventory planning. It can also highlight whether the business is too dependent on one revenue source or whether additional revenue streams could improve resilience. For investors and lenders, this component makes the sales forecast more transparent and easier to evaluate because it shows the logic behind total revenue growth.
KPI Dashboard
The KPI dashboard component tracks the performance metrics that matter most for an Italian restaurant. It may include financial and operational indicators such as revenue growth, gross margin, EBITDA margin, net profit margin, food cost percentage, beverage margin, labor cost ratio, average check size, covers, cash balance, payback period, return metrics, and other benchmarks. These KPIs are generated from the model’s revenue, cost, payroll, and financial statement calculations, giving users a concise view of business health across the forecast period. This component is useful because restaurant owners need to monitor more than sales alone. A restaurant can generate strong revenue but still struggle if food costs, labor, rent, or cash flow are not managed properly. The KPI dashboard helps users identify whether the business is moving toward healthy profitability, whether margins are improving, and whether operating performance aligns with industry expectations. For planning, it supports target setting and performance review. For funding, it gives investors and lenders a quick way to assess the financial quality of the plan. For management, it can be used as a recurring review tool to compare actual results against projections once the restaurant is operating.
Startup Cost Breakdown
The startup cost breakdown component organizes the initial investment required to open and prepare the Italian restaurant for operations. This section may include leasehold improvements, kitchen equipment, furniture and decor, ventilation systems, deposits, licenses and permits, professional fees, initial inventory, pre-opening payroll, marketing launch costs, technology systems, smallwares, signage, contingency reserves, and working capital. Users can edit each line item to reflect their actual location, restaurant size, design standard, concept positioning, and supplier quotes. The output helps estimate the total funding required before opening day and separates one-time launch costs from ongoing operating expenses. This is critical because restaurants often require significant upfront capital before revenue begins, and underestimating setup costs can create cash pressure early in the business. The startup cost breakdown helps founders plan fundraising, loan requests, owner contributions, and opening budgets with greater accuracy. It also supports negotiations with landlords, contractors, equipment vendors, and investors by showing where capital will be used. For business planning, this component gives users a clearer understanding of the financial commitment required to launch the restaurant properly.
Break-Even Analysis
The break-even analysis component calculates when the Italian restaurant is expected to generate enough revenue to cover its costs. It uses assumptions from the revenue forecast, cost of goods sold, payroll, fixed operating expenses, variable expenses, and contribution margin to estimate the point where total revenue equals total expenses. The analysis may show break-even timing by month, required sales levels, required customer volume, or the relationship between pricing, cost control, and profitability. For a restaurant, this is one of the most important planning outputs because early months often involve ramp-up periods, marketing costs, training expenses, and lower initial traffic. Understanding the break-even point helps users determine how much working capital is needed, how quickly the business must build demand, and whether the current cost structure is realistic. It also allows users to test decisions such as increasing average check size, reducing food costs, adjusting labor schedules, adding events, or improving table utilization. For investors and lenders, break-even analysis provides a practical measure of business viability. For owners, it supports decision-making by showing what must happen operationally for the restaurant to move from launch phase to sustainable profitability.
File types:
Excel – Single-User: .xlsx
Excel – Multi-User: .xlsx
Similar ProductsOther customers were also interested in...

 HenrySheykin
Restaurant Financial Model Excel Template
" The Restaurant Financial Model helps users turn a restaurant concept into a structured, editable f... Read more
Cafe Financial Model Excel Template
The Cafe Financial Model is a ready-to-use financial model template designed to help entrepreneurs, ... Read more
Pizzeria Financial Model Excel Template
The Pizza Restaurant Financial Model Template helps entrepreneurs, restaurant owners, consultants, a... Read more

Fast Casual Restaurant Financial Model Excel Templ...
The Fast Casual Restaurant Financial Model helps entrepreneurs, restaurant owners, consultants, anal... Read more

Pub Financial Model Excel Template
The Pub Financial Model helps entrepreneurs, pub owners, consultants, analysts, and business planner... Read more

Fine Dining Restaurant Financial Model Excel Templ...
The Fine Dining Restaurant Financial Model helps entrepreneurs, restaurant owners, consultants, anal... Read more

A La Carte Restaurant Financial Model Excel Templa...
The A La Carte Restaurant Financial Model Financial Model Template helps entrepreneurs, restaurant o... Read more
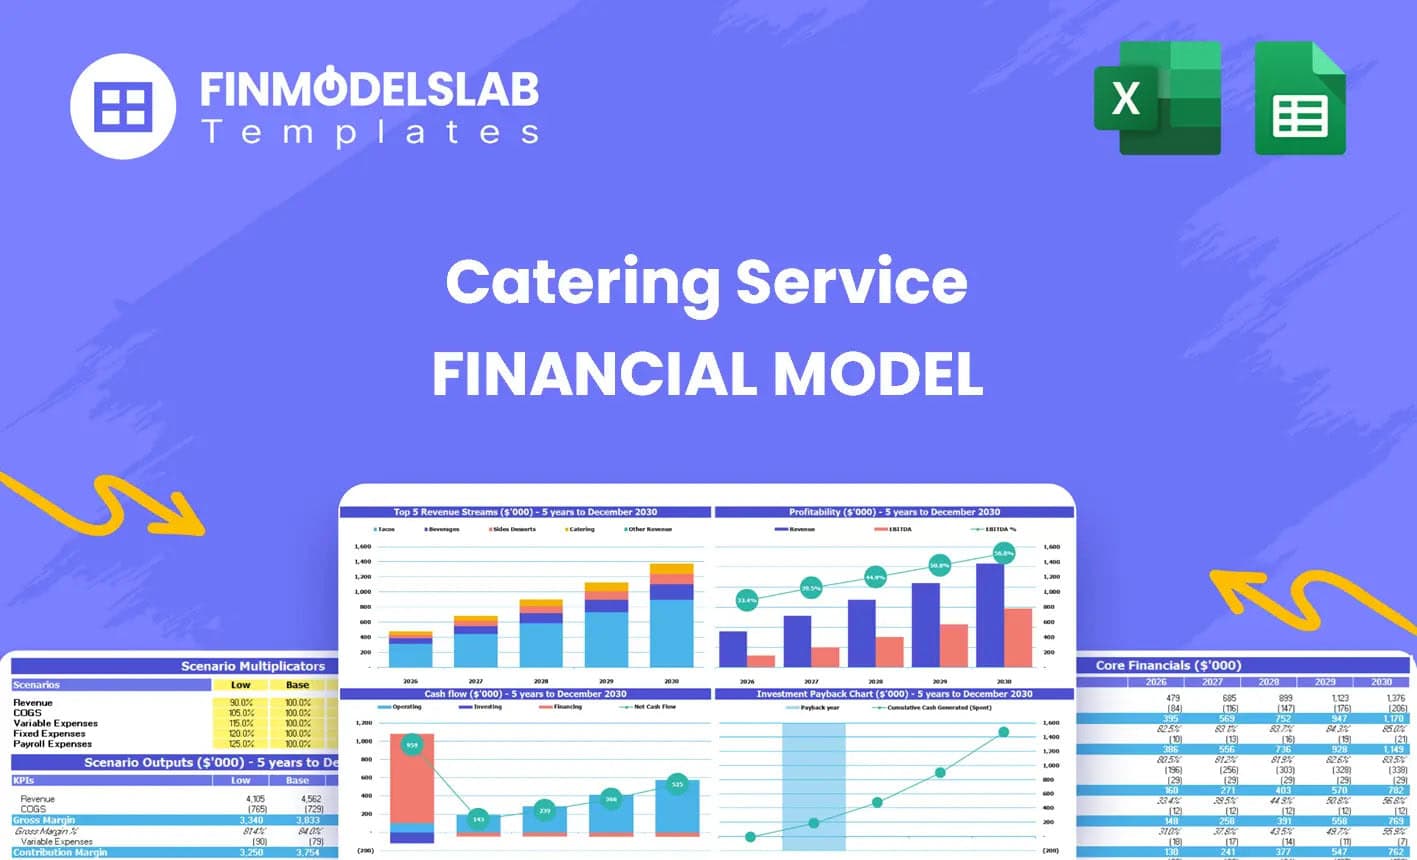
Catering Financial Model Excel Template
The Catering Service Financial Model helps users turn a catering business plan into a structured, ed... Read more
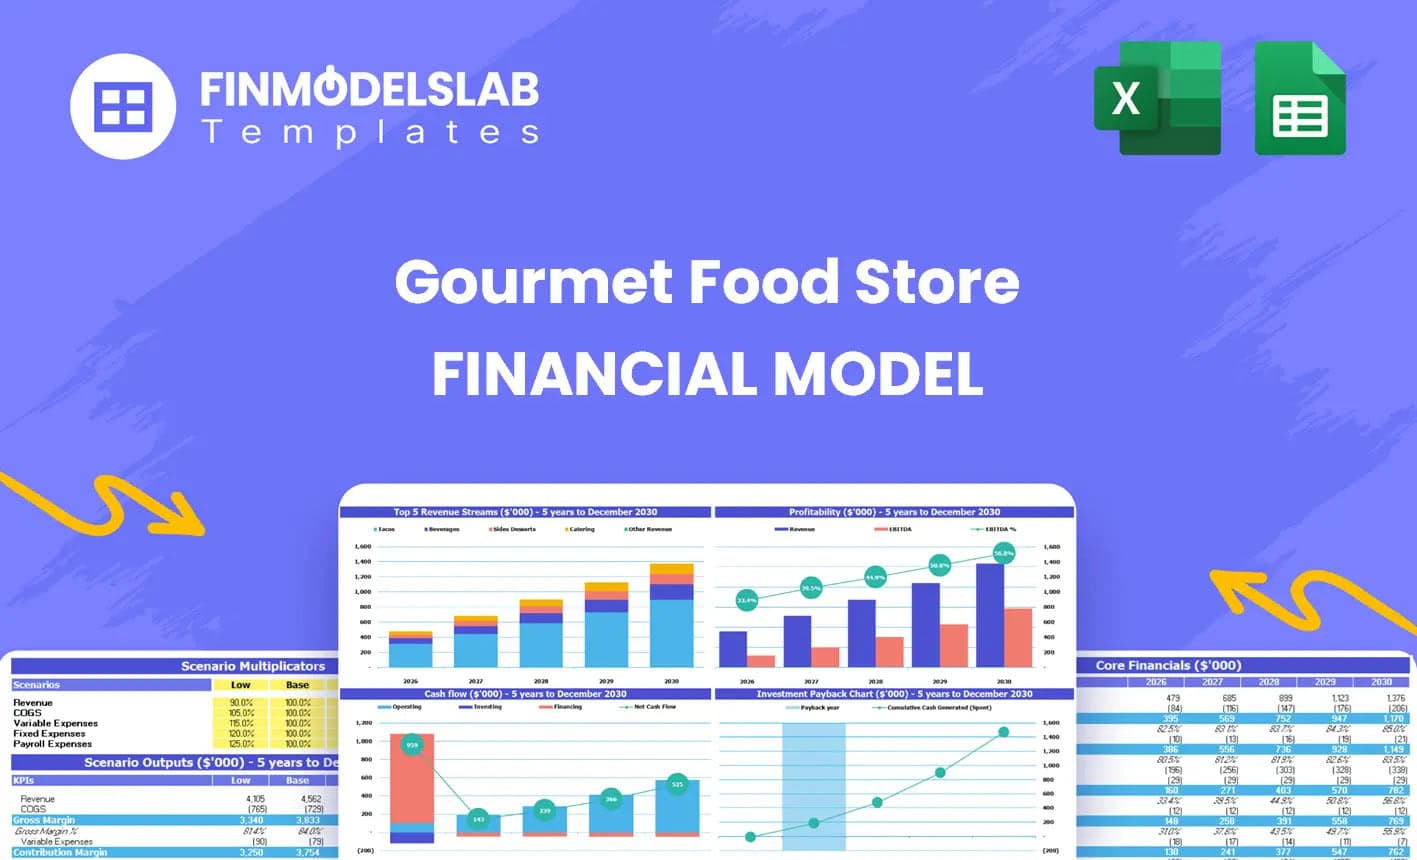
Gourmet Food Store Financial Model Excel Template
The Gourmet Food Store Financial Model helps entrepreneurs, founders, business owners, consultants, ... Read more
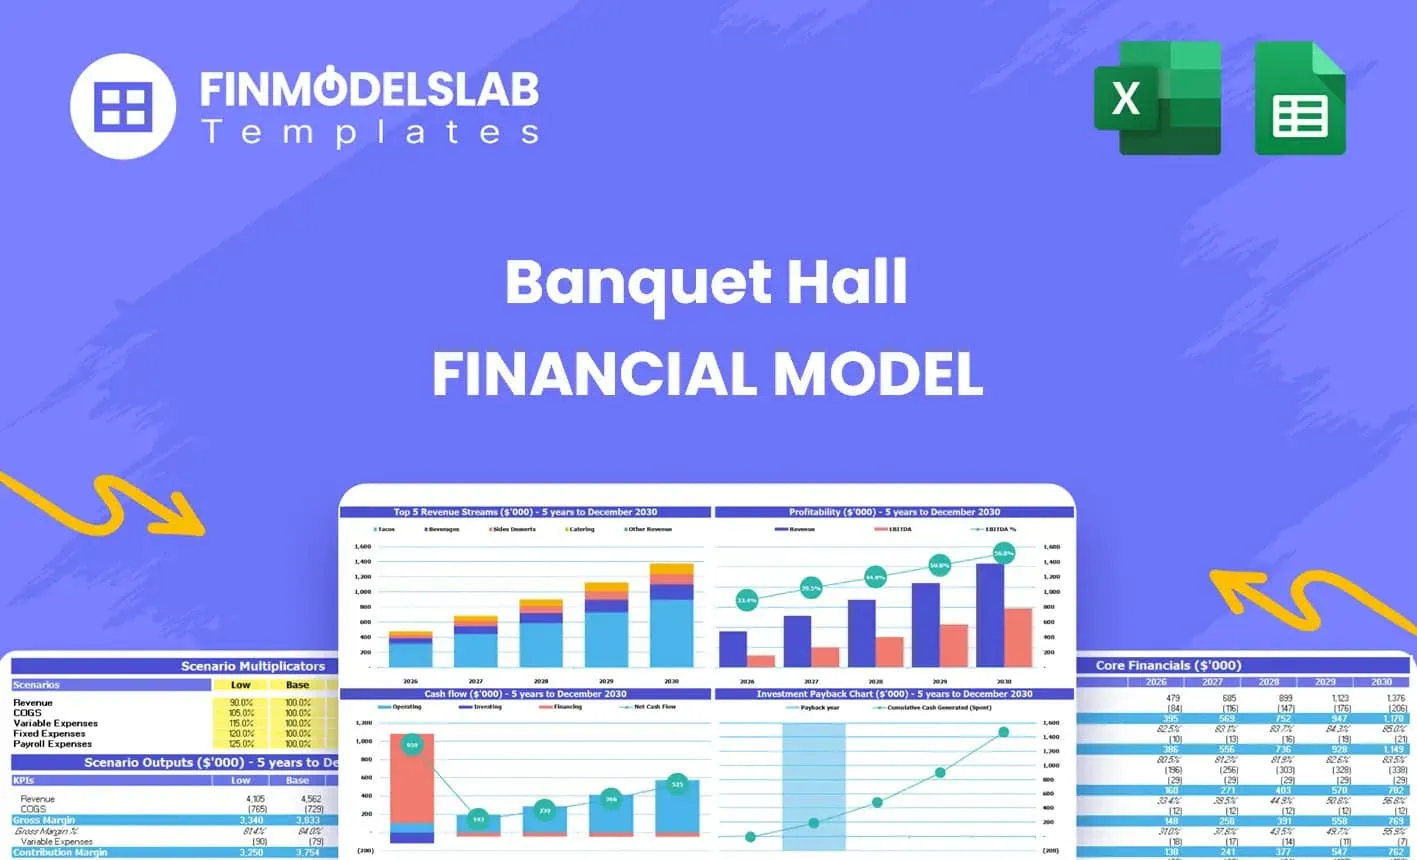
Banquet Hall Financial Model Excel Template
The Banquet Hall Financial Model helps entrepreneurs, venue owners, consultants, analysts, and busin... Read more
You must log in to submit a review.