
0 ITEMS

Infant Care Financial Model Excel Template
The Daycare Center Financial Model helps entrepreneurs, childcare founders, consultants, analysts, and business owners turn a daycare concept into a structured financial forecast. Instead of building a complex spreadsheet from scratch, users can start with an editable model designed around the economics of a childcare center, including enrollment capacity, tuition by age group, registration fees, staffing requirements, facility costs, supplies, and ongoing operating expenses. It gives users a practical way to estimate startup costs, forecast revenue assumptions, review cash flow, and understand whether the business can reach sustainable profitability. This financial model template is especially useful for people preparing a daycare business plan, lender package, investor presentation, internal budget, or expansion plan. It connects the main operating drivers of a daycare center, such as infant, toddler, and preschool enrollment, monthly tuition, occupancy rates, payroll, food, classroom supplies, rent, insurance, and administrative expenses. By adjusting assumptions, users can see how changes in pricing, capacity, staffing, and cost structure affect monthly and annual financial performance. This helps support better financial planning and more confident decision-making before launch or growth investment. The model is built to support up to five years of projections, making it suitable for both new daycare centers and existing childcare businesses evaluating growth. It helps users examine startup investment needs, recurring operating expenses, payroll planning, cash flow timing, profitability, return potential, and break-even analysis in one connected planning tool. With pre-built formulas, professional formatting, and editable assumptions, the template is designed to save time while still giving users flexibility to tailor the forecast to their location, pricing strategy, enrollment goals, and business model. For founders seeking funding, the Daycare Center Financial Model provides a clearer financial story for lenders, partners, and investors. For operators, it helps identify whether tuition levels, occupancy targets, staffing plans, and monthly expenses are aligned with financial goals. For consultants and advisors, it provides a ready-to-use framework for client planning and scenario review. The result is a practical financial model template that helps users organize assumptions, test business outcomes, manage risk, and make more informed decisions about starting, funding, or expanding a daycare center.
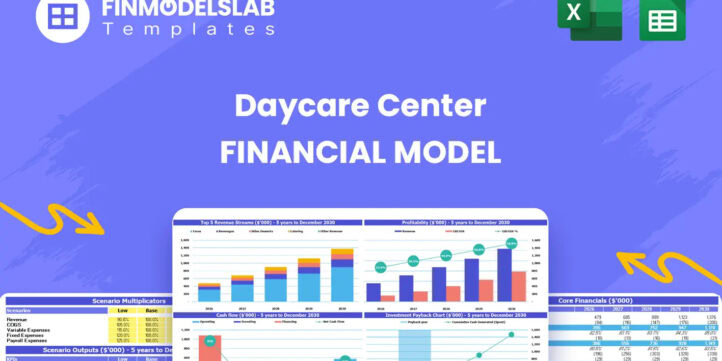


Financial Model Overview
The Daycare Center Financial Model is a ready-to-use financial model template designed to help entrepreneurs, childcare operators, consultants, analysts, and business planners evaluate the financial potential of a daycare center. A daycare business has several important moving parts, including enrollment capacity, tuition pricing, staff-to-child ratios, facility costs, licensing requirements, classroom supplies, food costs, payroll, working capital, and seasonal enrollment patterns. This model brings those assumptions into one structured planning file so users can estimate revenue, startup capital, monthly expenses, cash flow, profitability, and funding needs without building a spreadsheet from the ground up. It is useful for preparing a daycare business plan, applying for a loan, presenting to investors, reviewing an expansion opportunity, or simply making better internal decisions before committing capital. The template is editable, compatible with Excel and Google Sheets, and designed to produce clear financial outputs that can be adjusted for a specific location, pricing strategy, enrollment mix, and operating plan.
All-in-One Dashboard
The all-in-one dashboard gives users a central place to view the most important inputs and outputs of the Daycare Center Financial Model. It is designed to summarize the business at a glance by connecting core assumptions, such as enrollment levels, tuition pricing, occupancy rates, expense categories, payroll assumptions, and startup investment, with the resulting financial outputs. For a daycare center, this is especially useful because profitability depends on several linked drivers, including how many children are enrolled, which age groups they belong to, how much tuition is charged, how staffing scales with capacity, and whether fixed facility costs can be covered by recurring monthly revenue. The dashboard helps users avoid getting lost in separate worksheets by presenting high-level results such as revenue, operating expenses, EBITDA, cash flow, profit margins, and key financial ratios in one accessible view. It also supports faster review with lenders, partners, or internal teams because users can quickly explain how the business is expected to perform and what assumptions are driving the forecast. By combining key inputs and core outputs, the dashboard makes the financial model easier to navigate, update, and use for practical decision-making.
Low, Base, and High Scenario Analysis
The low, base, and high scenario analysis component helps users evaluate how the daycare center may perform under different business conditions. A daycare forecast should not rely on only one version of the future, because enrollment growth, tuition increases, local competition, staffing availability, and operating costs can all vary. This section allows users to compare a conservative case, an expected case, and an optimistic case using assumptions such as occupancy rate, tuition levels, registration fees, payroll costs, cost inflation, and growth timing. In a low scenario, the model can show the effect of slower enrollment, lower pricing power, or higher expenses on cash flow and profitability. In a base scenario, it can reflect the most realistic operating plan based on current market research and management expectations. In a high scenario, it can show the upside potential from faster enrollment, stronger demand, successful marketing, or improved cost efficiency. This feature is valuable for planning because it helps users identify financial risks before they occur, prepare contingency plans, and understand which assumptions matter most. It is also useful for funding discussions because lenders and investors often want to know how the business performs if results are weaker than expected.
Professional Charts
The professional charts component turns the financial forecast into clear visual outputs that are easier to review, explain, and present. Daycare financial planning often involves many numbers, including monthly tuition revenue, age group enrollment, payroll, rent, classroom supplies, food costs, EBITDA, net income, and cash balances. Charts help users understand trends more quickly by showing how revenue grows over time, how expenses compare with income, how profitability improves as occupancy increases, and how cash flow changes throughout the forecast period. This is useful when preparing a business plan, funding deck, or stakeholder update because visual summaries make the forecast more accessible to people who may not want to review every line of the spreadsheet. The charts can also help operators monitor whether the business model is balanced, such as whether payroll is rising too quickly compared with revenue or whether cash reserves are sufficient during the early ramp-up period. By presenting financial trends in a polished format, this component helps users communicate the daycare center’s plan more effectively and make data-driven decisions without relying only on raw spreadsheet outputs.
ROE Components and DuPont Analysis
The ROE components and DuPont analysis section helps users understand the drivers behind return on equity rather than looking only at a single profitability number. For a daycare center seeking investment or evaluating owner returns, it is important to know whether returns are being generated through strong profit margins, efficient asset use, or the effect of financing structure. DuPont analysis breaks return on equity into underlying components, typically including profitability, asset turnover, and leverage. In the context of a daycare center, this can help users examine whether the business is earning enough margin from tuition revenue after payroll and operating expenses, whether the facility and equipment investment is being used efficiently, and whether the level of debt or owner investment supports an attractive return profile. Inputs may include net income, total revenue, assets, equity, debt, and other balance sheet assumptions. The outputs help founders and investors evaluate capital efficiency and compare the daycare center’s projected performance with alternative uses of capital. This section is especially useful for stakeholders who want more than a simple profit forecast and need to understand how the business generates value over time.
Revenue Inputs
The revenue inputs section is where users define the key assumptions that drive the daycare center’s income forecast. For this type of business, revenue is usually built around tuition charged by age group, enrollment capacity, occupancy rates, and one-time fees. The model can account for monthly tuition for infants, toddlers, and preschoolers, with each category having different pricing and capacity assumptions because staffing requirements and market rates often vary by age group. Users can enter the number of available spots, expected occupancy, monthly tuition, registration fees, annual pricing increases, and other revenue drivers such as after-school programs, summer camps, late pickup fees, or ancillary services if applicable. These inputs flow through the financial model to generate monthly and annual revenue projections. This section is important because small changes in tuition or occupancy can have a major impact on profitability, especially when fixed costs such as rent, insurance, and administrative payroll remain relatively stable. By organizing revenue assumptions clearly, the model helps users test pricing strategies, validate enrollment goals, and build a more credible forecast for business planning and funding conversations.
Bank-Ready Reports
The bank-ready reports component is designed to produce lender-friendly financial outputs that support loan applications, funding discussions, and formal business planning. A daycare center often requires significant upfront capital for facility build-out, classroom furniture, playground equipment, kitchen setup, licensing, deposits, insurance, and working capital. Lenders typically want to see more than a general idea; they need structured financial statements, clear assumptions, monthly cash flow, repayment capacity, and evidence that the business can cover its operating costs. This section helps organize the forecast into professional reports such as income statements, cash flow projections, balance sheet summaries, profitability metrics, and debt-related outputs. It allows users to present the business in a format that is easier for banks, credit unions, investors, partners, or grant reviewers to understand. The reports also help users internally assess whether the daycare center can support a loan payment, maintain adequate cash reserves, and remain stable during the early ramp-up period. By providing clean and structured financial outputs, this component improves the credibility of the financial plan and saves time when preparing documentation for external stakeholders.
Revenue Breakdown
The revenue breakdown section provides a more detailed view of how total daycare revenue is generated across different streams. Instead of showing only one combined revenue figure, this component separates income by categories such as infant tuition, toddler tuition, preschool tuition, registration fees, and other potential service lines. This level of detail is useful because daycare centers often have different economics across age groups. Infant care may command higher tuition but also require more intensive staffing, while preschool programs may have different capacity and margin characteristics. By separating revenue streams, users can see which segments contribute most to total sales, how enrollment mix affects financial outcomes, and whether the business is too dependent on one category. Inputs may include age group capacity, occupancy by group, monthly fees, registration assumptions, annual tuition increases, and service-specific growth rates. Outputs may include monthly revenue by stream, annual revenue totals, percentage contribution by category, and trend analysis across the forecast period. This section is valuable for pricing decisions, marketing priorities, capacity planning, and investor communication because it explains not just how much revenue the daycare can generate, but where that revenue comes from.
KPI Dashboard
The KPI dashboard focuses on the performance metrics that matter most for managing and evaluating a daycare center. While financial statements show the overall results, key performance indicators help users understand what is driving those results and whether the business is operating efficiently. Relevant daycare KPIs may include occupancy rate, revenue per enrolled child, tuition revenue by age group, payroll as a percentage of revenue, EBITDA margin, net profit margin, cash balance, break-even timing, return on equity, and other operating or financial benchmarks. Users can review these metrics to identify strengths, weaknesses, and trends across the forecast period. For example, a rising revenue forecast may look positive, but the KPI dashboard can show whether payroll costs are increasing faster than tuition revenue or whether profit margins are improving as enrollment reaches higher capacity. This section is useful for owners, consultants, and investors because it converts the financial model into measurable business targets. It can support monthly performance reviews, funding presentations, expansion planning, and decision-making by helping users monitor the health of the daycare center in a concise and practical format.
Break-Even Analysis
The break-even analysis section helps users identify when the daycare center is projected to cover all fixed and variable costs and begin generating profit. This is one of the most important questions for a childcare startup because the business may incur significant costs before reaching full enrollment, including rent, salaries, utilities, insurance, marketing, supplies, and facility-related expenses. The model can calculate break-even based on projected tuition revenue, occupancy, pricing, payroll, food and supplies, rent, administrative costs, and other recurring expenses. It may show the break-even month, required enrollment level, required revenue level, or the amount of sales needed to cover operating costs. This information is useful for planning because it helps users understand how quickly the daycare must fill available spots to become financially stable. It also helps users test whether pricing is sufficient, whether expenses are too high, and whether working capital is adequate during the pre-profit period. For lenders and investors, break-even analysis provides a clear view of risk and timing. For operators, it supports practical decisions such as launching pre-enrollment campaigns, phasing hiring, controlling early expenses, and setting realistic enrollment targets.
Startup Cost and Funding Requirements
The startup cost and funding requirements section organizes the initial investment needed to open or expand the daycare center. A childcare business typically requires capital before revenue begins, and these startup costs can include facility renovation, classroom furniture, playground equipment, kitchen and dining equipment, learning materials, security systems, licensing, permits, deposits, insurance, professional fees, pre-opening payroll, initial marketing, technology, and working capital reserves. This component allows users to itemize those costs, separate one-time launch expenses from ongoing operating expenses, and estimate how much funding is needed before opening. It can also help users compare sources of capital, such as owner investment, bank loans, investor funding, grants, or lines of credit. The outputs may include total startup investment, funding gap, use of funds, and the amount of cash needed to maintain operations during the early enrollment ramp-up period. This is valuable for budgeting because it reduces the risk of underestimating launch costs, which is a common problem for new daycare operators. It is also essential for funding presentations because lenders and investors want to understand exactly how much capital is required, how it will be used, and how the business expects to reach financial stability.
File types:
Excel – Single-User: .xlsx
Excel – Multi-User: .xlsx
Similar ProductsOther customers were also interested in...


 HenrySheykin
Family Service Financial Model Excel Template
The Family Mediation Service Financial Model helps users turn a mediation practice concept into a st... Read more
Pre-School Care Financial Model Excel Template
The Preschool Financial Model helps entrepreneurs, childcare founders, preschool owners, consultants... Read more

Child Care Financial Model Excel Template
The Daycare Center Financial Model helps entrepreneurs, childcare founders, consultants, analysts, a... Read more

In-Home Daycare Financial Model Excel Template
The In-Home Daycare Financial Model helps users turn a home-based childcare concept into a structure... Read more
Babysitting Financial Model Excel Template
The Babysitting Service Financial Model helps entrepreneurs, founders, business owners, consultants,... Read more

Baby Minding Financial Model Excel Template
The Babysitting Service Financial Model helps entrepreneurs, founders, business owners, consultants,... Read more

 Andreas
Online Tutoring Services Financial Model (10+ Yrs ...
The Online Tutoring Services Financial Model is a comprehensive tool designed to analyze the financi... Read more
Start Up Nursery School Financial Model
Start Up Nursery School Financial Model presents the case of an investment in a nursery school and i... Read more

 Giorgos
Foreign Languages School – 5 Year Financial Mode...
Financial Model providing an advanced 5-year financial plan for a startup or operating Foreign Langu... Read more

Driving School – 5 Year Financial Model
Financial Model providing an advanced 5-year financial plan for a startup or operating Driving Schoo... Read more
You must log in to submit a review.