
0 ITEMS

Baby Minding Financial Model Excel Template
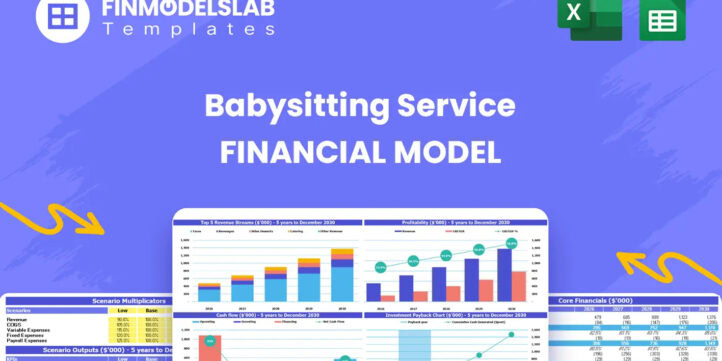
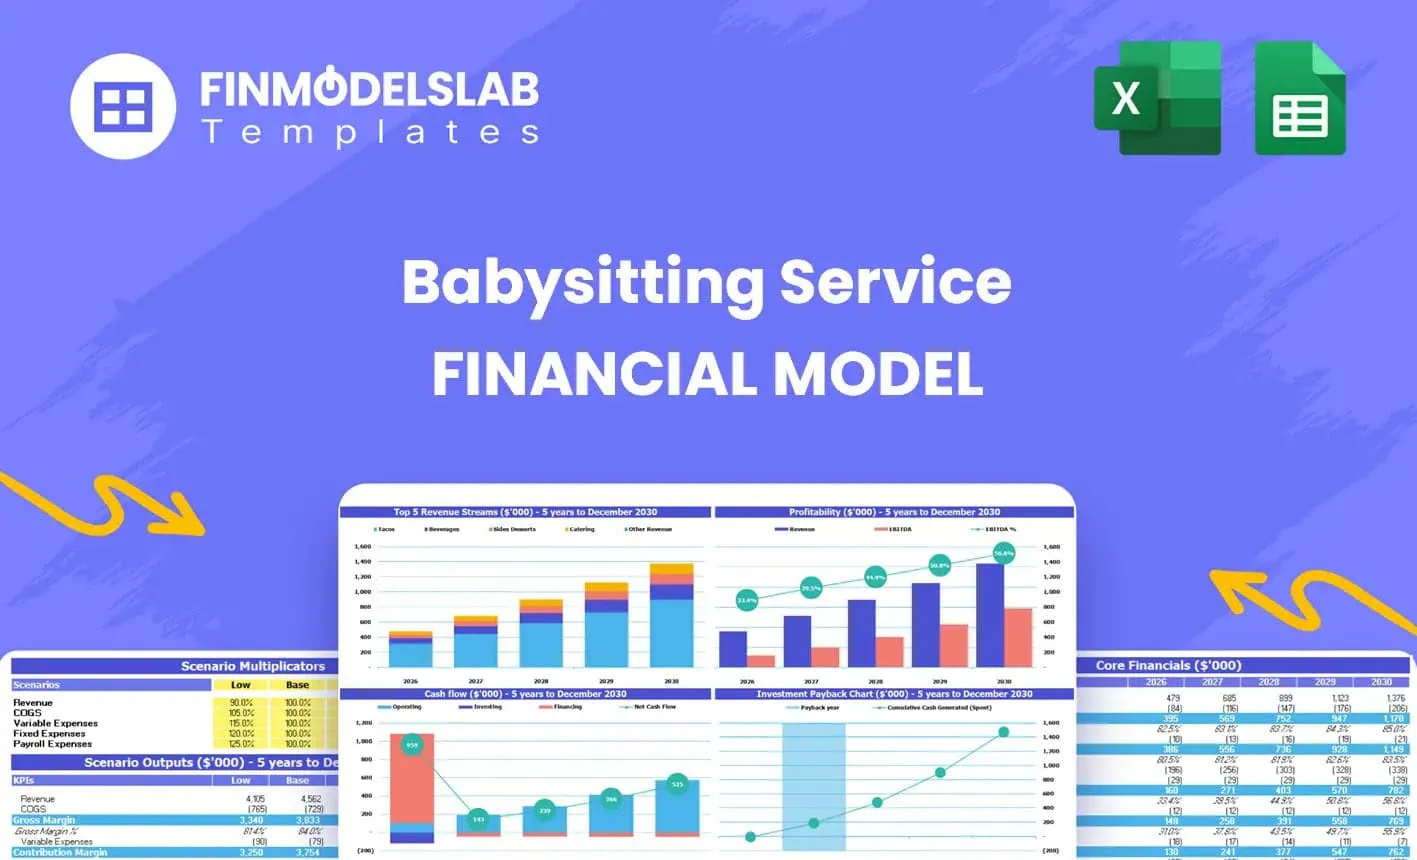
The Babysitting Service Financial Model helps entrepreneurs, founders, business owners, consultants, and analysts turn a babysitting or childcare marketplace concept into a structured five-year financial forecast. Instead of starting with a blank spreadsheet, users can work from a ready-to-use model designed around the economics of a babysitting service, including parent demand, babysitter supply, booking activity, commissions, subscription revenue, seller fees, startup costs, operating expenses, payroll, and cash flow. The template gives users a practical way to estimate how the business may perform before launch, during early growth, or while preparing for expansion. Built for business planning, funding preparation, and internal decision-making, this financial model template connects the main commercial drivers of the business with financial statements and investor-friendly outputs. Users can adjust revenue assumptions, acquisition costs, pricing, monthly subscriptions, commission rates, staffing plans, marketing budgets, platform expenses, and administrative costs to see how each decision affects profitability and funding needs. The model is especially useful for people preparing a babysitting agency business plan, a childcare marketplace pitch, a bank loan package, or an internal operating budget. The Babysitting Service Financial Model supports a full planning process by helping users estimate initial investment, forecast operating expenses, plan payroll, evaluate cash flow, and understand the path to profitability. It can be used to test whether the business can sustain early marketing spend, manage sitter and parent acquisition costs, cover platform development, and reach a reliable break-even point. The template also helps users review performance through dashboards, charts, financial reports, key metrics, and scenario analysis, making it easier to explain assumptions to partners, investors, lenders, or management teams. Because all key inputs are editable, the model can be adapted for different babysitting service formats, including local agencies, online booking platforms, nanny marketplaces, subscription-based childcare services, or hybrid models. Users can replace the pre-filled assumptions with their own figures, compare low, base, and high cases, and make more informed decisions about pricing, hiring, customer acquisition, funding, and growth. The result is a clear, organized, and presentation-ready financial planning tool that helps reduce guesswork and supports more confident decision-making.


Financial Model Overview
The Babysitting Service Financial Model is a ready-to-use financial model template designed to help entrepreneurs, founders, consultants, analysts, and business owners plan the launch or growth of a babysitting service with greater structure and confidence. It brings together the key financial drivers of a childcare marketplace or babysitting agency, including parent acquisition, babysitter acquisition, booking volume, commission income, subscription fees, seller extras, startup costs, payroll, operating expenses, cash flow, profitability, and investor returns. Instead of building a forecast from the ground up, users can enter their own assumptions into an organized model and review automated five-year projections, financial statements, visual reports, and decision-making metrics. This is useful for preparing a business plan, testing a launch strategy, estimating funding requirements, presenting to investors or lenders, and managing the business against measurable financial targets.
All-in-One Dashboard
The all-in-one dashboard gives users a central view of the most important inputs and outputs in the Babysitting Service Financial Model. It is designed to summarize the business at a glance by connecting assumptions such as pricing, commission rates, subscription fees, booking volume, customer acquisition, sitter acquisition, operating expenses, and staffing costs with financial outputs such as revenue, EBITDA, cash balance, profitability, payback period, internal rate of return, and break-even timing. For a babysitting service, this type of dashboard is especially useful because the business depends on several moving parts at the same time: parents need to be acquired, babysitters need to be onboarded, bookings need to grow, and the platform or agency must generate enough take-rate revenue to cover marketing, payroll, technology, and support costs. By placing the core business assumptions and financial results in one location, the dashboard helps users quickly understand whether their strategy is financially viable. It is also helpful for stakeholder communication because it provides a clean summary of the model without requiring investors, lenders, or team members to review every detailed worksheet. Users can adjust key assumptions and immediately see how changes affect revenue growth, cash flow, profitability, and investment performance.
Low Base High Scenario Analysis
The low, base, and high scenario analysis component helps users compare different possible outcomes for the babysitting service before committing to a plan. This section allows the user to evaluate how the business may perform under conservative, expected, and optimistic assumptions. Inputs may include parent acquisition rates, sitter acquisition rates, average booking frequency, average order value, commission percentage, fixed booking fees, subscription conversion, seller extras, marketing efficiency, payroll levels, and operating expense growth. The outputs help show how sensitive the business is to changes in demand, pricing, retention, customer acquisition cost, and cost structure. For example, a low case may reflect slower booking growth, higher marketing spend, or lower subscription adoption, while a high case may assume stronger word-of-mouth, higher repeat usage, and more efficient acquisition of both parents and babysitters. This component is valuable for planning because babysitting services often face uncertainty in early-stage growth, especially when balancing supply and demand in a local market or marketplace environment. Scenario analysis gives founders and decision-makers a more realistic view of risk and upside. It can also strengthen investor discussions by showing that the financial plan has been tested beyond a single forecast and that management understands the factors that drive financial performance.
Professional Charts
The professional charts component turns the financial forecast into visual outputs that are easier to review, explain, and present. Instead of relying only on rows of numbers, users can see trends in revenue, gross merchandise value, cash flow, EBITDA, profit, user growth, booking activity, and other key financial indicators. For a babysitting service, charts are particularly useful because the financial story often depends on growth over time: acquiring parents and sitters, increasing transaction volume, improving take rates, spreading fixed costs over a larger revenue base, and moving from early losses to sustainable profitability. Visual reports help users identify whether revenue is scaling fast enough, whether cash reserves are adequate, whether expenses are growing too quickly, and whether the business is moving toward its planned break-even point. These charts can be used in pitch decks, business plans, lender presentations, internal reviews, and board updates. They also make the model more accessible to non-financial stakeholders who may need to understand the forecast quickly. By presenting the main outputs in a polished visual format, this component supports clearer communication and better decision-making, especially when explaining the strategy behind a babysitting platform, nanny agency, or childcare booking service.
ROE Components and DuPont Analysis
The ROE components and DuPont analysis section helps users understand what is driving return on equity in the Babysitting Service Financial Model. Rather than looking only at a single return percentage, this component breaks down profitability and efficiency into more detailed drivers, such as net profit margin, asset turnover, and financial leverage. For a babysitting service, this can help users see whether returns are being influenced mainly by operating profitability, the efficient use of assets, or the way the business is financed. Inputs and outputs may connect to net income, revenue, total assets, equity, debt, retained earnings, and overall capital structure. This is useful for investors and owners because a babysitting business can have different financial profiles depending on whether it operates as a local service agency, a technology-enabled booking platform, or a marketplace with recurring subscriptions. A platform-heavy model may require more upfront development investment, while an agency model may require more payroll and operational staffing. DuPont analysis helps users interpret the quality of returns and evaluate whether performance improvements should come from higher margins, stronger revenue generation, better cost control, or more efficient use of capital. This section supports more advanced financial review and gives the model a professional layer of investor-ready analysis.
Revenue Inputs
The revenue inputs component is where users define the commercial assumptions that drive the babysitting service forecast. This section may include parent acquisition, babysitter acquisition, user tiers, booking frequency, gross merchandise value, commission rates, fixed booking fees, monthly parent subscriptions, monthly sitter subscriptions, premium tiers, specialized sitter options, promoted listings, advertising fees, and other seller extras. These inputs are important because revenue for a babysitting service is usually not based on one simple sales line. It may come from a combination of transaction commissions, fixed order fees, recurring subscription plans, premium account features, and optional visibility tools for sitters. By organizing these assumptions clearly, the model helps users build a revenue forecast that reflects the actual operating logic of the business. Users can test how changes in pricing, take rate, tier mix, conversion rates, and booking volume affect total income. This is useful for business planning because it allows the founder or analyst to understand which revenue streams matter most and whether the model relies too heavily on one source of income. It also supports funding conversations by making the revenue logic transparent, measurable, and adjustable based on market research or actual operating data.
Bank-Ready Reports
The bank-ready reports component provides structured financial outputs that can be used for lender reviews, funding applications, investor discussions, and formal business planning. These reports typically include financial statements and summaries such as profit and loss projections, cash flow forecasts, balance sheet views, profitability metrics, debt capacity indicators, and other lender-friendly outputs. For a babysitting service, bank-ready reporting is important because funding may be needed before the business becomes profitable, especially if the model includes platform development, initial marketing campaigns, software subscriptions, office setup, insurance, hiring, and working capital. Lenders and investors need to understand not only the revenue opportunity but also the timing of expenses, the expected cash burn, and the ability of the business to manage obligations over time. This component helps users present financial information in a clean and professional way, reducing the need to manually reformat outputs for external stakeholders. It also supports internal financial discipline because the user can review whether the planned funding amount is enough to cover the early operating period, whether the business can maintain liquidity, and whether projected profits are supported by realistic assumptions. The reports make the Babysitting Service Financial Model more practical for both planning and financing.
Revenue Breakdown
The revenue breakdown component gives users a detailed view of how total revenue is generated across the different income streams of the babysitting service. Instead of showing only one total sales figure, this section separates revenue into categories such as commission revenue, fixed booking fees, parent subscription fees, sitter subscription fees, promoted listings, advertisements, specialized service upgrades, and other optional add-ons. This is valuable because a babysitting marketplace or agency may depend on both transaction-based and recurring income. A detailed breakdown helps users see whether the business is mainly driven by booking volume, monthly recurring subscriptions, seller monetization, or premium services. Inputs may include number of active parents, number of active sitters, order frequency, average booking value, take rate, tier mix, subscription pricing, churn, and adoption of optional paid features. Outputs help the user evaluate revenue concentration, identify high-margin opportunities, and understand the impact of changing pricing strategy. For example, increasing the share of premium parents or specialized sitters may improve recurring revenue, while higher booking frequency may increase commission income. This component supports smarter strategic decisions because it shows where growth is coming from and helps users prioritize the revenue streams that can improve long-term profitability and cash flow.
KPI Dashboard
The KPI dashboard component focuses on the operating metrics that matter most for managing a babysitting service. It helps users track performance indicators such as gross merchandise value, take rate, active parents, active sitters, order frequency, customer acquisition cost, sitter acquisition cost, revenue per user, subscription adoption, retention, EBITDA margin, cash balance, and other business health measures. For a babysitting platform or agency, these KPIs are essential because financial performance depends on the relationship between user growth, booking behavior, and operating efficiency. If parent acquisition costs are too high, if sitters are not retained, if order frequency is low, or if take rates are not sufficient, the business may struggle even if total users are growing. The KPI dashboard turns these operating assumptions into measurable outputs that can be reviewed monthly or annually. It is useful for founders who need to monitor progress after launch, consultants who are building business plans, and investors who want to understand the quality of growth. The dashboard can also help users compare projected performance with industry benchmarks or internal goals. By combining operational metrics with financial outputs, this section helps users make better decisions about marketing spend, pricing, retention initiatives, staffing, and expansion strategy.
Startup Costs and Operating Expense Planning
The startup costs and operating expense planning component helps users estimate the investment required to launch and run the babysitting service. Startup costs may include platform development, website or app setup, office setup, furniture, laptops, workstations, server infrastructure, licensing, insurance, legal setup, branding, initial marketing, deposits, and working capital. Operating expenses may include payroll, customer support, marketing, payment processing, software subscriptions, hosting, insurance, professional services, office costs, administrative expenses, and ongoing technology maintenance. For a babysitting service, this section is especially important because early expenses can occur before the business has enough bookings or subscription revenue to cover them. The model helps users separate one-time capital expenditures from recurring monthly costs, making it easier to estimate funding needs and avoid undercapitalization. Inputs can be adjusted to reflect a lean local launch, a larger regional expansion, or a technology-enabled marketplace strategy. Outputs help show the total startup budget, monthly burn rate, fixed cost base, and expense trajectory over the forecast period. This component is useful for preparing investor materials, applying for financing, setting spending limits, and making practical decisions about when to hire, how much to spend on marketing, and what infrastructure is necessary at launch.
Break-Even and Payback Analysis
The break-even and payback analysis component helps users understand when the babysitting service may become financially sustainable and when initial investment may be recovered. This section connects revenue, gross margin, operating expenses, startup investment, cash flow, and profitability to calculate the point at which the business covers its costs and begins generating positive returns. Inputs may include monthly revenue growth, commission rates, subscription income, sitter and parent acquisition costs, payroll, fixed overhead, variable costs, capital expenditures, and funding assumptions. Outputs may include break-even month, cumulative cash position, payback period, EBITDA progression, and return metrics. For a babysitting service, this analysis is highly practical because the early stage often includes a period of negative cash flow while the company invests in platform development, brand awareness, customer acquisition, and sitter onboarding.
File types:
Excel – Single-User: .xlsx
Excel – Multi-User: .xlsx
Similar ProductsOther customers were also interested in...


 HenrySheykin
Pre-School Care Financial Model Excel Template
The Preschool Financial Model helps entrepreneurs, childcare founders, preschool owners, consultants... Read more
Family Service Financial Model Excel Template
The Family Mediation Service Financial Model helps users turn a mediation practice concept into a st... Read more

In-Home Daycare Financial Model Excel Template
The In-Home Daycare Financial Model helps users turn a home-based childcare concept into a structure... Read more

Child Care Financial Model Excel Template
The Daycare Center Financial Model helps entrepreneurs, childcare founders, consultants, analysts, a... Read more
Infant Care Financial Model Excel Template
The Daycare Center Financial Model helps entrepreneurs, childcare founders, consultants, analysts, a... Read more
Babysitting Financial Model Excel Template
The Babysitting Service Financial Model helps entrepreneurs, founders, business owners, consultants,... Read more

 Andreas
Online Tutoring Services Financial Model (10+ Yrs ...
The Online Tutoring Services Financial Model is a comprehensive tool designed to analyze the financi... Read more
Start Up Nursery School Financial Model
Start Up Nursery School Financial Model presents the case of an investment in a nursery school and i... Read more

 Giorgos
Driving School – 5 Year Financial Model
Financial Model providing an advanced 5-year financial plan for a startup or operating Driving Schoo... Read more

Foreign Languages School – 5 Year Financial Mode...
Financial Model providing an advanced 5-year financial plan for a startup or operating Foreign Langu... Read more
You must log in to submit a review.