
0 ITEMS

Hotel Financial Model Excel Template
The Hotel Financial Model helps users build a structured financial forecast for a hotel business using the revenue drivers that matter most in hospitality, including occupancy, room count, average daily rate, weekday and weekend pricing, ancillary income, operating expenses, payroll, startup costs, and cash flow. Instead of starting from a blank spreadsheet or adapting a generic model, buyers receive a ready-to-use financial model template designed around how hotels actually generate revenue and manage costs. It supports practical financial planning for room revenue, food and beverage, events, spa services, parking, staffing, commissions, capital expenditures, and profitability over a multi-year forecast period. This template is built for entrepreneurs, hotel owners, real estate developers, consultants, financial analysts, founders, and business plan writers who need a clear way to evaluate a hotel project before launch, expansion, acquisition, or funding. It can be used to prepare investor discussions, lender submissions, feasibility studies, internal budgets, and business planning documents. Users can customize assumptions to match a boutique hotel, independent property, resort-style concept, serviced accommodation project, or larger hospitality development. By connecting revenue assumptions with expenses, payroll, capital needs, and financial statements, the model helps users understand whether the hotel concept can support its cost structure and produce sustainable returns. The Hotel Financial Model is especially useful for decision-making because it translates operational assumptions into financial outputs. Users can review how changes in occupancy, ADR, booking mix, ancillary revenue, OTA commissions, staffing, and cost levels affect profitability, cash flow, and funding needs. The model helps clarify startup costs, monthly operating expenses, payroll planning, cash balance requirements, profit potential, investor returns, and break-even analysis. This makes it easier to compare scenarios, pressure-test assumptions, and identify the financial levers that matter most before committing capital. Designed to be editable and presentation-ready, the template works in Microsoft Excel and Google Sheets, giving users flexibility to update inputs, collaborate with advisors, and share outputs with stakeholders. It includes structured assumptions, automated calculations, financial projections, reports, charts, and performance indicators that help simplify a complex hospitality forecast. Whether the goal is to secure financing, assess a hotel investment, prepare a business plan, or manage growth, this financial model template gives users a practical framework for turning hotel assumptions into a professional forecast.
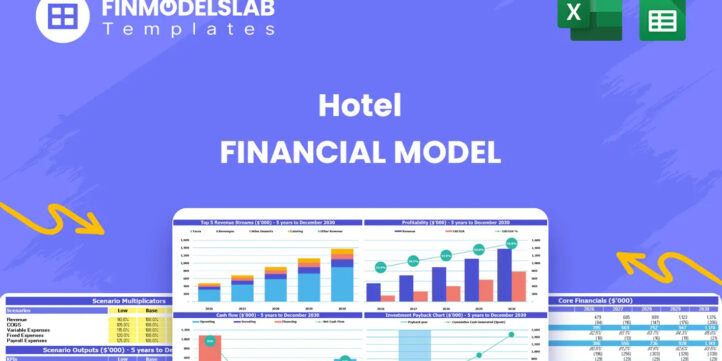


Hotel Financial Model Overview
The Hotel Financial Model is a ready-to-use financial model template designed for planning, evaluating, and presenting a hotel business with the specific revenue and cost drivers that matter in hospitality. A hotel forecast depends on more than a simple sales estimate, because financial performance is shaped by occupancy, average daily rate, room mix, seasonal demand, weekday and weekend pricing, ancillary revenue, payroll, operating expenses, startup capital, cash flow timing, and investor return expectations. This template brings those assumptions into one structured model so entrepreneurs, hotel owners, developers, consultants, analysts, and business plan writers can estimate revenue, costs, profitability, funding needs, and long-term financial performance. It is useful for hotel startups, expansion planning, investment analysis, feasibility studies, lender packages, and investor presentations because it turns operating assumptions into financial projections that are easier to review, adjust, and defend.
All-in-One Dashboard
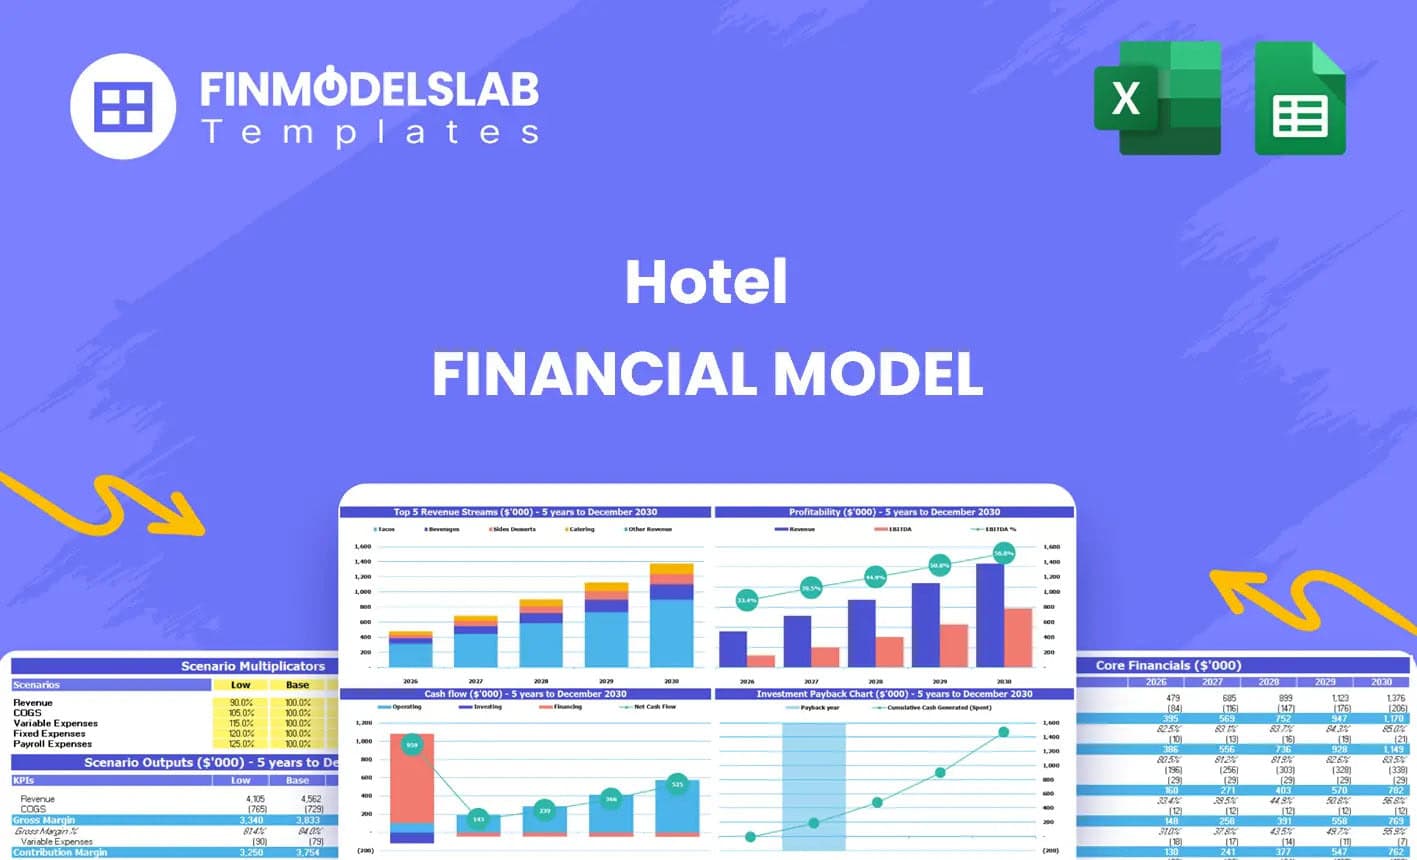
The all-in-one dashboard gives users a central view of the most important inputs and outputs in the Hotel Financial Model. Instead of searching through separate sheets to understand the forecast, users can review the core assumptions, headline financial results, and summary performance indicators in one place. This section may include key inputs such as room count, occupancy rates, average daily rate, revenue growth assumptions, operating cost drivers, staffing assumptions, startup investment, and financing assumptions, alongside outputs such as total revenue, EBITDA, net profit, cash flow, return metrics, and ending cash balance. The dashboard is useful for planning because it connects business assumptions with forecast outcomes, helping users quickly see whether the hotel is financially viable under the selected assumptions. It also supports decision-making during meetings with partners, lenders, and investors by providing a clean executive-level summary of the model without requiring every stakeholder to inspect the detailed calculations.
Low, Base, and High Scenario Analysis
The low, base, and high scenario analysis section helps users evaluate how the hotel may perform under different market and operating conditions. Hotels are exposed to changing demand patterns, travel trends, seasonality, competition, labor costs, booking channel mix, and pricing pressure, so a single forecast is rarely enough for serious planning. This component allows users to compare downside, expected, and upside cases by adjusting key drivers such as occupancy, ADR, ancillary spending, variable costs, payroll levels, commission rates, capital expenditure requirements, and operating margins. The outputs show how each scenario affects revenue, profit, cash flow, funding needs, and investor returns. This is valuable for risk management because it helps users understand what happens if occupancy grows more slowly than expected, if rates need to be discounted, or if costs rise above plan. It is equally useful for upside planning because it shows the impact of stronger demand, improved direct bookings, higher event revenue, or successful revenue management strategies.
Professional Charts
The professional charts component converts the financial forecast into visual outputs that are easier to interpret and present. Hotel financial models can contain many detailed assumptions and calculations, but stakeholders often need a concise way to understand trends, relationships, and overall performance. This section may include charts for revenue growth, EBITDA, net income, cash flow, occupancy, ADR, expense categories, investor returns, and year-by-year performance. The charts help users identify whether revenue is growing consistently, whether margins are improving, whether cash flow remains positive, and whether the business is moving toward stronger profitability over time. These visuals are useful for business planning documents, investor decks, lender conversations, internal budget reviews, and management updates because they present key financial information in a clear format. They also help users spot potential issues, such as rising costs, weak margins, or cash pressure, before those issues become hidden inside the spreadsheet details.
ROE Components and DuPont Analysis
The ROE components and DuPont analysis section helps users understand the drivers behind return on equity rather than only viewing a single return percentage. For hotel investors and owners, ROE can be influenced by profitability, asset efficiency, leverage, debt structure, operating margins, and the amount of equity capital invested. This component breaks return performance into more meaningful parts, helping users see whether returns are being created by strong operating income, efficient use of assets, favorable financing, or a combination of factors. Inputs may include net income, revenue, assets, equity, debt assumptions, interest costs, and capital structure assumptions, while outputs may include ROE, margin indicators, asset turnover measures, and leverage-related insights. This is useful for investment analysis because it allows users to evaluate whether the forecasted returns are supported by sustainable hotel operations or depend too heavily on financing assumptions. It also helps compare different capital structures and supports more informed conversations with equity partners, lenders, and other stakeholders.
Revenue Inputs
The revenue inputs section is where users define the core assumptions that drive hotel income. A hotel forecast must account for room revenue as well as ancillary revenue, and this component gives users a structured way to customize those inputs. Room revenue may be based on the number of rooms, room categories, occupancy rates, occupied room nights, weekday rates, weekend rates, and average daily rate assumptions. Ancillary revenue may include food and beverage sales, event space rentals, parking fees, spa services, meeting rooms, packages, or other hospitality services depending on the hotel concept. The model uses these assumptions to calculate monthly and annual revenue projections, making it easier to test how changes in pricing, utilization, service mix, or demand affect total income. This section is especially important because revenue assumptions are often the foundation of the entire hotel business plan. Clear revenue inputs help users build a more credible forecast, validate growth expectations, and make better decisions about pricing strategy, market positioning, and revenue management.
Bank-Ready Reports
The bank-ready reports section provides lender-friendly financial outputs that help users present the hotel forecast in a professional and structured format. Hotels often require significant capital for setup, renovation, furnishings, equipment, working capital, or expansion, so lenders need to see clear financial statements, repayment capacity, cash flow stability, and the assumptions behind the forecast. This component may include projected profit and loss statements, cash flow statements, balance sheet summaries, debt service assumptions, EBITDA, net income, financing needs, and cash balance projections. These reports help users demonstrate whether the hotel can generate enough operating cash flow to cover expenses, maintain liquidity, and support debt obligations. They are useful for loan applications, financing discussions, feasibility packages, and stakeholder reviews because they present the forecast in a format that is easier for banks and professional reviewers to evaluate. By organizing the financial outputs clearly, the model helps reduce confusion and supports a more credible funding conversation.
Revenue Breakdown
The revenue breakdown component gives users a detailed view of how the hotel generates income across different revenue streams. Rather than showing only one total revenue line, this section separates the major contributors so users can understand which parts of the business drive performance. It may break down income by room revenue, room type, occupancy levels, weekday and weekend rate assumptions, food and beverage, events, spa services, parking, and other ancillary services. This helps users evaluate the quality and diversity of revenue, identify the most important income sources, and understand how operational decisions affect the forecast. For example, a hotel may depend heavily on room sales, or it may gain meaningful upside from events, restaurant sales, wellness services, or premium packages. The detailed revenue view supports budgeting, pricing decisions, marketing strategy, staffing plans, and investor communication because it shows not only how much revenue is expected, but where that revenue comes from and how it may change over time.
KPI Dashboard
The KPI dashboard tracks the performance metrics that hotel owners, operators, investors, and lenders commonly use to assess the health of a hospitality business. In addition to standard financial outputs, a hotel forecast should include operating indicators such as occupancy rate, ADR, revenue per available room, total revenue, EBITDA margin, cash flow, payroll ratios, expense ratios, return on equity, and other performance benchmarks. This component helps users monitor whether the hotel is performing efficiently and whether the assumptions are aligned with industry expectations. Inputs may come from the model’s revenue, expense, payroll, and financial statement sections, while outputs provide a concise view of operating and financial performance over the forecast period. The KPI dashboard is valuable for decision-making because it highlights trends and makes it easier to compare scenarios, review progress against targets, and identify areas needing improvement. It also supports investor and management presentations by translating detailed spreadsheet data into practical performance indicators.
Startup Costs and CapEx Planning
The startup costs and CapEx planning section helps users estimate the initial investment required to prepare the hotel for operation. Hotel projects often require significant upfront spending before revenue begins, including room furnishings, decor, fixtures, kitchen and bar equipment, property management systems, IT infrastructure, spa equipment, signage, licensing, deposits, pre-opening marketing, professional fees, and initial working capital. This component organizes those costs so users can see the full capital requirement and avoid underestimating launch funding. It may also separate one-time capital expenditures from recurring operating expenses, which is important for understanding both the opening budget and the ongoing cost structure. The outputs help users determine how much equity, debt, or other financing may be needed before opening, as well as how startup investment affects cash flow and investor returns. For developers, founders, and business plan writers, this section is especially useful because lenders and investors usually want a transparent explanation of how funds will be used and whether the project is adequately capitalized.
Break-Even Analysis
The break-even analysis section helps users identify when the hotel is expected to become profitable and what level of revenue is needed to cover costs. This component connects fixed costs, variable costs, payroll, commissions, cost of goods sold, occupancy assumptions, ADR, and ancillary income to determine the point at which the business moves from loss to profit. For a hotel, break-even can be evaluated through monthly revenue, occupied room nights, occupancy rate, EBITDA, or cash flow depending on the planning need. The outputs help users understand how quickly the hotel can cover its operating expenses, how much cushion exists if demand is lower than expected, and which assumptions have the greatest impact on profitability. This is useful for funding discussions because investors and lenders want to know how long the project may require support before it can sustain itself. It is also valuable for management decisions, since users can test actions such as increasing direct bookings, improving room pricing, reducing OTA commissions, controlling payroll, or growing ancillary revenue to accelerate the path to profitability.
File types:
Excel – Single-User: .xlsx
Excel – Multi-User: .xlsx
Similar ProductsOther customers were also interested in...


 HenrySheykin
Boutique Hotel Financial Model Excel Template
The Boutique Hotel Financial Model Financial Model Template helps entrepreneurs, hotel owners, consu... Read more
Hostel Financial Model Excel Template
The Hostel Financial Model helps entrepreneurs, founders, operators, consultants, and analysts turn ... Read more
Motel Financial Model Excel Template
The Motel Financial Model helps entrepreneurs, motel owners, hospitality consultants, analysts, and ... Read more
Bed And Breakfast Financial Model Excel Template
The Bed and Breakfast Financial Model is a ready-to-use financial model template built to help entre... Read more
Hotel Development REIT Financial Model Excel Templ...
The Hotel Development Financial Model helps users evaluate a hotel construction or expansion project... Read more
Resort Financial Model Excel Template
The Resort Financial Model Financial Model Template helps resort developers, hospitality entrepreneu... Read more
Hospitality Financial Model Template Bundle
Planning to start a business in the hospitality industry? Do you want to try starting a Hotel busine... Read more
Casino Hotel Financial Model Excel Template
The Casino Hotel Financial Model helps users build a structured five-year forecast for an integrated... Read more
Eco Hotel Financial Model Excel Template
The Eco-Friendly Hotel Financial Model helps turn a sustainable hospitality concept into a structure... Read more
Floating hotel Financial Model Excel Template
The Hotel Financial Model helps users build a structured financial forecast for a hotel business usi... Read more
Reviews
 Finance Professional
Overall model is good,
following has not been considered
1) Grace Period in Loan
2) Inventory movement
3) Tax loss carry forwad
4) Input and output VAT
2251 of 4494 people found this review helpful.
Help other customers find the most helpful reviews
Did you find this review helpful?
 Hotel Model
 Financial controller
Great and useful and easy for use and it will be great if we can add different type of revenues
Thank you for your feedback.
3434 of 6944 people found this review helpful.
 Financial controller
Very good and useful financial templates.
3736 of 7464 people found this review helpful.
Help other customers find the most helpful reviews
Did you find this review helpful?
 Financial Controller
Great template.
3889 of 7778 people found this review helpful.
Help other customers find the most helpful reviews
Did you find this review helpful?
You must log in to submit a review.