
0 ITEMS

Motel Financial Model Excel Template
The Motel Financial Model helps entrepreneurs, motel owners, hospitality consultants, analysts, and business plan writers convert a lodging concept into a structured five-year forecast. Instead of estimating room revenue, occupancy, startup costs, payroll, operating expenses, and cash flow in separate files, this financial model template connects the core assumptions in one editable planning tool. It is built around motel-specific drivers such as room count, occupancy rate, average daily rate, weekday and weekend pricing, room categories, food and beverage sales, event space income, and other ancillary revenue streams. This template is useful for anyone preparing a motel business plan, acquisition review, funding application, lender presentation, or internal feasibility study. Users can adjust revenue assumptions, operating cost inputs, staffing levels, capital expenditures, and financing details to reflect a specific property or market. The model helps evaluate whether a motel can generate enough revenue to cover fixed costs, variable costs, payroll, debt obligations, and working capital needs while still reaching sustainable profitability. The Motel Financial Model also supports stronger decision-making by making the financial impact of key assumptions easier to understand. Users can review monthly and annual projections, test low, base, and high scenarios, analyze profitability, track cash flow gaps, estimate break-even timing, and prepare more credible outputs for stakeholders. Built-in reports, charts, dashboards, and performance metrics help communicate the business case clearly without requiring users to build a hospitality forecast from scratch. Because the model is fully customizable, it can be used for a new motel launch, a roadside property renovation, an independent motel acquisition, or an expansion plan for an existing lodging business. It provides a practical framework for planning startup investment, forecasting operating expenses, reviewing EBITDA, understanding return on investment, and identifying the assumptions that matter most. Whether the goal is funding, budgeting, investor communication, or operational planning, this financial model template gives users a ready-to-use foundation for evaluating motel financial performance.
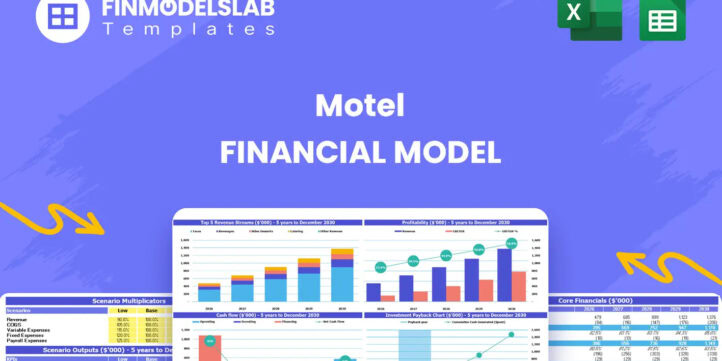


Financial Model Overview
The Motel Financial Model is a ready-to-use financial model template designed to help users plan, forecast, and evaluate the financial performance of a motel business. It is built around the key drivers of a lodging operation, including room count, occupancy, average daily rate, weekday and weekend pricing, room categories, ancillary revenue, startup investment, operating expenses, payroll, cash flow, and profitability. For a motel project, small changes in occupancy, pricing, labor cost, financing, or renovation budget can have a major impact on financial feasibility, so this model gives entrepreneurs, operators, consultants, analysts, and business plan writers a structured way to organize assumptions and understand the numbers before making decisions. The template can support new motel launches, roadside property acquisitions, renovations, expansion planning, funding discussions, lender applications, and investor presentations. It is editable, compatible with Excel and Google Sheets, and designed to save time by providing a professional framework instead of requiring users to build a hospitality forecast from a blank spreadsheet.
All-in-One Dashboard
The all-in-one dashboard brings the core inputs and outputs of the Motel Financial Model into one organized view, giving users a fast way to understand the overall financial picture of the motel. This component is useful because a motel forecast depends on multiple connected assumptions, including rooms available, occupancy rate, average daily rate, room mix, ancillary sales, staffing, operating expenses, startup costs, debt, and cash flow timing. The dashboard helps users review the main assumptions and see how they flow into revenue, gross profit, EBITDA, net profit, cash balance, and other major financial outputs. Instead of searching across multiple worksheets to understand whether the business plan is financially viable, users can use the dashboard as a control center for planning, reviewing, and presenting the model. It is especially helpful for founders, motel owners, consultants, and lenders who need a concise view of performance before moving into the supporting detail. The dashboard also supports better decision-making because it makes changes easier to interpret. When users adjust occupancy, pricing, operating costs, or capital expenditure assumptions, the summary view can show the effect on revenue growth, profitability, liquidity, and returns, helping stakeholders quickly compare alternatives and identify areas that need attention.
Low, Base, and High Scenario Analysis
The low, base, and high scenario analysis component helps users evaluate how the motel may perform under different market and operating conditions. A motel business is sensitive to demand, local competition, seasonality, online travel agency dependence, labor availability, and pricing power, so a single forecast rarely tells the full story. This section allows users to compare conservative, expected, and optimistic cases by adjusting key assumptions such as occupancy rate, average daily rate, revenue growth, ancillary sales, cost inflation, commission rates, and expense levels. The low case can be used to stress-test downside risk, such as weaker occupancy growth, lower room rates, or higher operating costs. The base case can represent the most realistic operating plan, while the high case can show the potential upside if the motel achieves stronger occupancy, better direct bookings, higher ADR, or improved ancillary sales. This component is valuable for funding preparation because investors and lenders often want to see that management understands both upside potential and downside exposure. It is also useful for internal decision-making, allowing users to build contingency plans, set realistic targets, determine working capital needs, and identify which assumptions have the greatest impact on profitability and cash flow.
Professional Charts
The professional charts component converts the financial forecast into clear visual outputs that are easier to interpret and present. Motel financial projections can include many rows of assumptions, monthly calculations, revenue lines, cost categories, and cash flow items, which can make it difficult for stakeholders to quickly understand the business case. This section helps users visualize key trends such as revenue by period, occupancy growth, EBITDA, net income, cash flow, cost structure, and performance changes across the forecast. Charts are useful for business plans, investor decks, lender discussions, board updates, and internal reviews because they turn spreadsheet data into a more accessible story. For example, a chart showing rising occupancy and ADR can help explain revenue growth, while a cash flow chart can highlight months where the motel may need additional working capital. Professional visual outputs also support credibility by making the model look more polished and easier to communicate. Users can rely on these charts to identify trends, compare scenarios, explain financial outcomes, and present financial information without overwhelming readers with raw spreadsheet detail. This makes the Motel Financial Model more practical not only as a calculation tool but also as a communication tool for stakeholders who need to understand the forecast quickly.
ROE Components and DuPont Analysis
The ROE components and DuPont analysis section helps users understand what is driving return on equity in the motel business. Return on equity is important for investors and owners because it measures how effectively the business uses invested capital to generate profit. A motel is often a capital-intensive business, especially when acquisition costs, property renovation, furniture, fixtures, equipment, technology systems, and working capital are included, so it is not enough to look only at revenue or EBITDA. This component breaks performance into the drivers that influence equity returns, such as profitability, asset efficiency, and leverage. By reviewing the underlying components, users can see whether returns are being driven by operating margins, revenue generation from the asset base, financing structure, or a combination of factors. This is useful for evaluating investment quality, comparing motel acquisition opportunities, assessing expansion plans, and explaining returns to stakeholders. If ROE is lower than expected, the analysis can help users identify whether the issue relates to weak margins, underused assets, excessive startup capital, debt structure, or slow revenue ramp-up. For a motel financial plan, this level of detail supports more disciplined investment analysis and gives users a clearer view of how operational decisions and financing choices affect long-term owner returns.
Revenue Inputs
The revenue inputs component is one of the most important parts of the Motel Financial Model because it defines how the business generates income. Motel revenue is primarily driven by room sales, and room revenue depends on assumptions such as total rooms available, occupancy rate, average daily rate, room type, weekday pricing, weekend pricing, and growth over time. The model is designed to support detailed lodging assumptions, including different room categories such as standard rooms, deluxe rooms, suites, and family rooms. This allows users to create a more realistic revenue forecast than a simple single-rate estimate. In addition to room revenue, the revenue inputs can include food and beverage sales, event space rentals, parking, spa services, vending, laundry, or other ancillary revenue streams that may apply to the specific motel. These inputs are useful for planning because they connect operational strategy with financial outcomes. Users can test whether higher weekend rates, improved occupancy, additional services, or stronger ancillary revenue can improve profitability and cash flow. They can also adjust assumptions to match local market research, competitor pricing, seasonality, or management expectations. For business plans and funding documents, this component helps users show a clear, transparent revenue logic rather than relying on unsupported top-line estimates.
Bank-Ready Reports
The bank-ready reports component organizes the forecast into financial outputs that lenders, investors, accountants, and stakeholders typically expect to review. A motel funding application or acquisition plan usually requires more than a simple revenue estimate. Stakeholders often want to see a profit and loss statement, cash flow forecast, balance sheet, startup cost summary, debt service assumptions, profitability metrics, and supporting calculations. This section helps users present the motel forecast in a structured format that is easier for external reviewers to understand. The reports can show monthly and annual projections, allowing users to evaluate short-term liquidity as well as long-term performance. For lenders, cash flow and debt service capacity are especially important because the motel must generate enough operating cash to cover loan payments, working capital needs, and ongoing expenses. For investors, profitability, EBITDA, payback period, return on equity, and overall capital requirements may be more relevant. By consolidating outputs into a professional reporting format, the model supports funding conversations and helps users avoid presenting disconnected or incomplete financial information. This component is also valuable for internal management because it creates a repeatable reporting structure for reviewing actual performance against the forecast once the motel is operating.
Revenue Breakdown
The revenue breakdown component gives users a detailed view of how total motel revenue is built across different income streams. This is important because total revenue alone does not explain the quality, stability, or risk profile of the business. Room revenue may represent the largest share of income, but food and beverage, event rentals, parking, spa services, laundry, vending, and other services can improve margins and provide additional upside if managed properly. This section helps users separate revenue by stream so they can understand which areas contribute most to sales and which assumptions deserve closer attention. For room revenue, the breakdown can reflect occupancy, room type, ADR, weekday and weekend rates, and room availability. For ancillary revenue, it can show recurring monthly assumptions, growth rates, or revenue per occupied room where relevant. This is useful for pricing strategy, service planning, marketing, and operational decision-making. If the model shows that ancillary revenue is a small but high-margin opportunity, the user may decide to expand services or promote add-ons more aggressively. If the model shows heavy dependence on one revenue source, the user can evaluate ways to diversify income. For business planning, the revenue breakdown also strengthens credibility by showing stakeholders exactly where projected sales are expected to come from.
KPI Dashboard
The KPI dashboard component tracks the performance metrics that matter most for a motel business and helps users benchmark financial and operating results. Motel operators need to monitor more than total revenue and profit. Important hospitality metrics may include occupancy rate, average daily rate, revenue per available room, total revenue, EBITDA margin, cash balance, payroll as a percentage of revenue, operating expense ratios, payback period, return metrics, and profitability trends. This component brings these measures into a clear summary so users can assess whether the motel is performing in line with expectations. It is useful during planning because it helps users evaluate the reasonableness of assumptions and compare different scenarios. It is also useful after launch because the same metrics can be used to review actual performance against the financial plan. For example, if occupancy is on target but EBITDA is below forecast, the KPI dashboard may point to labor costs, commission expenses, utilities, or other operating costs that need investigation. If revenue per available room is below expectations, the user may need to review pricing, channel mix, local demand, or room type strategy. A strong KPI dashboard improves decision-making by turning the model into a practical management tool, not just a one-time business planning file.
Startup Cost Breakdown
The startup cost breakdown component helps users estimate the initial investment required to acquire, renovate, prepare, and launch the motel. A lodging business can require significant upfront capital before it generates consistent cash flow, so understanding startup costs is critical for funding, budgeting, and feasibility analysis. This section can include property renovation, room furniture and fixtures, beds and linens, signage, lobby improvements, kitchen and bar equipment, laundry equipment, property management systems, reservation technology, security systems, licenses, permits, professional fees, pre-opening marketing, deposits, initial inventory, staff training, and working capital reserves. By organizing these costs in one place, the model helps users calculate total funding needs and avoid underestimating launch expenses. It also separates one-time capital expenditures from recurring operating expenses, which improves the accuracy of profit and cash flow projections. For a motel acquisition or renovation project, this section is especially useful because property condition, brand standards, deferred maintenance, and market positioning can create very different capital requirements. Users can customize each line item to match their own project and then see how the startup investment affects cash flow, payback period, return on equity, and financing requirements. This component supports more realistic planning and helps users prepare stronger funding requests.
Break-Even Analysis
The break-even analysis component helps users identify when the motel is expected to cover its costs and begin generating profit. This is one of the most practical outputs in a motel financial forecast because it connects revenue assumptions with fixed costs, variable costs, payroll, commissions, utilities, and other operating expenses. The break-even calculation can help users understand the occupancy level, revenue level, or timeline required for the business to move from loss-making to profitable operations. For a motel, fixed costs may include rent or property costs, insurance, property taxes, management salaries, utilities, software, maintenance contracts, and administrative expenses, while variable costs may include housekeeping supplies, laundry, food and beverage costs, payment processing, and online travel agency commissions.
Similar ProductsOther customers were also interested in...


 HenrySheykin
Hotel Financial Model Excel Template
The Hotel Financial Model helps users build a structured financial forecast for a hotel business usi... Read more
Hostel Financial Model Excel Template
The Hostel Financial Model helps entrepreneurs, founders, operators, consultants, and analysts turn ... Read more
Boutique Hotel Financial Model Excel Template
The Boutique Hotel Financial Model Financial Model Template helps entrepreneurs, hotel owners, consu... Read more
Bed And Breakfast Financial Model Excel Template
The Bed and Breakfast Financial Model is a ready-to-use financial model template built to help entre... Read more
Resort Financial Model Excel Template
The Resort Financial Model Financial Model Template helps resort developers, hospitality entrepreneu... Read more
Hotel Development REIT Financial Model Excel Templ...
The Hotel Development Financial Model helps users evaluate a hotel construction or expansion project... Read more

Hospitality Financial Model Template Bundle
Planning to start a business in the hospitality industry? Do you want to try starting a Hotel busine... Read more

Casino Hotel Financial Model Excel Template
The Casino Hotel Financial Model helps users build a structured five-year forecast for an integrated... Read more
Eco Hotel Financial Model Excel Template
The Eco-Friendly Hotel Financial Model helps turn a sustainable hospitality concept into a structure... Read more
Floating hotel Financial Model Excel Template
The Hotel Financial Model helps users build a structured financial forecast for a hotel business usi... Read more
You must log in to submit a review.