
0 ITEMS

Hostel Financial Model Excel Template
The Hostel Financial Model helps entrepreneurs, founders, operators, consultants, and analysts turn a hostel concept into a structured financial forecast. Instead of starting from a blank spreadsheet, users can work from a ready-to-use model built around the economics of shared accommodation, including bed capacity, occupancy, average daily rates, ancillary income, operating expenses, payroll, startup costs, cash flow, and profitability. It is designed to support practical financial planning before launch, expansion, lender discussions, investor presentations, or internal decision-making. This template gives users a clear way to estimate how a hostel may perform over time under realistic assumptions. It connects revenue assumptions such as dorm beds, private rooms, weekday and weekend pricing, occupancy levels, food and beverage sales, events, tours, laundry, luggage storage, and other services with the costs required to operate the business. By linking these inputs to projected financial statements, the model helps users see whether the business can cover fixed costs, manage variable expenses, reach break-even, and build sustainable profit. The Hostel Financial Model is especially useful for people preparing business plans, funding documents, loan applications, and investor-ready projections. It organizes the financial story in a format that lenders and stakeholders expect to see, including revenue forecasts, operating costs, cash flow, profitability, return metrics, and key performance indicators. Users can adjust assumptions, test different outcomes, review startup investment needs, and understand how changes in occupancy, pricing, payroll, utilities, or marketing spend affect the overall plan. Built for Excel and Google Sheets, the template is editable and practical for both financial and non-financial users. It helps save time, reduce guesswork, and improve decision-making by bringing the key drivers of a hostel business into one connected planning tool. Whether you are opening a boutique hostel, preparing a shared accommodation investment proposal, evaluating an existing property, or advising a client, this financial model template provides a structured foundation for forecasting revenue, expenses, cash flow, break-even timing, and long-term profitability.
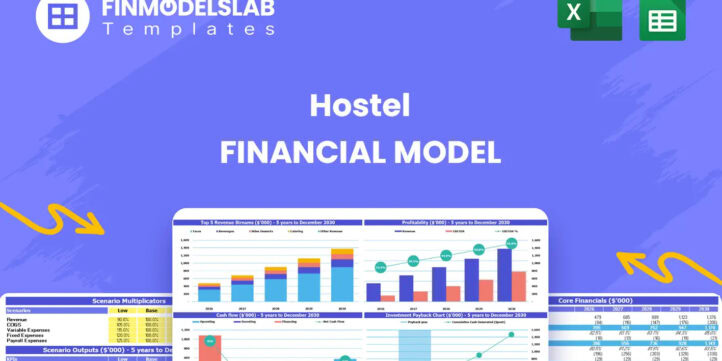


Financial Model Overview
The Hostel Financial Model is a ready-to-use financial model template designed to help users plan, forecast, and evaluate the financial performance of a hostel business. It brings together the most important drivers of a shared accommodation operation, including bed capacity, occupancy, room pricing, ancillary revenue, operating expenses, payroll, startup investment, cash flow, profitability, and investor return metrics. For a hostel, financial planning must account for both volume and seasonality, because small changes in occupancy, average daily rate, direct booking mix, or guest spending can materially affect margins and cash reserves. This model gives entrepreneurs, founders, operators, consultants, and analysts a structured way to build a credible forecast for a new hostel launch, an expansion plan, a funding proposal, or an internal performance review. Instead of relying on disconnected assumptions, users can update editable inputs and see how those changes flow through the financial statements, dashboards, reports, and decision-making outputs.
All-in-One Dashboard
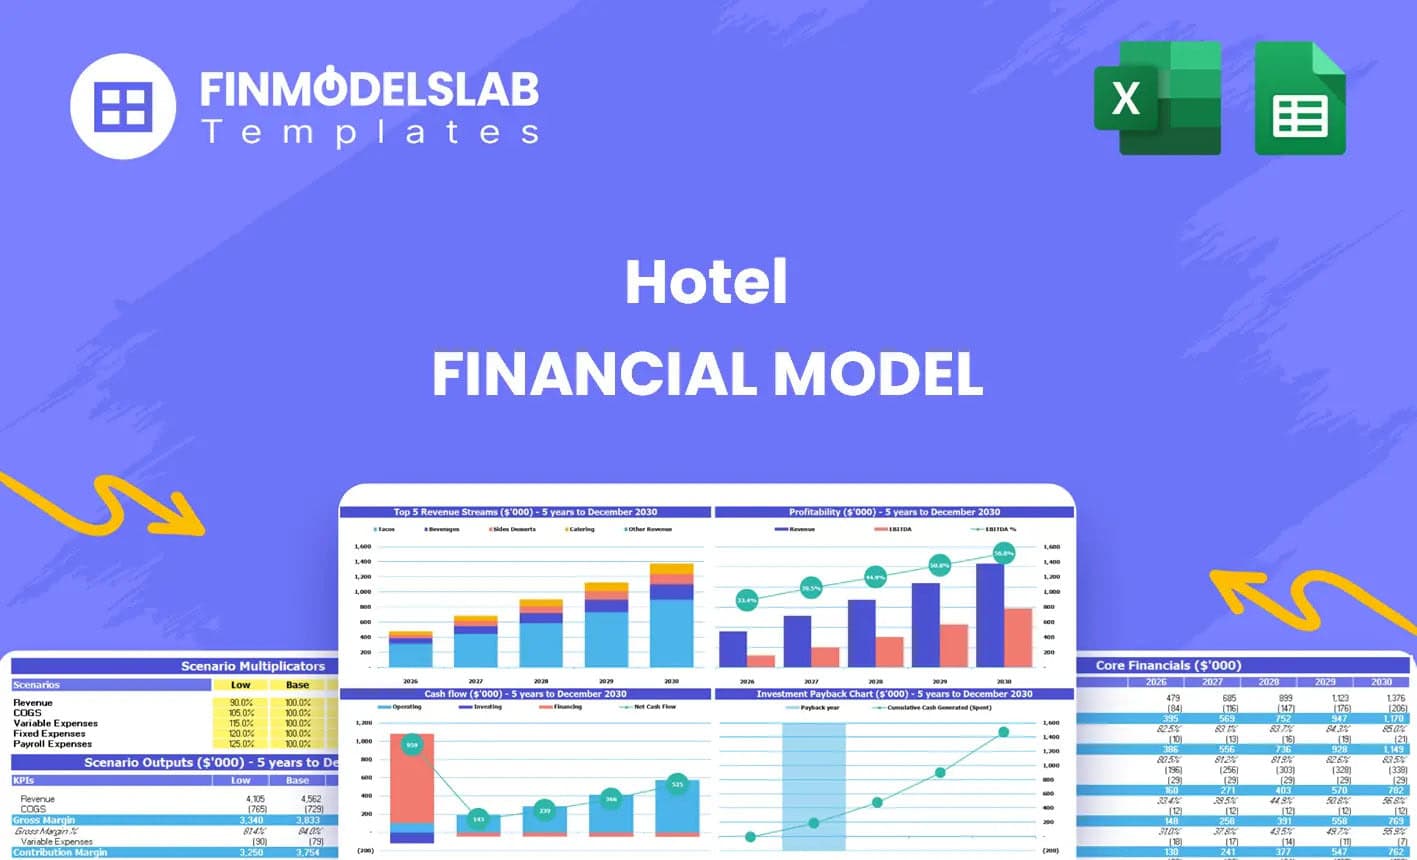
The all-in-one dashboard brings the model’s core inputs and core outputs into one central view so users can quickly understand the financial position of the hostel plan. This section is useful because a hostel forecast includes many moving parts, such as occupancy rates, average daily rates, dorm and private room capacity, ancillary revenue, staffing costs, utilities, marketing, maintenance, and launch investment. The dashboard helps summarize these assumptions alongside key outputs such as revenue, EBITDA, cash flow, profitability, payback period, and other financial indicators. Users can review whether the planned hostel has enough revenue potential to support its operating structure, whether the projected cost base is realistic, and whether the cash position remains stable during growth or seasonal periods. For founders and business owners, the dashboard provides a fast management view. For lenders and investors, it helps present the overall financial story in a clear and organized format without forcing stakeholders to dig through every detailed worksheet.
Low Base High Scenario Analysis
The Low, Base, and High scenario analysis section allows users to test different versions of the hostel business plan and understand how outcomes change under more conservative or more optimistic assumptions. This is particularly important in lodging and hospitality because results can be highly sensitive to occupancy, pricing, seasonality, guest demand, online travel agency fees, wage costs, utility expenses, and ancillary spending. In the Base case, users can model the expected operating plan. In the Low case, they can test risks such as slower occupancy ramp-up, lower average daily rate, higher payroll, weaker food and beverage sales, or rising utilities. In the High case, they can evaluate upside from stronger direct bookings, improved pricing, higher guest spending, better event sales, or faster market traction. The section helps generate comparative outputs for revenue, profit, cash flow, funding needs, and returns, making it easier to prepare contingency plans, communicate risk to investors, and make better decisions before committing capital.
Professional Charts
The professional charts section converts the model’s financial results into visual outputs that are easier to review, explain, and present. A hostel financial plan often includes detailed monthly and annual projections, but stakeholders may want a faster way to understand trends such as revenue growth, EBITDA improvement, cash balance movement, expense composition, occupancy performance, and return progression. The charts help translate spreadsheet data into presentation-ready visuals that can be used in business plans, loan discussions, investor decks, partner meetings, or internal strategy reviews. Users can use this section to show how room revenue and ancillary services grow over time, how startup costs and operating expenses affect cash flow, and how profitability improves as occupancy and pricing stabilize. The value of this component is that it makes the forecast more accessible and persuasive, especially for non-financial stakeholders who need to quickly understand the direction, risks, and financial potential of the hostel.
ROE Components and DuPont Analysis
The ROE components and DuPont analysis section helps users evaluate the drivers behind return on equity rather than looking only at a single return figure. In a hostel business, return on equity can be influenced by operating profitability, asset efficiency, debt structure, startup investment, and retained earnings. This section breaks down the return profile so users can better understand whether returns are being driven by strong margins, efficient use of capital, leverage, or long-term growth in profitability. Inputs and outputs may include net income, equity investment, asset base, revenue, margins, and capital structure assumptions. For investors and owners, this analysis is useful because hostels can be capital-intensive businesses, often requiring spending on beds, furnishings, property improvements, kitchen equipment, technology systems, deposits, and working capital before meaningful revenue begins. By viewing the components of ROE, users can identify whether the business needs higher occupancy, stronger ancillary revenue, better cost control, or a more efficient funding structure to improve returns.
Revenue Inputs
The revenue inputs section is where users define the commercial assumptions that drive the hostel forecast. This component is built around the practical revenue drivers of a hostel, including room sales from dorm beds and private rooms, occupancy rates, average daily rates, weekday and weekend pricing, seasonal demand, food and beverage sales, events, tours, laundry, luggage storage, and other guest services. Users can adjust the assumptions to reflect their specific property, location, target guests, capacity, pricing strategy, and service mix. The outputs generated from this section flow into the revenue forecast and ultimately affect profitability, cash flow, break-even timing, and investor returns. This section is especially important because lenders and investors often review revenue assumptions first to determine whether the plan is realistic. By building revenue from bottom-up operating drivers rather than using only broad annual estimates, the model helps users create a more credible and transparent forecast for a hostel business.
Bank-Ready Reports
The bank-ready reports section organizes the financial outputs in a format that is useful for lenders, funding partners, and professional stakeholders. A lender reviewing a hostel plan will typically look for revenue assumptions, operating costs, startup investment, cash flow, debt service capacity, break-even timing, profitability, and overall repayment ability. This section helps present those outputs in a structured way, reducing the need to rebuild information before a loan conversation or funding review. The reports may include forecast summaries, profit and loss outputs, cash flow projections, balance sheet views, repayment-related indicators, and key operating assumptions. For business owners, this component is valuable because it supports loan applications, grant submissions, investment discussions, and internal approval processes. For consultants and analysts, it provides a professional framework for presenting financial results clearly and consistently. A hostel can require meaningful upfront capital, so having lender-friendly reports helps users communicate how the business will generate cash, manage expenses, and support its funding needs.
Revenue Breakdown
The revenue breakdown section gives users a more detailed view of how total revenue is generated across the different income streams of the hostel. Rather than showing only one combined revenue line, this component helps separate dorm bed revenue, private room revenue, food and beverage sales, events and tours, laundry, luggage storage, and any other ancillary services included in the model. This matters because each revenue stream may have different margins, demand patterns, operational requirements, and growth potential. Room revenue may depend heavily on occupancy, ADR, and seasonality, while ancillary revenue may depend on guest count, service adoption, pricing, and operational execution. By reviewing the revenue mix, users can identify which streams contribute most to growth and which may need improvement. The section is useful for pricing decisions, marketing strategy, capacity planning, service design, and profitability analysis. It also helps users explain to investors or lenders how the hostel will earn money beyond basic accommodation sales.
KPI Dashboard
The KPI dashboard section focuses on the performance metrics that matter most for managing and evaluating a hostel business. This may include occupancy rate, average daily rate, revenue per available bed, room revenue, ancillary revenue per guest, gross margin, EBITDA margin, cash balance, payroll as a percentage of revenue, operating expense ratios, payback period, return on equity, and other indicators relevant to hostel operations. The purpose of this component is to give users a concise performance benchmark view that supports faster decision-making. For example, if occupancy is strong but profitability is weak, the KPI dashboard may point to high labor costs, excessive booking commissions, low ancillary spend, or an underpriced room strategy. If revenue is growing but cash flow is tight, the dashboard may highlight capital spending, working capital needs, or seasonal timing. This section is useful for founders, operators, and advisors who need to monitor whether the business is performing in line with goals and industry expectations.
Startup Cost Breakdown
The startup cost breakdown section helps users estimate the initial investment required to open or prepare the hostel for operations. A hostel typically requires upfront spending before the first guest checks in, and this section organizes those costs into practical categories such as dormitory beds and furniture, private room furnishings, kitchen and bar equipment, property management systems, IT infrastructure, security systems, deposits, licenses, permits, initial inventory, pre-opening payroll, launch marketing, professional fees, and working capital. Users can edit the assumptions to match the property size, location, fit-out standard, brand positioning, and operational model. The output helps determine how much capital may be needed from owners, lenders, investors, or other funding sources. This component is valuable because underestimating startup costs can create cash pressure before the hostel has time to stabilize occupancy and revenue. By clearly mapping the launch budget, the model supports better funding preparation, supplier planning, capital allocation, and investor communication.
Break-Even Analysis
The break-even analysis section helps users understand when the hostel is expected to cover its total costs with its total revenue. This is one of the most important planning outputs for a new hostel because the business may carry fixed costs such as rent or mortgage payments, staffing, utilities, insurance, software, maintenance, and marketing before occupancy reaches a stable level. The break-even calculation may use assumptions for revenue, occupancy, pricing, variable costs, fixed operating expenses, payroll, and ancillary margins to identify the month or revenue level at which the business becomes profitable. Users can evaluate how changes in average daily rate, bed occupancy, booking channel mix, food and beverage sales, or cost control affect the break-even point. This section is useful for funding discussions because lenders and investors want to know how long the business may operate before it can support itself. It is also useful for management because it highlights the operating targets needed to reach sustainable profitability and avoid unnecessary cash shortfalls.
File types:
Excel – Single-User: .xlsx
Excel – Multi-User: .xlsx
Similar ProductsOther customers were also interested in...


 HenrySheykin
Hotel Financial Model Excel Template
The Hotel Financial Model helps users build a structured financial forecast for a hotel business usi... Read more
Boutique Hotel Financial Model Excel Template
The Boutique Hotel Financial Model Financial Model Template helps entrepreneurs, hotel owners, consu... Read more
Motel Financial Model Excel Template
The Motel Financial Model helps entrepreneurs, motel owners, hospitality consultants, analysts, and ... Read more
Bed And Breakfast Financial Model Excel Template
The Bed and Breakfast Financial Model is a ready-to-use financial model template built to help entre... Read more
Resort Financial Model Excel Template
The Resort Financial Model Financial Model Template helps resort developers, hospitality entrepreneu... Read more
Hotel Development REIT Financial Model Excel Templ...
The Hotel Development Financial Model helps users evaluate a hotel construction or expansion project... Read more

Hospitality Financial Model Template Bundle
Planning to start a business in the hospitality industry? Do you want to try starting a Hotel busine... Read more

Casino Hotel Financial Model Excel Template
The Casino Hotel Financial Model helps users build a structured five-year forecast for an integrated... Read more
Eco Hotel Financial Model Excel Template
The Eco-Friendly Hotel Financial Model helps turn a sustainable hospitality concept into a structure... Read more
Floating hotel Financial Model Excel Template
The Hotel Financial Model helps users build a structured financial forecast for a hotel business usi... Read more
You must log in to submit a review.