
0 ITEMS

Headhunter Financial Model Excel Template
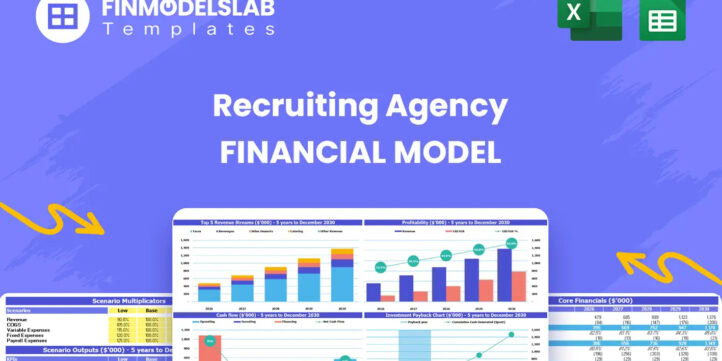
The Recruiting Agency Financial Model helps founders, agency owners, consultants, and analysts build a structured financial forecast for a recruitment, staffing, or talent acquisition business. Instead of starting with a blank spreadsheet, users can work from a ready-to-use financial model template designed around the core economics of a recruiting agency, including client acquisition, service mix, pricing, recruiter productivity, payroll, operating expenses, cash flow, and profitability. It gives users a practical framework for turning business assumptions into clear financial projections that can support planning, budgeting, fundraising, and management decisions. This template is especially useful for entrepreneurs preparing a recruiting agency business plan, established firms evaluating expansion, consultants supporting clients, and finance teams that need a clean model for investor or lender review. It allows users to estimate revenue assumptions across different recruiting services, plan startup costs, forecast monthly and annual operating expenses, and understand how staffing, commissions, marketing, software, office costs, and other expenses affect margins. By connecting inputs to projected financial statements and visual outputs, the model helps users see whether their agency can generate enough revenue to support hiring, growth, and sustainable profitability. The Recruiting Agency Financial Model also supports better decision-making through cash flow planning, scenario analysis, profitability review, and break-even analysis. Users can test how changes in pricing, billable hours, active clients, customer acquisition costs, recruiter efficiency, or sales commissions may affect performance over time. This is valuable when deciding how much startup capital to raise, how quickly to hire, which service lines to prioritize, and when the business may become profitable. The model helps highlight potential cash flow gaps, funding needs, and operational risks before they become real problems. Built for practical use, the template is fully editable and compatible with Microsoft Excel and Google Sheets, making it easy to customize for different business models, regions, currencies, and growth plans. It includes investor-ready formatting, professional charts, financial reports, dashboards, and structured assumptions so users can communicate their plan clearly to banks, investors, partners, advisors, or internal teams. Whether used for a new recruiting agency launch or a growing staffing firm, this financial model template provides a reliable foundation for forecasting, reviewing, and improving financial performance.


![Spreadsheet titled 'COGS & Operational Expenses' showing monthly cost data in yellow-highlighted sections in an Excel-like dashboard far left of the screen.] (trim)](https://www.efinancialmodels.com/wp-content/uploads/edd/2026/05/headhunter-financial-model-cogs-opex-financialmodelslab_138437ec-4bd5-4a08-b860-ceee228448ff-scaled.jpg "headhunter-financial-model-cogs-opex-financialmodelslab_138437ec-4bd5-4a08-b860-ceee228448ff | eFinancialModels")


Financial Model Overview
The Recruiting Agency Financial Model is a ready-to-use financial model template built to help entrepreneurs, business owners, consultants, analysts, and finance teams plan the financial performance of a recruiting agency or staffing firm. It brings together the key assumptions that drive this type of business, including client volume, service mix, placement fees, recruiter productivity, payroll, commissions, marketing spend, technology costs, startup investment, cash flow, profitability, and investor returns.
For a recruiting agency, the financial model must do more than estimate sales. It needs to show how quickly clients can be acquired, how placements convert into revenue, how payroll and sales commissions affect margins, and whether the agency can maintain enough cash to operate while it grows. This template helps users organize those assumptions into a structured five-year forecast that can support business planning, funding preparation, lender conversations, investor presentations, internal budgeting, and strategic decision-making.
All-in-One Dashboard
The all-in-one dashboard gives users a centralized view of the most important inputs and outputs in the Recruiting Agency Financial Model. It is designed to make the model easier to navigate by bringing together core assumptions, financial results, and performance indicators in one place.
Users can review key drivers such as revenue growth, service mix, expense levels, payroll assumptions, profitability, cash balance, and investment requirements without digging through every worksheet. The dashboard helps convert detailed spreadsheet data into a management-level summary that is useful for quick reviews, planning meetings, and investor discussions.
For a recruiting agency, this is especially valuable because performance depends on many connected factors, including active clients, billable hours, recruiter capacity, fee structures, and commissions. By showing the relationship between assumptions and outputs, the dashboard helps users understand whether the agency’s plan is realistic, financially sustainable, and aligned with growth objectives.
Low, Base, and High Scenario Analysis
The low, base, and high scenario analysis component helps users test how the recruiting agency could perform under different market and operating conditions. Instead of relying on one fixed forecast, the model allows users to compare conservative, expected, and optimistic cases by adjusting important assumptions such as client acquisition, pricing, billable hours, placement volume, customer acquisition cost, recruiter productivity, payroll growth, sales commissions, and operating expenses.
The low case can help identify downside risk, such as slower client growth or higher marketing costs. The base case can support the main operating plan. The high case can show the potential upside if the agency scales faster or shifts toward higher-margin services.
This component is useful for funding preparation because investors and lenders often want to understand how sensitive the business is to changes in revenue and cost drivers. It also helps management make better decisions about hiring, marketing spend, working capital, and expansion timing.
Professional Charts
The professional charts component turns the Recruiting Agency Financial Model’s projections into clear visual reports that can be used for presentations, reviews, and stakeholder communication. Charts may display revenue trends, expense categories, EBITDA, net profit, cash balance, growth rates, margins, investment returns, and other key financial metrics across the forecast period. For users preparing a business plan or pitch deck, these visuals help explain the financial story more effectively than rows of numbers alone.
A recruiting agency often needs to communicate how revenue grows as more clients are added, how profitability improves as fixed costs are absorbed, and how cash flow changes during early growth. The chart section helps make those patterns easier to understand. It also supports internal management by highlighting whether the business is moving in the right direction over time. With presentation-ready visuals, users can explain assumptions, financial outcomes, and strategic priorities more clearly to investors, lenders, partners, and advisors.
ROE Components and DuPont Analysis
The ROE components and DuPont analysis section helps users understand what is driving return on equity in the recruiting agency forecast. Rather than looking only at a single return figure, this component breaks performance into the financial drivers that influence overall shareholder return, such as profitability, asset efficiency, and leverage. It helps users see whether projected returns are being created through strong margins, efficient use of resources, or the way the business is financed.
For a recruiting agency, this is useful because the business model may scale quickly if client acquisition and recruiter productivity improve, but returns can also be affected by payroll, commissions, working capital needs, technology costs, and funding structure. DuPont-style analysis gives owners and investors a deeper view of financial quality, not just headline profit. It can support valuation discussions, investment review, strategic planning, and performance benchmarking by showing how operating decisions translate into equity returns over time.
Revenue Inputs
The revenue inputs section is where users define the commercial assumptions that drive the Recruiting Agency Financial Model. This component allows users to customize the agency’s revenue model based on service lines such as contingency search, retainer search, and multiple-hire projects. Inputs may include active clients, billable hours, placement fees, hourly rates, retained search fees, project volume, conversion rates, pricing changes, and growth assumptions. Because recruiting agency revenue can vary significantly depending on client type, role seniority, industry niche, and pricing model, this section is central to creating a realistic forecast.
Users can adjust assumptions to reflect a startup agency, a specialized executive search firm, a high-volume staffing provider, or an established recruitment business expanding into new markets. The outputs from this section feed the broader financial statements and help users understand how pricing, volume, and service mix affect total revenue, gross margins, profitability, and cash flow.
Bank-Ready Reports
The bank-ready reports component provides lender-friendly financial outputs that help users present the recruiting agency’s financial plan in a clear and professional format. These reports are designed to summarize the information that banks, lenders, and financing partners typically review, including projected revenue, expenses, profit and loss, cash flow, balance sheet items, break-even timing, funding needs, and repayment capacity.
For a recruiting agency seeking a business loan, line of credit, or working capital facility, the ability to show organized and credible projections can make the financing conversation more efficient. This section helps users explain how the agency expects to generate income, manage payroll and operating expenses, maintain liquidity, and reach profitability.
It also supports internal planning by organizing the model’s outputs into reports that are easier to review and share. Whether used for a formal loan application or a discussion with financial stakeholders, the bank-ready reports help translate the agency’s operating plan into financial terms.
Revenue Breakdown
The revenue breakdown section gives users a detailed view of how different recruiting agency revenue streams contribute to total sales. Instead of showing only one revenue line, this component separates income by service category so users can understand the impact of contingency searches, retainer searches, multiple-hire projects, and any other revenue streams added to the model. It may show monthly and annual revenue by stream, the percentage contribution of each service, and how the mix changes over time.
This is especially important for recruiting agencies because each service type may have different pricing, timing, margins, and cash flow characteristics. Retainer search may provide upfront fees and stronger predictability, while contingency search may depend more heavily on successful placement volume. Multiple-hire projects may create larger client relationships but could involve discounted pricing. By analyzing the revenue breakdown, users can identify which services are most important, which areas may deserve more sales focus, and how changes in service mix affect overall profitability.
KPI Dashboard
The KPI dashboard component helps users monitor the performance metrics that matter most for a recruiting agency. It organizes key performance indicators into a concise view that can support ongoing management, benchmarking, and decision-making. Metrics may include revenue growth, gross margin, EBITDA margin, net profit margin, cash balance, customer acquisition cost, sales commissions as a percentage of revenue, recruiter productivity, billable hours, client growth, payback period, return on equity, and other financial or operating measures.
For a recruiting agency, KPIs are essential because the business depends on both sales performance and delivery efficiency. A firm may generate strong revenue but still face margin pressure if payroll, commissions, job board costs, assessment tools, or marketing spend rise too quickly. The KPI dashboard helps users compare planned performance against targets and identify areas that need attention. It is also useful for investor updates, board reporting, monthly management reviews, and strategic planning sessions.
Break-Even Analysis
The break-even analysis component helps users estimate when the recruiting agency’s revenue will be sufficient to cover its total costs. This section connects revenue assumptions, fixed operating expenses, variable costs, payroll, commissions, software expenses, marketing, office costs, and other overhead to determine the point at which the business becomes profitable.
For a startup recruiting agency, break-even timing is one of the most important planning outputs because it shows how long the business may need to rely on startup capital, owner investment, debt, or working capital reserves before generating sustainable profit. Users can test how changes in pricing, client acquisition, recruiter productivity, service mix, and expense control affect the path to break-even.
This helps founders decide whether their launch plan is financially realistic and gives investors or lenders a clearer view of risk. The break-even analysis is also useful after launch because it provides a target for sales activity, cost management, and operational efficiency.
Startup Costs and Operating Expense Planning
The startup costs and operating expense planning component helps users estimate both the initial funding required to launch the recruiting agency and the recurring expenses needed to operate it. Startup costs may include office setup, furniture, computer hardware, software licenses, website development, branding, legal fees, business registration, initial marketing, recruiting databases, job board access, deposits, and working capital.
Ongoing expenses may include payroll, sales commissions, rent, technology subscriptions, advertising, professional services, insurance, training, travel, administration, and general overhead. This section is useful because recruiting agencies can appear asset-light, but they still require upfront investment and reliable cash reserves to cover the period before client revenue becomes consistent.
By separating one-time launch costs from recurring monthly expenses, the model helps users calculate funding needs more accurately and avoid undercapitalizing the business. It also supports budgeting, cash flow planning, and expense control as the agency grows from startup stage to a larger recruiting operation.
File types:
Excel – Single-User: .xlsx
Excel – Multi-User: .xlsx
Similar ProductsOther customers were also interested in...


 HenrySheykin
Business Brokerage Financial Model Excel Template
The Business Brokerage Financial Model helps entrepreneurs, brokerage owners, consultants, analysts,... Read more
Auditor Financial Model Excel Template
The Auditing Firm Financial Model helps founders, consultants, analysts, and business owners turn an... Read more
Corporate Trainer Financial Model Excel Template
The Corporate Training Financial Model helps users turn a professional development or corporate lear... Read more
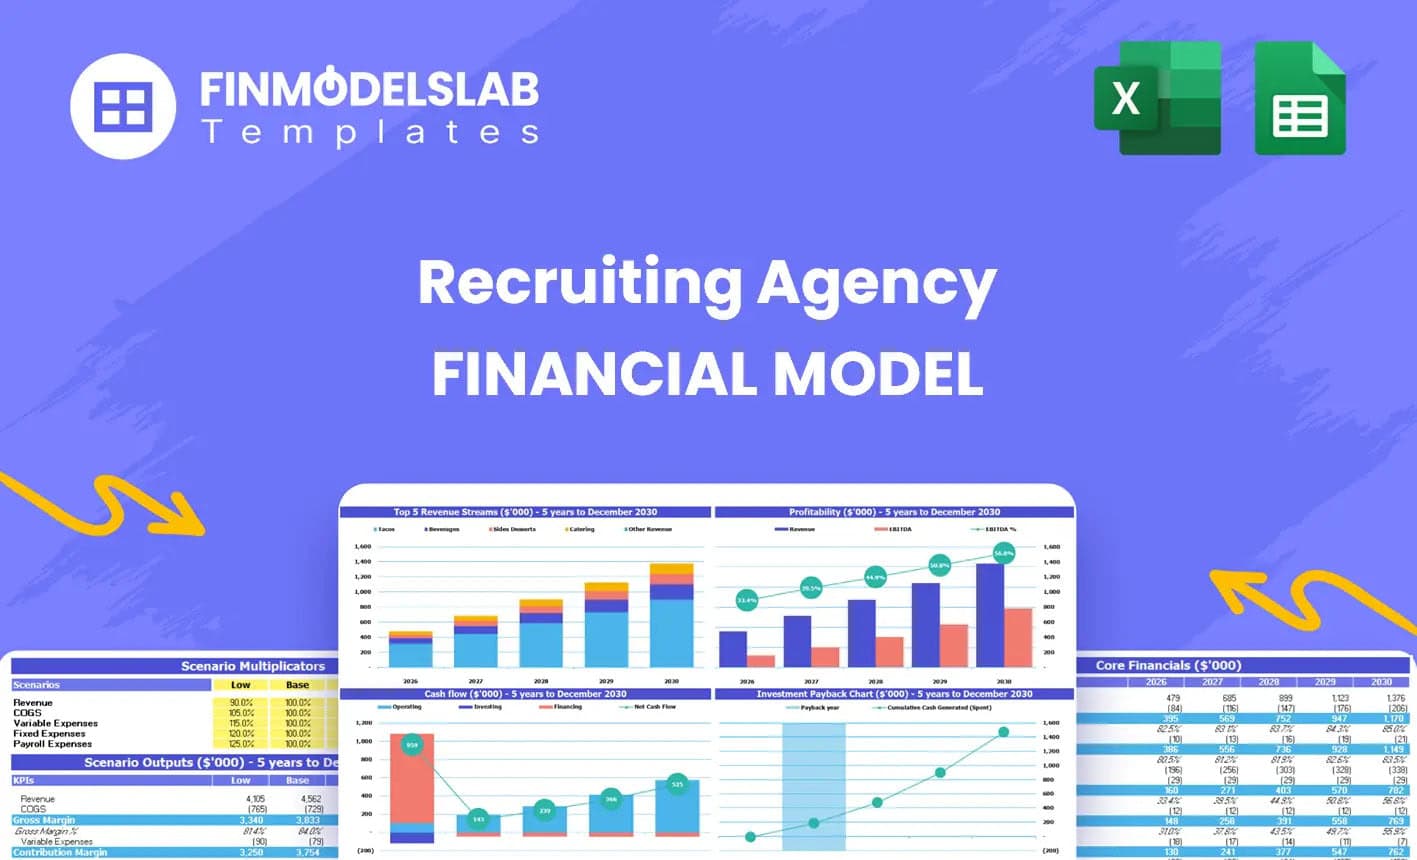
Attorney Employment Agency Financial Model Excel T...
The Recruiting Agency Financial Model helps founders, agency owners, consultants, and analysts build... Read more

Virtual Assistant Service Financial Model Excel Te...
The Virtual Assistant Service Financial Model Template helps entrepreneurs, founders, consultants, a... Read more
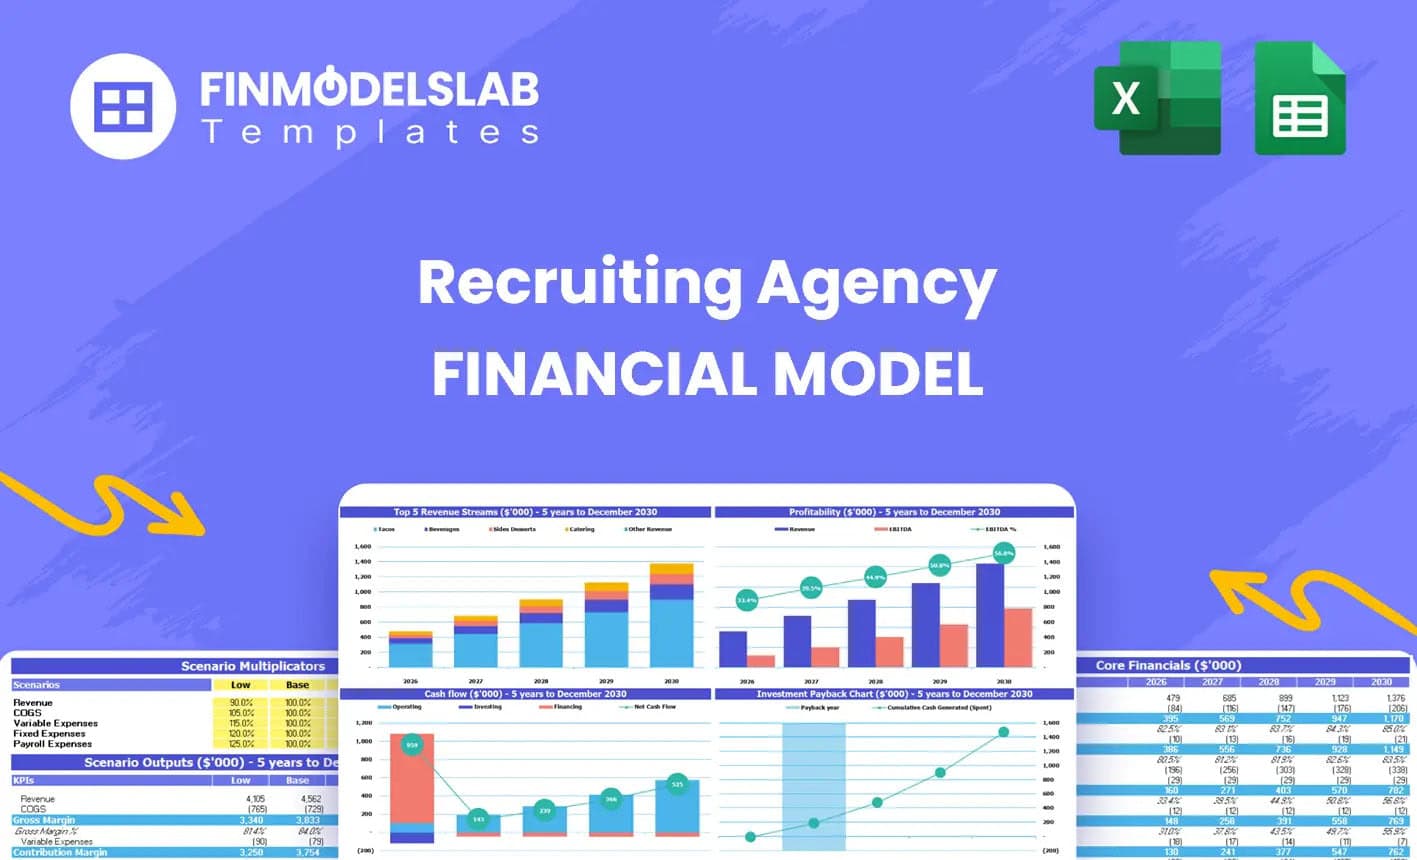
Recruitment Agency Financial Model Excel Template
The Recruiting Agency Financial Model helps founders, agency owners, consultants, and analysts build... Read more

Staffing Agency Financial Model Excel Template
The IT Staffing Agency Financial Model is a ready-to-use financial model template built to help foun... Read more
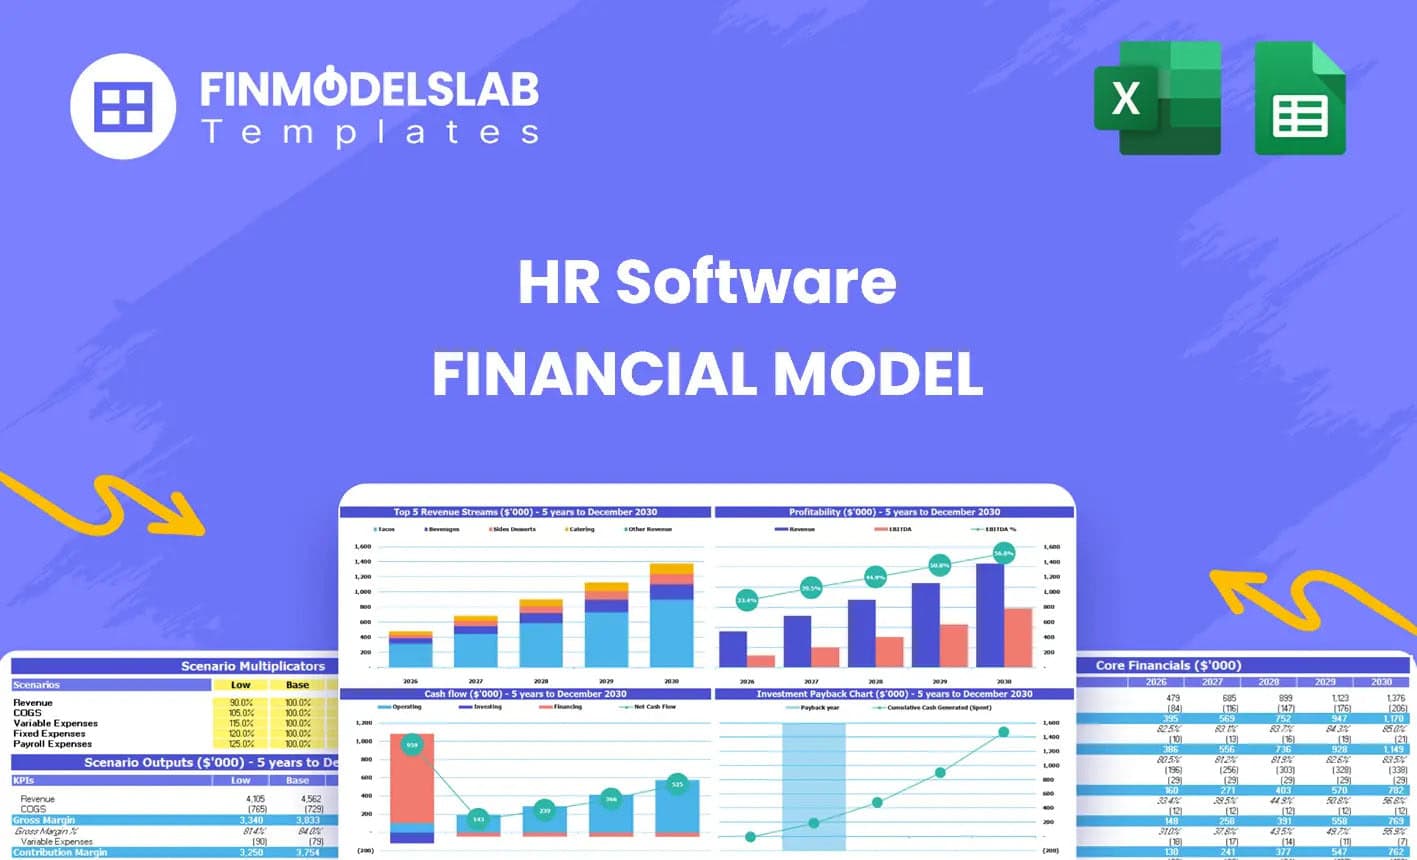
Human Resource Software Financial Model Excel Temp...
The HR Software Financial Model Financial Model Template helps founders, business owners, consultant... Read more

 Giorgos
Digital Hiring (Talent) Marketplace – 5 Year Fin...
Financial Model providing an advanced 5-year financial plan for an online, two-sided hiring platform... Read more

Human Resources Company – 10 Year Financial Mode...
10-year financial model for an HR company providing forecasts, profitability analysis, and insights ... Read more
You must log in to submit a review.