
0 ITEMS

Franchise Restaurant Financial Model Excel Template
The Restaurant Financial Model helps users turn a restaurant concept into a structured, editable financial forecast without building complex spreadsheets from scratch. It is designed to support the planning of a cafe, lounge, casual dining restaurant, food service concept, or hospitality business by organizing the assumptions that matter most, including customer volume, average check size, revenue mix, startup costs, operating expenses, payroll, cash flow, profitability, and funding needs. Instead of relying on guesswork, users can connect their business idea to a clear five-year projection and see how changes in pricing, traffic, staffing, and costs affect the overall financial picture. This financial model template is built for entrepreneurs, restaurant owners, founders, consultants, analysts, and anyone preparing business plans, investor materials, loan applications, or internal budgets. It provides a practical framework for evaluating whether the restaurant can generate enough revenue to cover food costs, labor, rent, marketing, overhead, debt obligations, and other recurring expenses. The model is especially useful for people who need to explain their assumptions clearly to lenders, investors, partners, or stakeholders, because it translates operational decisions into financial outputs such as profit and loss, cash flow, return metrics, and break-even analysis. The template includes pre-built formulas, editable input fields, professional formatting, visual dashboards, scenario tools, and lender-friendly reports. Users can adjust daily covers, weekday and weekend average check values, revenue stream percentages, cost of goods sold, payroll requirements, capital expenditures, funding sources, and other drivers to reflect their own restaurant concept. The result is a flexible planning tool that can be used before launch, during fundraising, or as part of an expansion review for an existing restaurant. By using the Restaurant Financial Model, buyers can save time, improve financial planning quality, and make more informed decisions about pricing, hiring, financing, marketing, and growth. The model helps users test low, base, and high scenarios, evaluate profitability timelines, review cash flow dynamics, and understand how quickly the business may reach break-even. Whether the goal is to open a new location, prepare a funding package, or pressure-test a food service business plan, this financial model template provides a ready-to-use foundation for disciplined restaurant financial forecasting.


Financial Model Overview
The Restaurant Financial Model is a ready-to-use financial model template created to help restaurant founders, operators, consultants, analysts, and business plan writers forecast the financial performance of a restaurant concept with greater structure and confidence. Restaurants are operationally complex businesses because revenue depends on customer traffic, seating capacity, check size, menu mix, repeat visits, event demand, and day-of-week patterns, while expenses are shaped by food costs, payroll, rent, equipment, utilities, marketing, and working capital needs.
This template brings those moving parts into one organized model so users can estimate startup investment, forecast revenue, plan operating expenses, evaluate cash flow, and understand the timing of profitability. It is fully editable, compatible with Microsoft Excel and Google Sheets, and suitable for preparing funding documents, internal budgets, investor presentations, lender submissions, or strategic planning reviews.
Instead of starting with a blank spreadsheet, users can work from a professional framework with built-in formulas, pre-formatted outputs, clear assumptions, and restaurant-specific drivers that can be customized to match a cafe, lounge, full-service restaurant, casual dining concept, or hybrid food and beverage business.
All-in-One Dashboard
The all-in-one dashboard gives users a central view of the most important inputs and outputs in the Restaurant Financial Model. This section is designed to simplify decision-making by bringing together the assumptions that drive the forecast and the results that matter most, such as revenue, profitability, cash position, funding needs, payback period, and return metrics. Users can review key variables like average check size, daily customer counts, growth rates, cost assumptions, and major expense categories, then see how those assumptions flow into the overall financial projection.
The dashboard is useful because restaurant planning often requires quick interpretation of many connected numbers, and a centralized summary helps owners and advisors avoid getting lost in separate schedules. It can support funding meetings, partner discussions, management reviews, and internal planning by giving stakeholders a practical snapshot of the business model, the expected financial outcomes, and the assumptions behind them. For users who are not finance specialists, this dashboard makes the model easier to navigate while still preserving the depth needed for professional planning.
Low, Base, and High Scenario Analysis
The Low, Base, and High scenario analysis component helps users evaluate how the restaurant may perform under different operating conditions. A restaurant forecast is highly sensitive to assumptions such as weekday covers, weekend covers, average check size, food cost percentage, labor efficiency, rent levels, marketing results, and customer retention. This section allows users to compare a conservative case, an expected case, and an upside case without rebuilding the model each time.
Inputs may include different customer volume assumptions, changes in menu pricing, variations in revenue mix, changes in supplier costs, or altered staffing requirements. Outputs may show how each scenario affects sales, EBITDA, net income, cash flow, break-even timing, payback period, and investment returns. This is valuable for planning because it helps founders and operators understand both risk and opportunity before committing capital. It can also strengthen investor and lender conversations because it demonstrates that the business has been evaluated under more than one set of assumptions. By stress-testing the plan, users can identify which levers matter most and prepare more resilient operating strategies.
Professional Charts
The professional charts component turns the restaurant forecast into visual reports that are easier to interpret, present, and discuss. Financial models can contain a large amount of detail, but investors, lenders, partners, and management teams often need quick visual summaries of performance trends. This section may visualize revenue growth, monthly sales performance, gross profit, EBITDA, net income, cash balances, expense composition, revenue mix, payback timing, and other key metrics.
The charts are connected to the underlying assumptions and financial statements, so when users update their inputs, the visuals update with the forecast. This makes it easier to explain how the restaurant is expected to grow over time, where the main costs are concentrated, and how profitability changes as volume increases. Professional charts are especially useful for business plans, pitch decks, loan packages, board discussions, and internal performance reviews because they communicate complex financial information in a concise format.
For restaurant owners, the visual output also helps identify trends that may be harder to spot in rows of numbers, such as margin improvement, seasonal cash needs, or the impact of revenue mix on profitability.
ROE Components and DuPont Analysis
The ROE components and DuPont analysis section helps users understand the drivers behind return on equity rather than viewing investor returns as a single isolated number. For a restaurant business, return on equity can be influenced by profitability margins, asset efficiency, capital structure, startup investment, retained earnings, and the way funding is used over time.
This component breaks return performance into underlying elements so users can see whether returns are being driven by strong operating margins, better use of assets, higher revenue relative to invested capital, or financial leverage. Inputs may include net income, revenue, total assets, equity investment, debt levels, retained earnings, and projected balance sheet values. Outputs may include return on equity, profit margin indicators, asset turnover, equity multiplier effects, and related investment performance measures.
This is useful for investors and founders because it explains not only what return the restaurant may generate, but why that return is being produced. It can also support strategic decision-making by showing whether improvements should come from increasing sales, improving margins, managing assets more efficiently, or adjusting the funding structure.
Revenue Inputs
The revenue inputs component is one of the most important parts of the Restaurant Financial Model because it defines the commercial assumptions that drive the forecast. Restaurant revenue is typically shaped by customer counts, average check size, opening days, weekday and weekend traffic patterns, event demand, menu pricing, and the mix of revenue streams.
This section allows users to enter or adjust assumptions such as daily covers, different average checks for weekdays and weekends, expected growth rates, seasonality, utilization levels, and the share of sales coming from cafe sales, lounge access fees, merchandise, events, catering, or other revenue categories that fit the concept. The outputs feed directly into monthly and annual revenue projections, helping users estimate how much income the restaurant may generate under realistic operating conditions.
This component is useful because small changes in covers or check size can have a major impact on restaurant profitability, staffing needs, inventory requirements, and cash flow. By making revenue assumptions explicit and editable, the model helps users build a forecast that is transparent, testable, and easier to defend in front of investors, lenders, partners, or internal decision-makers.
Bank-Ready Reports
The bank-ready reports component organizes the financial outputs that lenders and financing partners typically expect when reviewing a restaurant business plan. Restaurants often require external funding for leasehold improvements, kitchen equipment, furniture, opening inventory, licenses, deposits, payroll ramp-up, marketing, and working capital.
This section helps users present projections in a structured format that can support a loan application or funding conversation. It may include profit and loss projections, cash flow forecasts, balance sheet summaries, debt repayment schedules, startup funding uses, operating assumptions, and key financial ratios. Inputs from the rest of the model flow into these reports so the user can present consistent figures across the financial package. The outputs help lenders understand whether the restaurant can generate enough revenue and cash flow to cover operating expenses and debt obligations.
This section is valuable because it reduces the time required to prepare lender-friendly financial documents and helps users communicate the financial plan in a professional way. For founders seeking bank financing, SBA-style funding, private loans, or partner capital, clear and organized reporting can make the difference between a vague concept and a credible financial proposal.
Revenue Breakdown
The revenue breakdown component provides a detailed view of how the restaurant generates income across different streams, services, or customer offerings. A restaurant may not rely only on one source of sales; revenue can come from dine-in meals, beverages, cafe items, lounge access, merchandise, catering, delivery, private events, memberships, or seasonal promotions depending on the concept.
This section allows users to allocate total projected sales across categories and evaluate how each stream contributes to overall revenue. Inputs may include revenue stream percentages, pricing assumptions, volume drivers, category growth rates, and changes in mix over time. Outputs can show the monthly and annual contribution of each revenue category, percentage of total sales, growth by stream, and the effect of revenue mix on margins.
This is useful because different revenue streams often carry different cost structures and strategic implications. For example, beverage sales may have different margins than food sales, merchandise may require inventory planning, and events may create higher-volume opportunities with separate staffing needs. A clear revenue breakdown helps users identify which parts of the restaurant concept are most important to growth, profitability, and operating focus.
KPI Dashboard
The KPI dashboard component tracks restaurant performance metrics that help users evaluate whether the business plan is financially healthy and operationally realistic. In a restaurant model, revenue and profit are important, but they are not the only indicators that matter.
This section may include metrics such as average check, customer counts, revenue per day, gross margin, food cost percentage, labor cost percentage, prime cost, EBITDA margin, cash balance, occupancy cost ratio, payback period, return on equity, and break-even timing. Inputs come from revenue assumptions, cost schedules, payroll planning, capital investment, and financial statements, while outputs present the metrics in a concise and easy-to-review format. The KPI dashboard is useful because it connects day-to-day restaurant operations with financial performance.
Owners can use it to benchmark assumptions, monitor the pressure points in the business, and identify whether profitability is being limited by pricing, traffic, staffing, supplier costs, or overhead. For investors and lenders, KPI reporting also provides a more credible view of the business because it shows that the plan is not based only on top-line sales projections, but on the operational measures that determine whether a restaurant can perform sustainably.
Startup Costs and Capital Investment Plan
The startup costs and capital investment plan helps users estimate the funding required before the restaurant begins generating revenue. Opening a restaurant usually involves significant upfront spending, including leasehold improvements, kitchen equipment, furniture, point-of-sale systems, signage, deposits, licenses, permits, pre-opening payroll, initial inventory, launch marketing, professional fees, and working capital reserves.
This component allows users to organize these costs into a clear investment schedule and adjust each line item based on the size, format, and positioning of the restaurant. Outputs may include total startup funding required, capital expenditure summaries, pre-opening expense totals, timing of cash outflows, and the amount of funding needed from equity, debt, or other sources.
This section is important because underestimating startup costs is one of the most common planning mistakes in the restaurant industry. A detailed capital plan helps founders avoid funding gaps, prepare more realistic loan requests, and understand how much cash should be available before launch. It also supports better negotiations with landlords, contractors, equipment suppliers, and investors by giving the user a clearer view of the initial investment needed to open the restaurant properly.
Cash Flow and Break-Even Analysis
The cash flow and break-even analysis component helps users understand when the restaurant can cover its costs and whether it will maintain enough liquidity during the forecast period. A restaurant may appear profitable on paper but still face cash pressure due to startup spending, inventory purchases, payroll timing, debt service, seasonality, slow ramp-up periods, or unexpected operating expenses.
This section uses revenue projections, cost of goods sold, payroll, rent, overhead, taxes, capital expenditures, debt financing, and working capital assumptions to estimate monthly and annual cash movement. Outputs may include cash inflows, cash outflows, ending cash balance, minimum cash balance, break-even month, revenue required to cover fixed and variable costs, and the timeline for recovering the initial investment.
This is useful for decision-making because it helps users see whether the business needs additional working capital, a line of credit, revised staffing plans, stronger launch marketing, or different pricing assumptions. Break-even analysis is particularly important for restaurant planning because it shows the sales level required to sustain operations. By combining cash flow forecasting with break-even visibility, the model helps users plan for both profitability and liquidity, which are essential for long-term survival in food service.
File types:
Excel – Single-User: .xlsx
Excel – Multi-User: .xlsx
Similar ProductsOther customers were also interested in...

 HenrySheykin
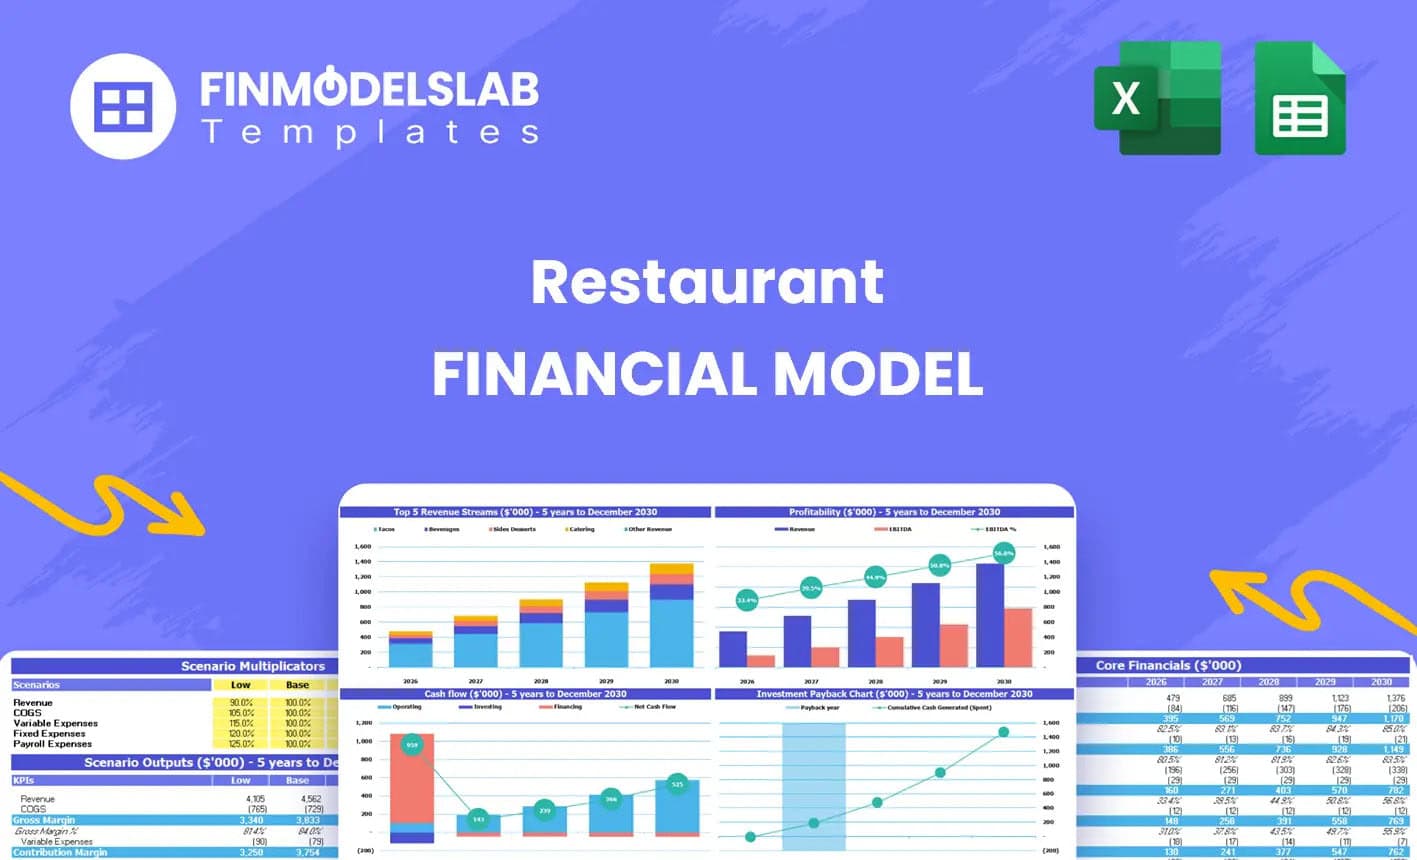
Restaurant Financial Model Excel Template
" The Restaurant Financial Model helps users turn a restaurant concept into a structured, editable f... Read more
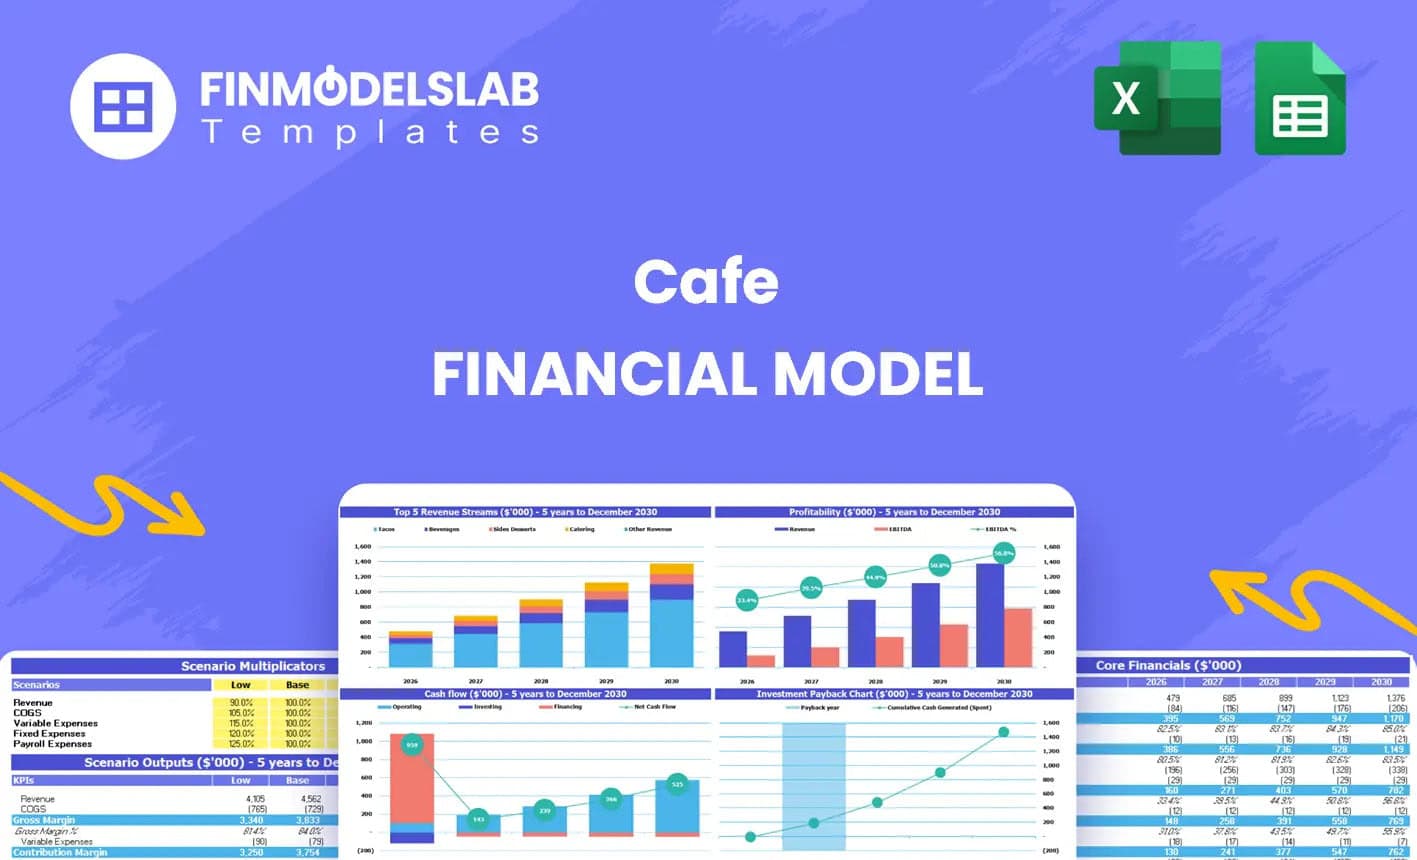
Cafe Financial Model Excel Template
The Cafe Financial Model is a ready-to-use financial model template designed to help entrepreneurs, ... Read more
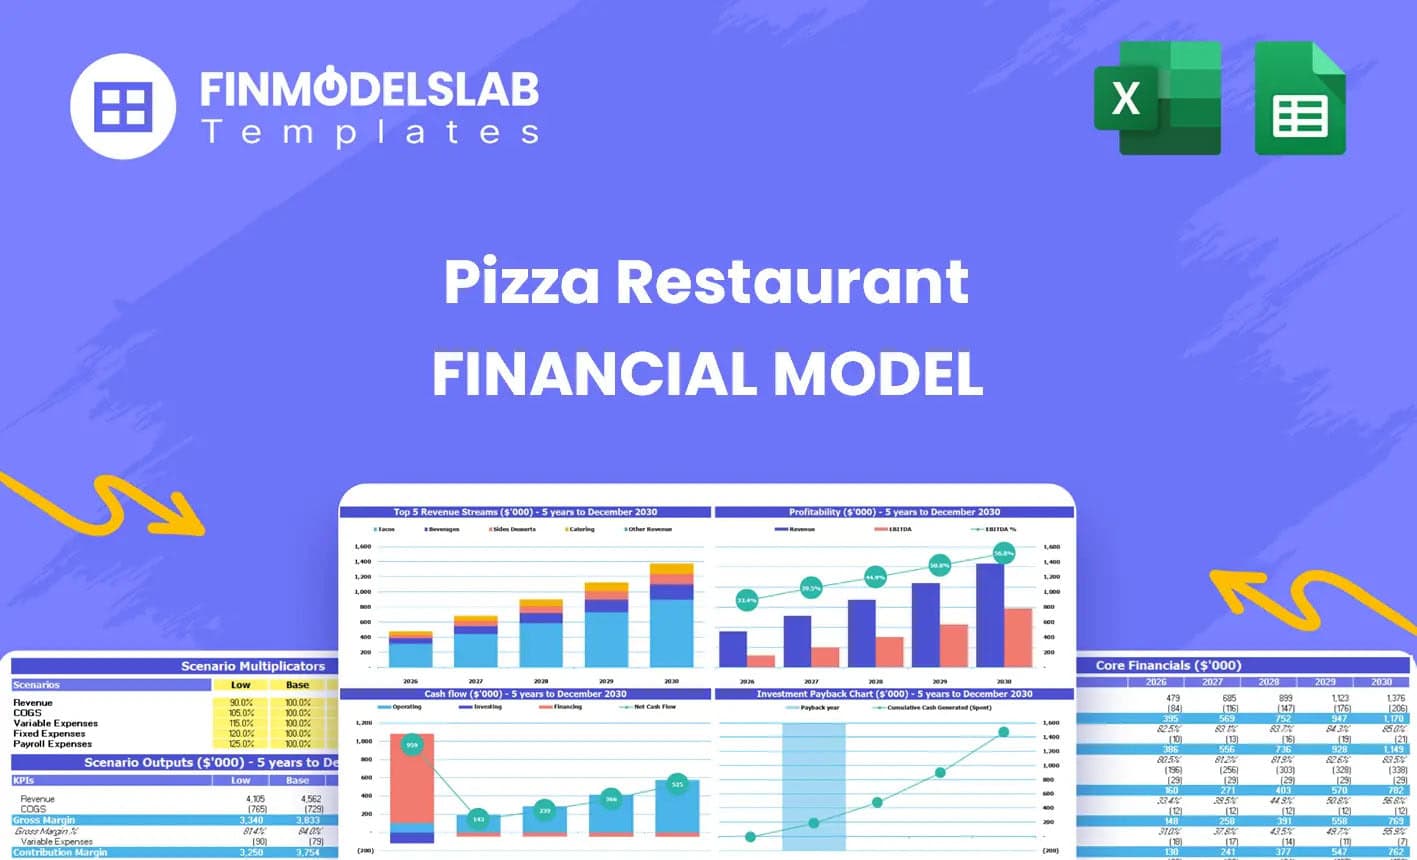
Pizzeria Financial Model Excel Template
The Pizza Restaurant Financial Model Template helps entrepreneurs, restaurant owners, consultants, a... Read more

Fast Casual Restaurant Financial Model Excel Templ...
The Fast Casual Restaurant Financial Model helps entrepreneurs, restaurant owners, consultants, anal... Read more

Pub Financial Model Excel Template
The Pub Financial Model helps entrepreneurs, pub owners, consultants, analysts, and business planner... Read more

Fine Dining Restaurant Financial Model Excel Templ...
The Fine Dining Restaurant Financial Model helps entrepreneurs, restaurant owners, consultants, anal... Read more

A La Carte Restaurant Financial Model Excel Templa...
The A La Carte Restaurant Financial Model Financial Model Template helps entrepreneurs, restaurant o... Read more
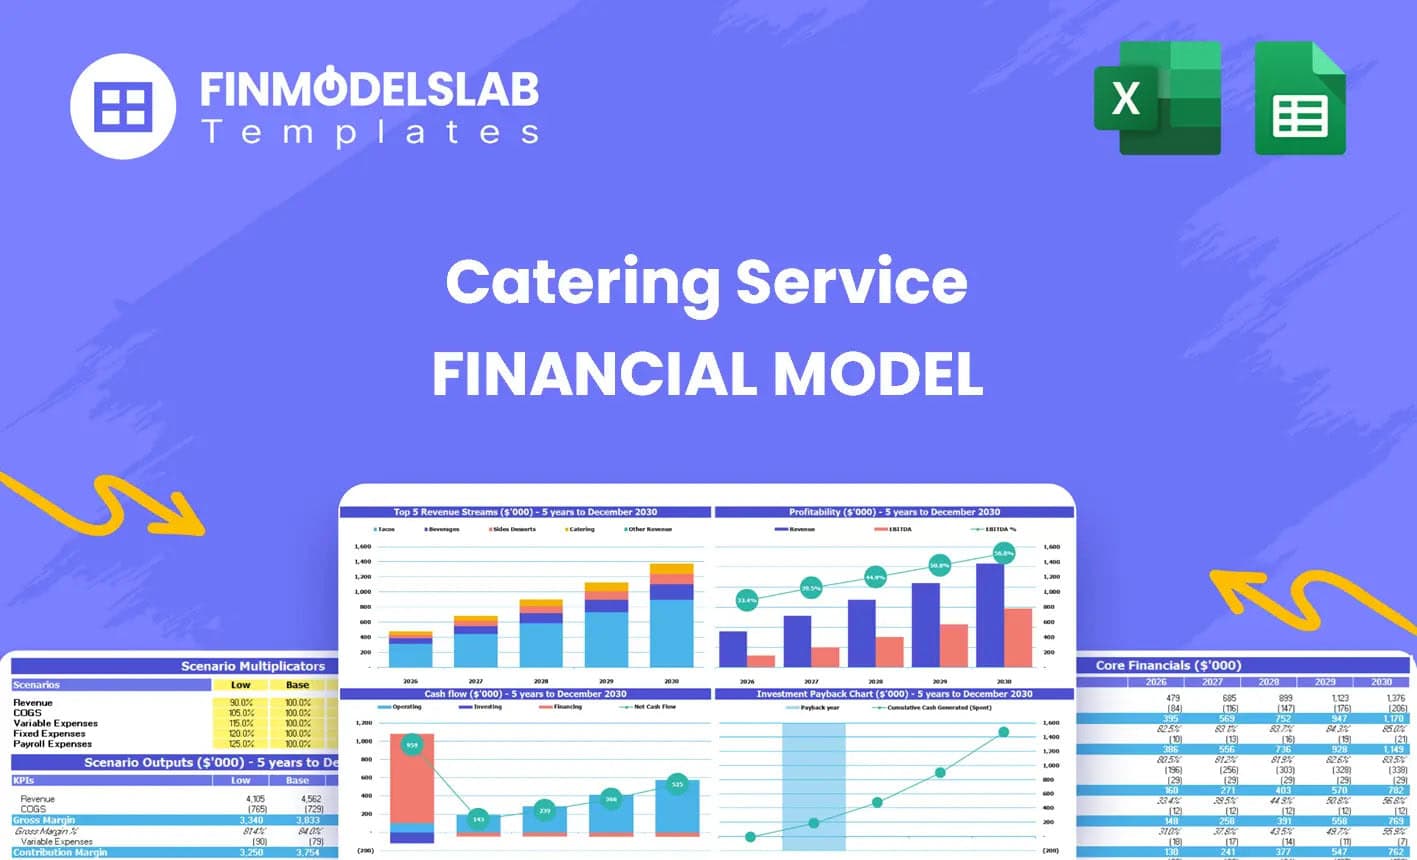
Catering Financial Model Excel Template
The Catering Service Financial Model helps users turn a catering business plan into a structured, ed... Read more
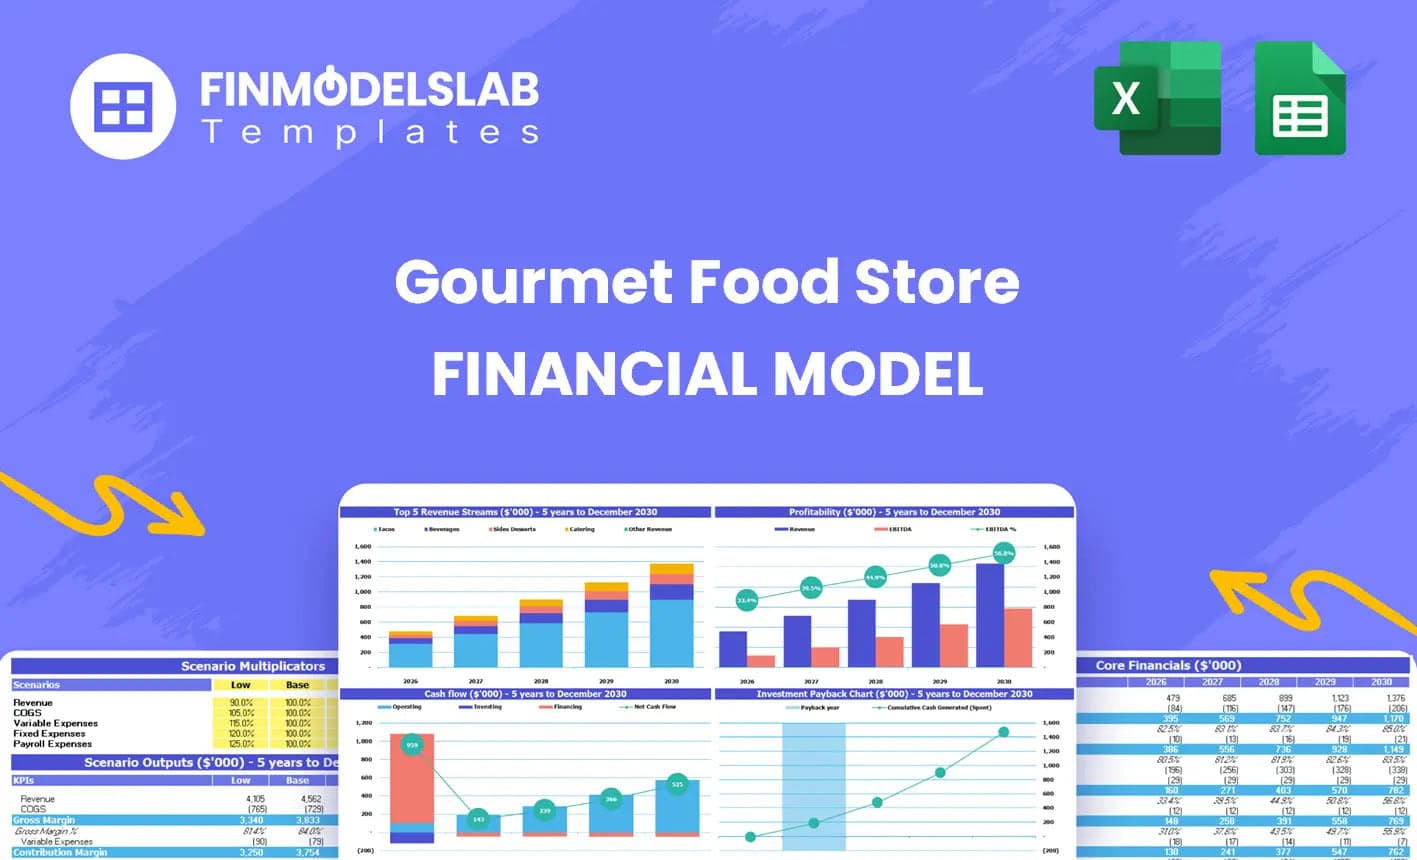
Gourmet Food Store Financial Model Excel Template
The Gourmet Food Store Financial Model helps entrepreneurs, founders, business owners, consultants, ... Read more
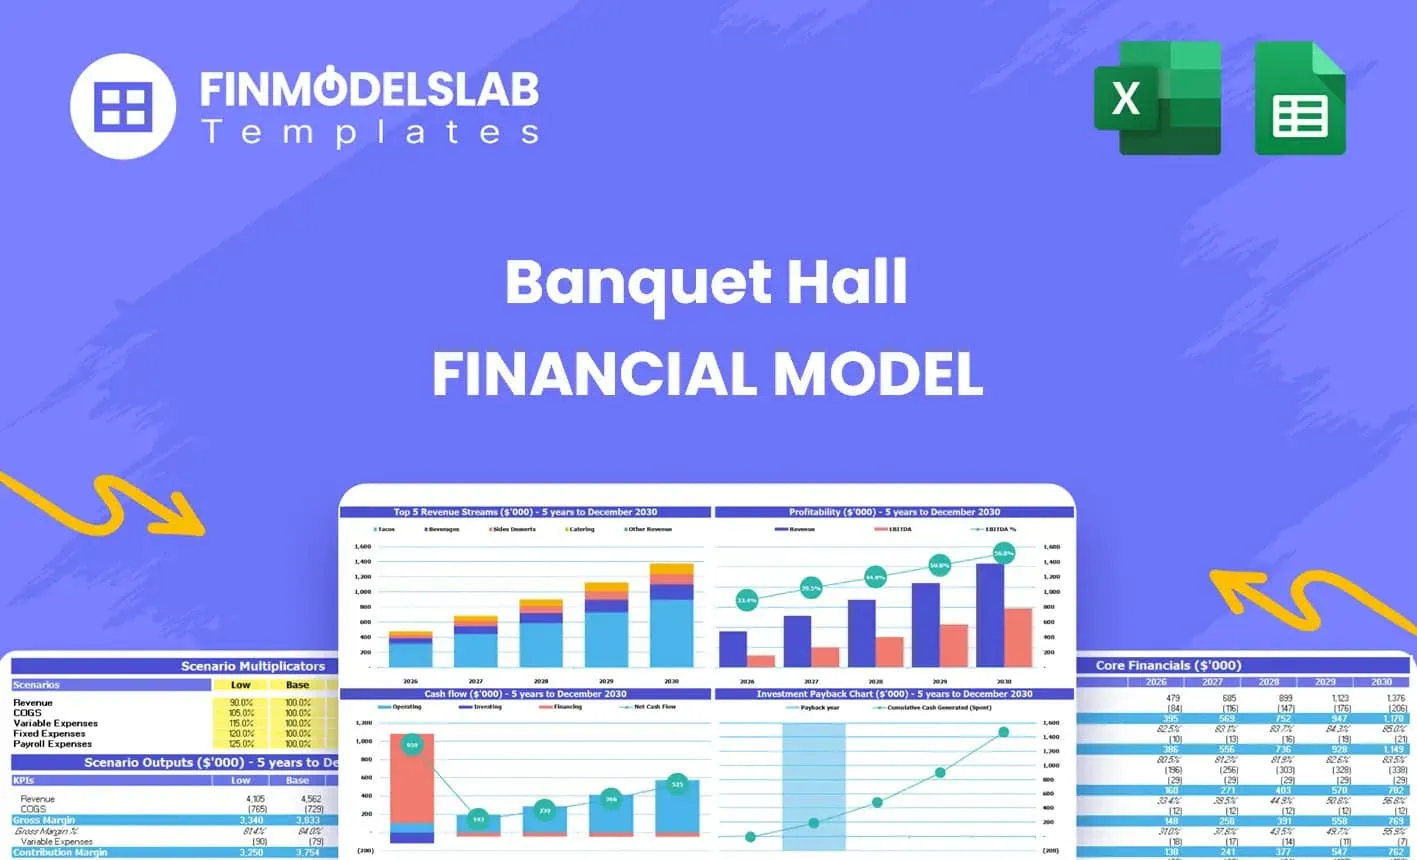
Banquet Hall Financial Model Excel Template
The Banquet Hall Financial Model helps entrepreneurs, venue owners, consultants, analysts, and busin... Read more
You must log in to submit a review.