Cap Table with Investor Returns and Charts
A cap table for up to five investment rounds and full exit for up to 10 common-stock investors. Includes derivative instruments and key profitability metrics for each investor. Accompanied by professionally designed magazine-quality charts.
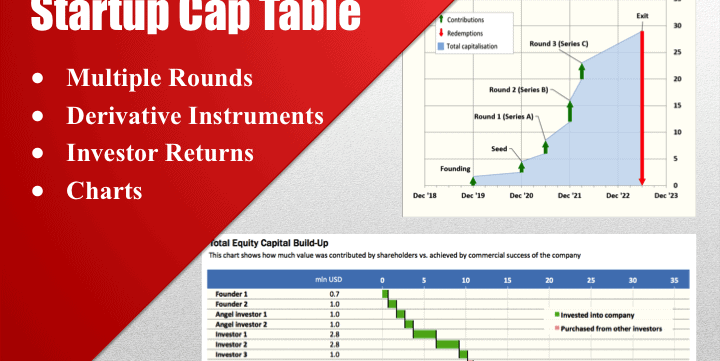
Most startups are initially financed by their founders. They contribute relatively small amounts of money for the company to make its first steps. If the business idea proves feasible, there will be the first real funding round (“seed” funding) when the company receives financing from external parties (often referred to as “angel investors”).
If following this round, the company performs well, there can be further drawdowns of external financing to keep the business growing. In most real-life examples there will be up to three rounds (Series A, Series B, and Series C), after which the company can go public or be sold to a strategic investor. At each funding round there will be changes in equity shares held by current shareholders based on the amounts contributed by the new investors and the market value of the company.
This template allows us to model up to five investment rounds and full exit for up to 10 common-stock investors. It includes derivative instruments (SAFE, employee stock options, convertible notes) and key profitability metrics for each investor (IRR, equity multiple, and gross return).
You can use this cap table to keep track of your investors or to build it into your financial models and analyze financing alternatives.
The table is accompanied by five professionally designed magazine-quality charts showing:
– changes in company valuation resulting from investor contributions and market value uplifts
– composition of final equity value by investor and overall equity value increase
– a snapshot of each investors contributions, distributions, and profitability
– holding period for each investor
Excel challenges:
– The XIRR function does not work if cash flows in the first period(s) are zero. This is the case for investors joining in the second round and thereafter. I am giving a smart escape from this limitation.
– There is a capitalization chart depicting investor contributions at each round and a steady equity appreciation on a time scale. This chart is somewhat unusual – but I will show you the trick!
This model template comes in three versions in .xlsx file types which can be opened using MS Excel.
- Template 1 – Simple cap table with investor returns
- Template 2 – Cap table with investor returns and charts
- Template 3 – Cap table with derivative instruments, investor returns, and charts
Similar Products
Other customers were also interested in...
Private Equity Fund Model (Investor Cashflows)
Private Equity Financial Model to analyze fund cashflows and returns available to Limited Partners (... Read more
Leveraged Buyout (LBO) Financial Projection Model
User-friendly financial model to project and analyse the financial outcomes (IRR, projected financia... Read more
Investment Holding Company 3 Statement Financial P...
3 statement 5 or 8 year rolling financial projection Excel model for an investment holding company h... Read more
Amortization Schedules Template (Loans, Mortgages,...
User friendly template including Amortization Schedules for Loans, Mortgages, Operating and Finance ... Read more
Mergers and Acquisition (M&A) Financial Projec...
User-friendly financial model to project and analyze the financial outcomes and feasibility of an Me... Read more
Due Diligence Tools and Methods
A suite of best practices to perform financial and commercial due diligence. Use it if you are consi... Read more
Complete Private Equity (LBO) Financial Model
This is a professional financial model which performs a thorough assessment of a private equity proj... Read more
Complete Three-Statement Monthly Budget with Scena...
This is a comprehensive set of templates that will help you build your budget. The templates are bui... Read more
Complete Three-Statement Quarterly Budget with Sce...
This is a comprehensive set of templates that will help you build your budget. The templates are bui... Read more
Complete Three-Statement Monthly Budget
This is a comprehensive set of templates that will help you build your budget. The templates are bui... Read more
You must log in to submit a review.


