Budget vs. Actual – Real Estate Development Financial Planner (48 months)
This template is a great way to plan out the equity and debt requirements of a real estate development project over time. Data entry happens on a monthly basis over 48 months for both the budget and actual areas.

Video Tutorial:
One of the hardest things to track is when a developer is building out a project and selling previously completed phases while new construction is still happening. This is the core problem that was addressed when designing this financial model template. Also, the data entry on this is a bit different. Normally there will be some kind of assumptions tab to figure out when various values should fall into various months for costs and sales proceeds. In this template, the data can be entered across any number of months on the actual model tabs.
There are up to 3 phases that have their own sales proceeds (based on units sold / average unit price in each month) and soft/hard cost sections. The idea is to plan out the expected budget of all phases on a single model tab. The same can be done on a separate tab for ‘actuals’ as those happen. On each of those tabs, the line items will be totaled on the far left of the tab so at any given time the user can see the total budgeted amount for each line item as well as the actual for that line item and the % the actual is of the budget. This is included in the ‘equity requirement’ area as well.
There are three ‘phase’ tabs that automatically pull the sub-totals in so that they can be analyzed individually if needed. Then the total soft costs are also pulled into their own tab.
The more advanced logic comes in when figuring out the amount of debt vs. equity that is needed. That is based on a user-defined LTV, which will take any months where the costs are greater than the sales proceeds (most months in a construction project) and split it up between a loan and equity. If there is not going to be debt, the LTV % can be set to 0.
The interest reserve is entered along with the other hard cost items. That is always the last row for each phase section because it is referenced against interest accrued in order to track if any more interest must be paid in the end or if some of the reserves should be credited back when all the debt has been repaid.
There are three summary charts (added after the video was done) that show the budget vs. actual for equity requirement, cash flow, and equity position across 48 months’ time. Also, the summary tab shows the total proceeds, total equity requirement, and the resulting IRR, ROI, equity multiple, and net proceeds from the entire development project.
To use this excel template, the user will only adjust cells with blue text in a light yellow shade.
Similar Products
Other customers were also interested in...
Public-Private Partnership (PPP) Financial Model
Financial Model presenting development and operating scenarios of various projects under a Public-Pr... Read more
Industrial Building Development Financial Model (C...
Financial model presenting a development scenario for an Industrial Building including construction,... Read more
Pre Sold Apartments Real Estate Model Template
Pre-Sold Apartments Real Estate Model presents the case where a land plot is purchased and an apartm... Read more
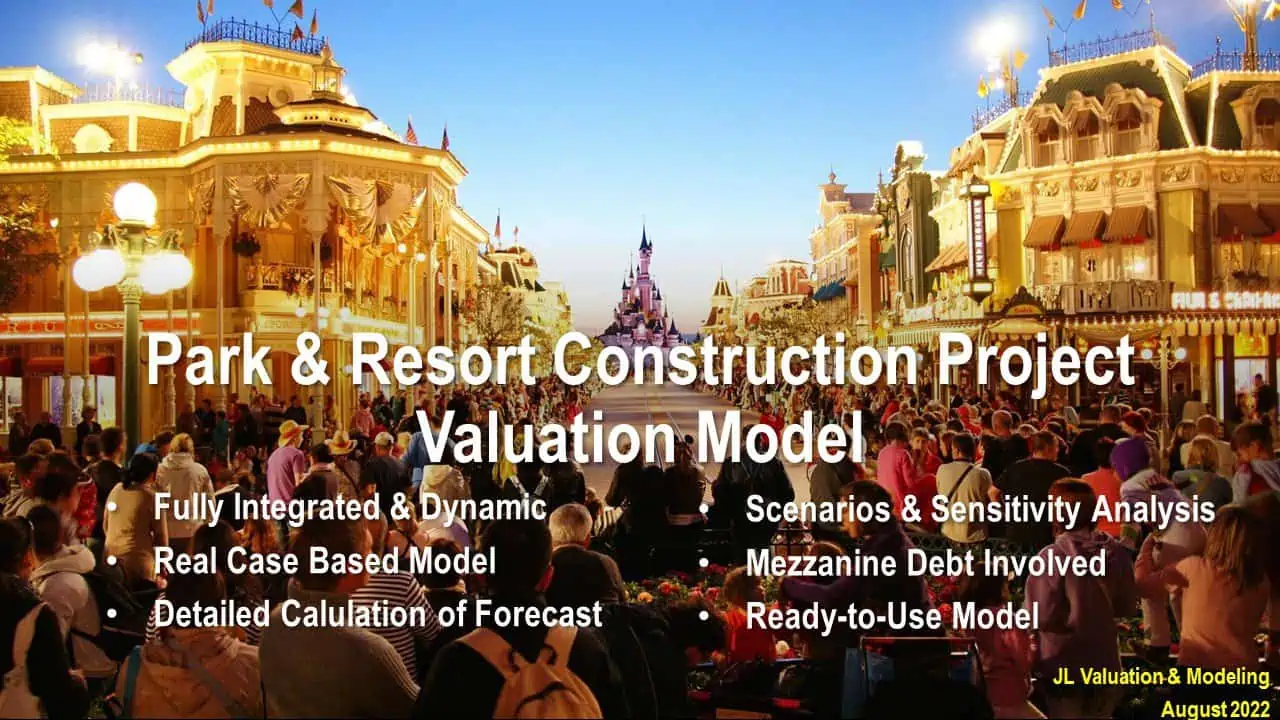
Park & Resort Construction Project Integrated ...
This model is to provide users an integrated and fully customized Park & Resort Construction Pro... Read more
Construction / Development Financial Model
Development & Construction Model presents the case where a property with multiple residential un... Read more
House Flipping – Rehab Financial Model
The house flipping financial model is a comprehensive tool designed to analyze the financial aspects... Read more
Quantity Surveyor / Architect – Project Fina...
This Project Feasibility Model is purpose-built to assist Quantity Surveyors, Architects, Developers... Read more
Real Estate Financial Model Template Bundle
This Real Estate Financial Model Template Bundle is best for those who are real estate professionals... Read more
Mobile Home Park / Community Financial Feasibility...
Plan out all aspects of starting up to 40 mobile home communities or parks. End to end from assumpti... Read more
Joint Venture and Fund Cash Flow Waterfall Templat...
Here are all the spreadsheets I've built that involve cash flow distributions between GP/LP. Include... Read more
You must log in to submit a review.


