Analyzing Sensitivities with Indifference Curves
An Excel utility to draw indifference curves for two inputs of a model
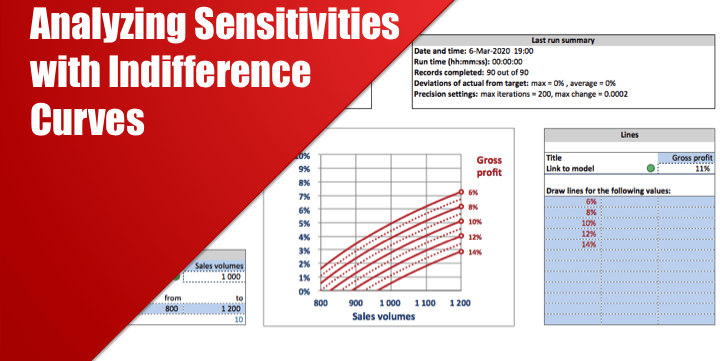
Indifference curves is a smart analytical tool showing the cross-sensitivity of output to two inputs. Each curve corresponds to a fixed output value and shows at which combination of the two inputs this output remains at the same level (or is indifferent, hence the name of the chart type).
Looking at indifference curves one can answer trade-off questions such as:
– if we lose a certain volume of one product, by how much shall we raise sales of another one to keep profits stable?
– if we reduce the price of a product, how much additional volume of this product do we need to sell to make this profit-neutral?
– what share of a country’s market can we sacrifice if we increase our share in another country’s market by x %?
– etc. etc.
The utility is available in two versions:
1) A fully functional file but with VBA code locked
2) Same file with VBA code unlocked
Similar Products
Other customers were also interested in...
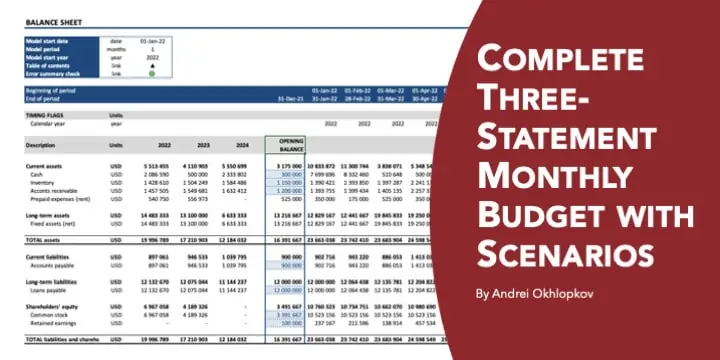
Complete Three-Statement Monthly Budget with Scena...
This is a comprehensive set of templates that will help you build your budget. The templates are bui... Read more
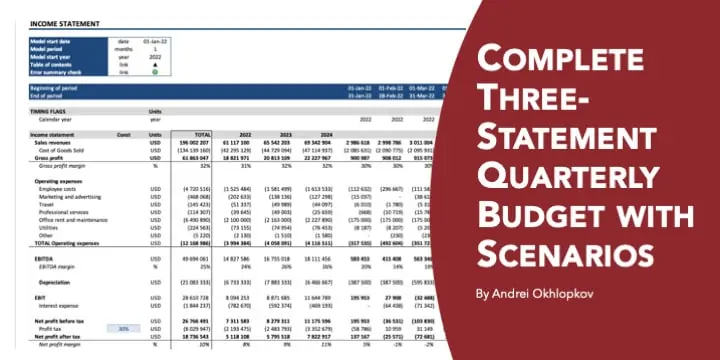
Complete Three-Statement Quarterly Budget with Sce...
This is a comprehensive set of templates that will help you build your budget. The templates are bui... Read more
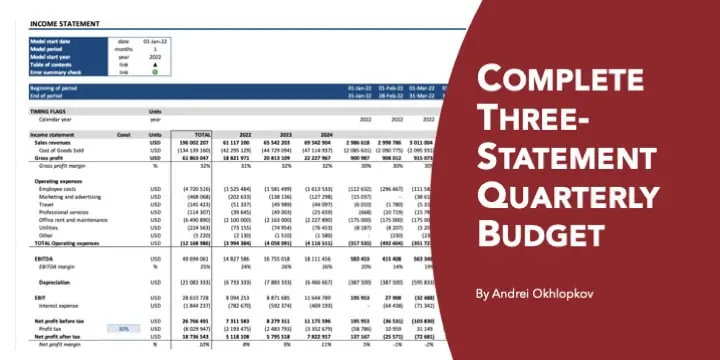
Complete Three-Statement Quarterly Budget
This is a comprehensive set of templates that will help you build your budget. The templates are bui... Read more
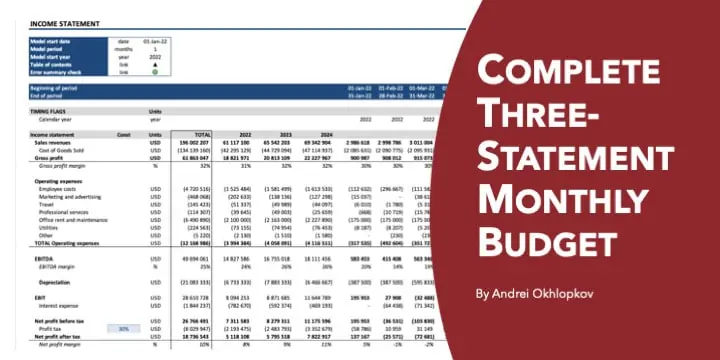
Complete Three-Statement Monthly Budget
This is a comprehensive set of templates that will help you build your budget. The templates are bui... Read more
Complete Private Equity (LBO) Financial Model
This is a professional financial model which performs a thorough assessment of a private equity proj... Read more
Private Equity Fund Model (Investor Cashflows)
Private Equity Financial Model to analyze fund cashflows and returns available to Limited Partners (... Read more
All My Financial Models, Spreadsheets, Templates, ...
Lifetime access to all future templates as well! Here is a set of spreadsheets that have some of the... Read more
Startup Company Financial Model – 5 Year Fin...
Highly-sophisticated and user-friendly financial model for Startup Companies providing a 5-Year adva... Read more
Due Diligence P&L – Exhaustive Revenue a...
Model for in depth understanding of high level profit and loss and revenue analysis. Big-4 like chec... Read more
Franchisor Licensing: Financial Model with Cap Tab...
Build up to a 10 year financial forecast with assumptions directly related to the startup and operat... Read more
You must log in to submit a review.


