
0 ITEMS

Canada Holding Company Tax Planner Financial Model: Salary vs Dividend, Opco Holdco, RDTOH, CDA, GRIP, Passive Income Grind, All Provinces
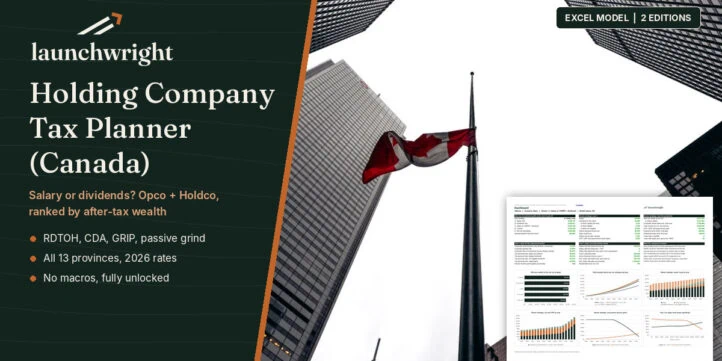
Excel tax planner for Canadian owner-managers with an operating company and a holding company. It solves the salary or dividend that funds your spending each year, tracks RDTOH, CDA, GRIP and the passive income grind, and ranks up to five pay strategies by after-tax wealth. All 13 provinces and territories, 2026 rates.
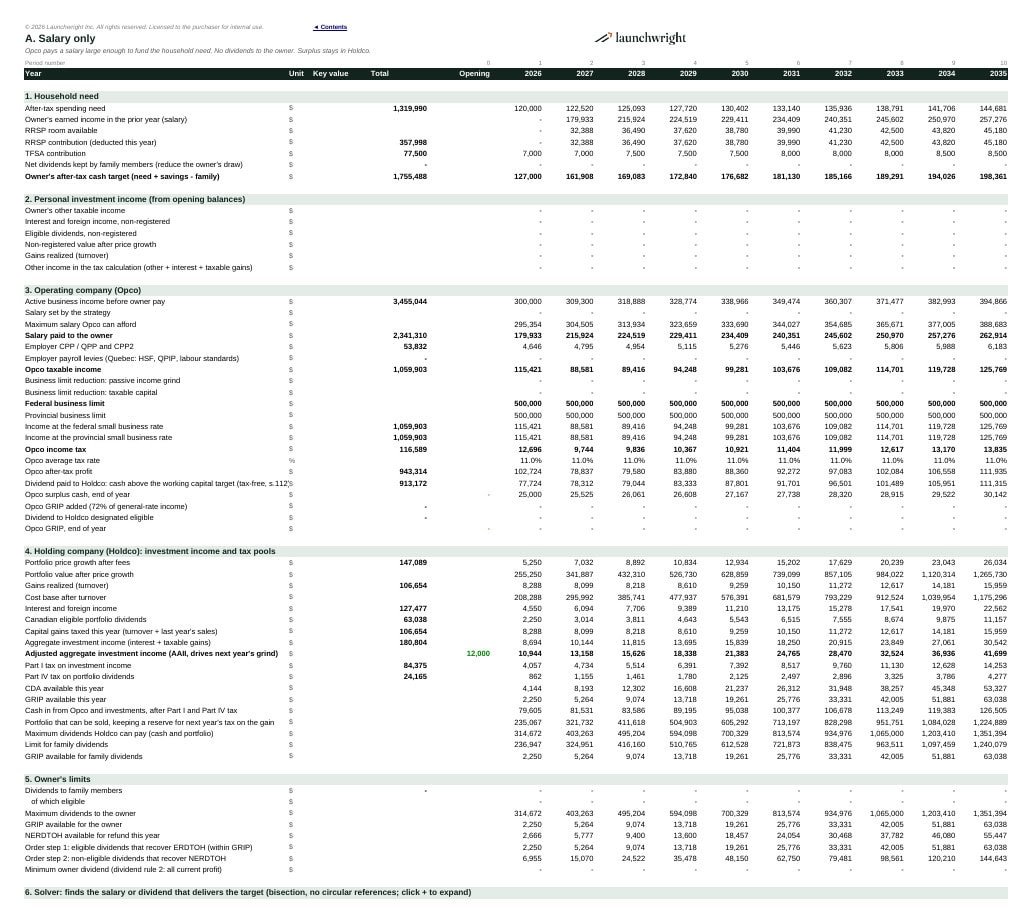
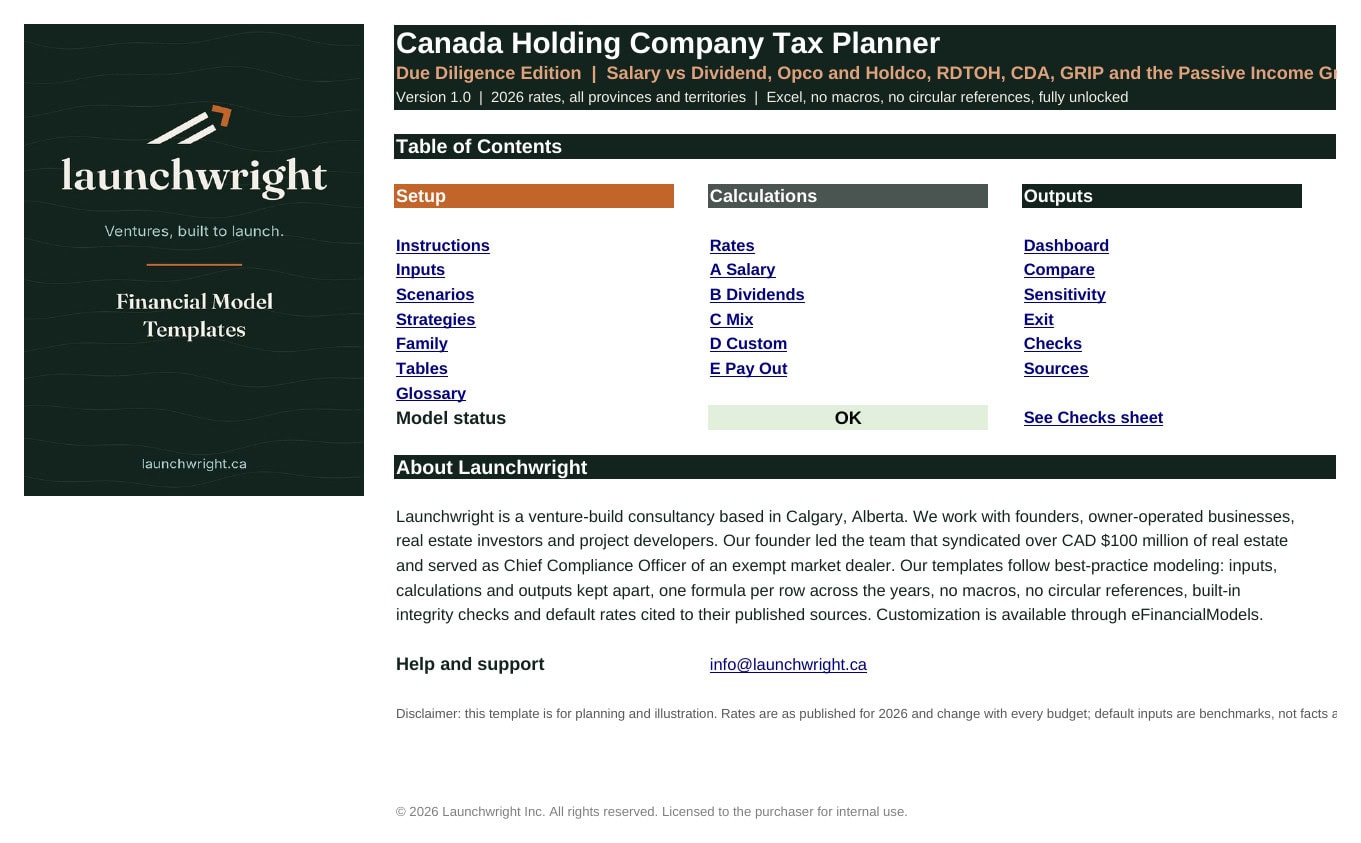
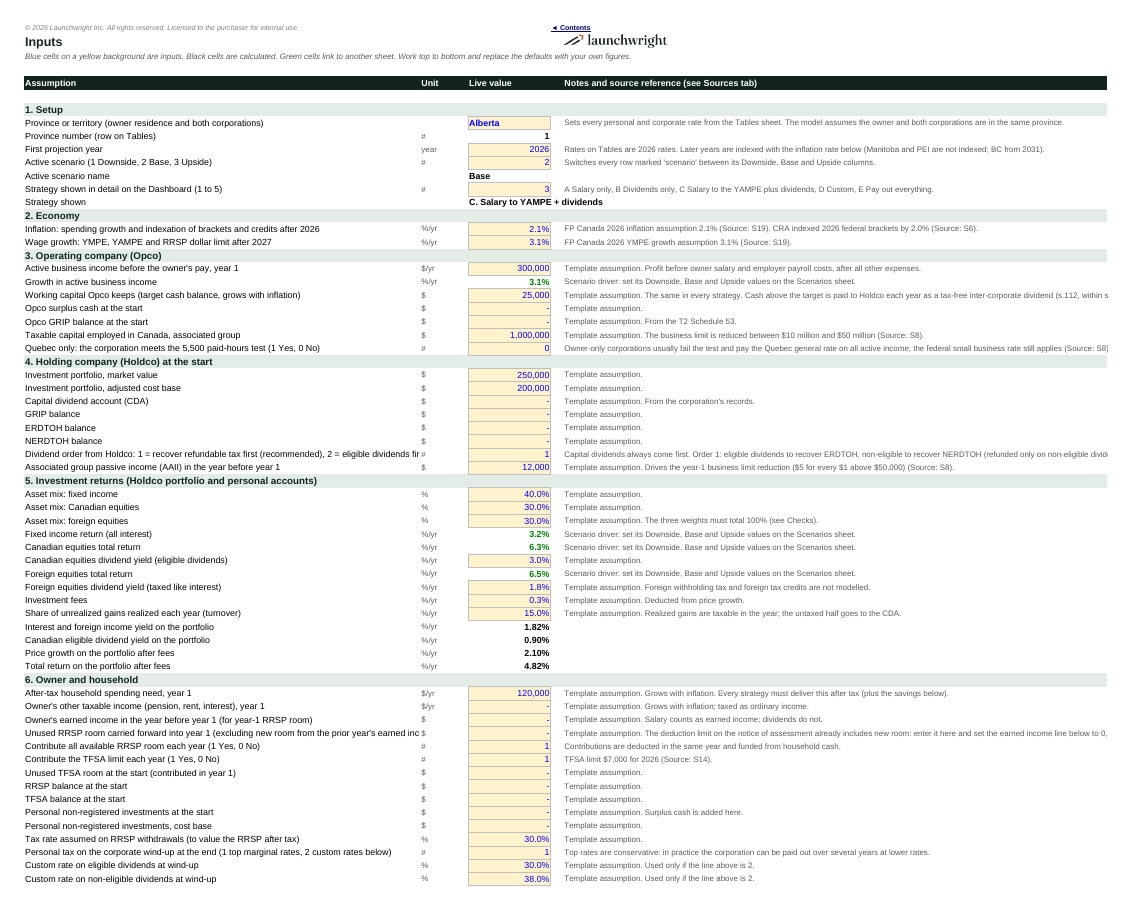
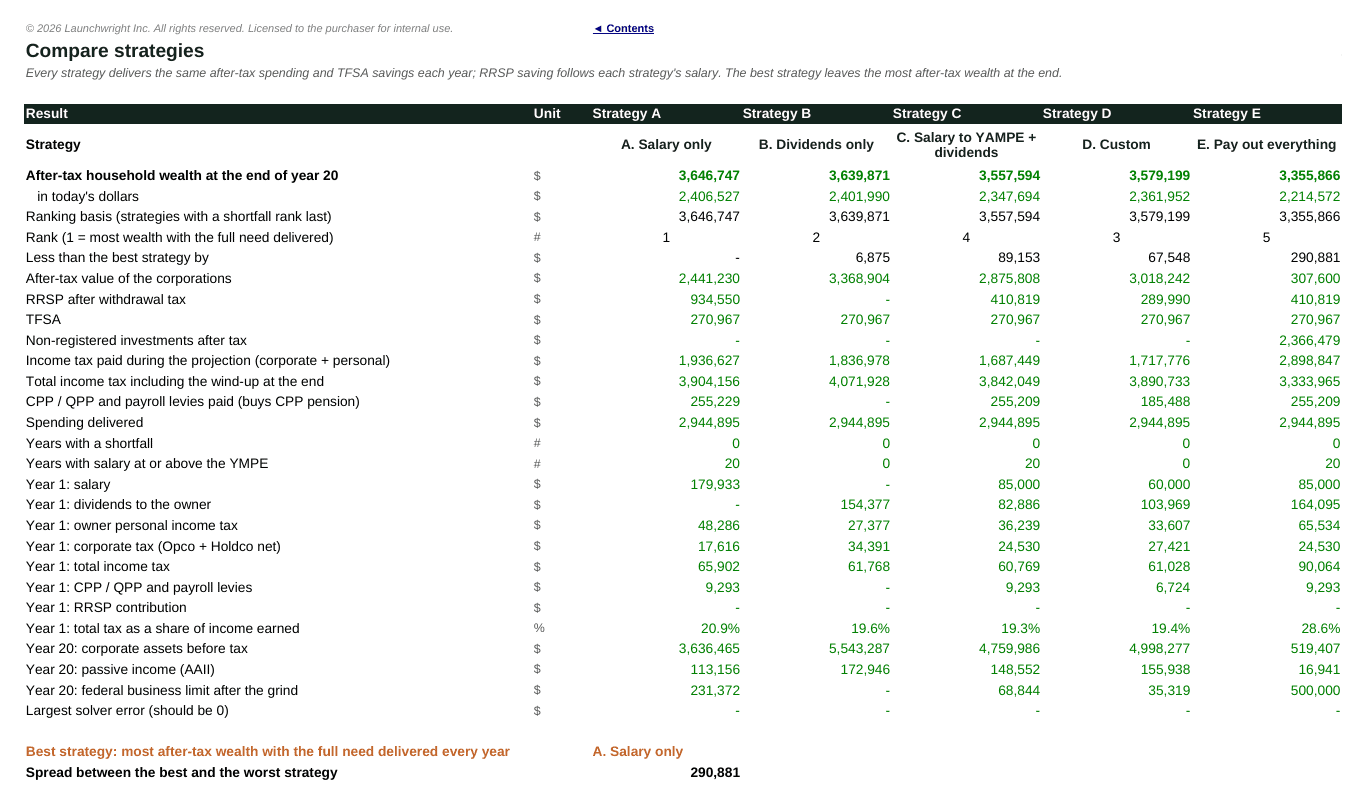
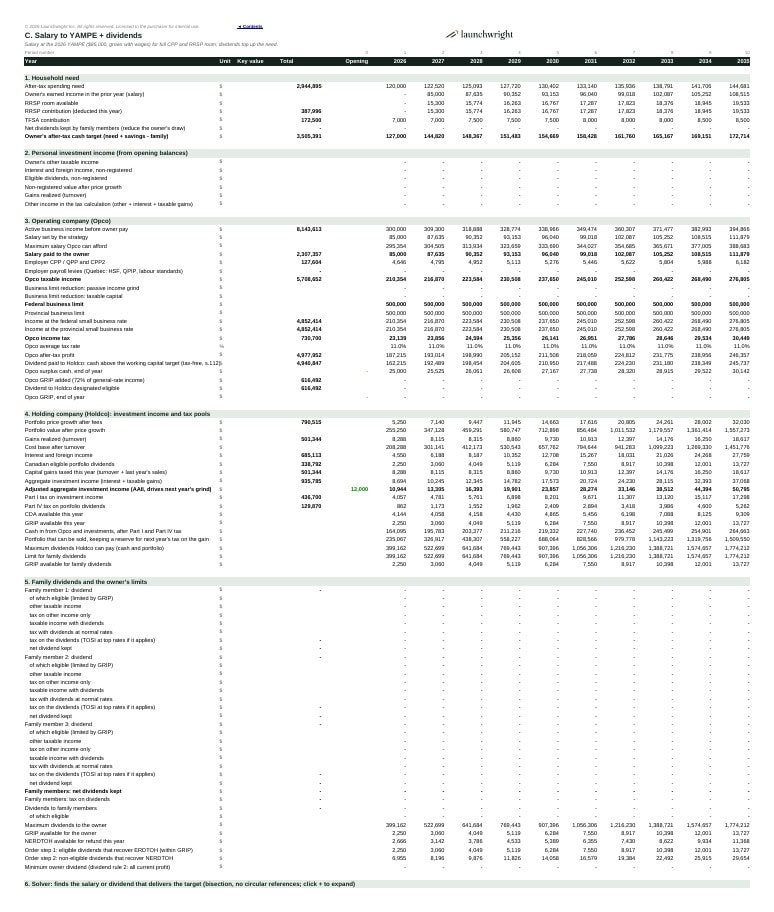
Should you pay yourself a salary or dividends, and is it worth leaving profit in a holding company? Free calculators answer for one year at one income. This model answers the real question: which way of paying yourself leaves your household with the most after-tax wealth over 10 or 20 years, once both corporations are wound up?
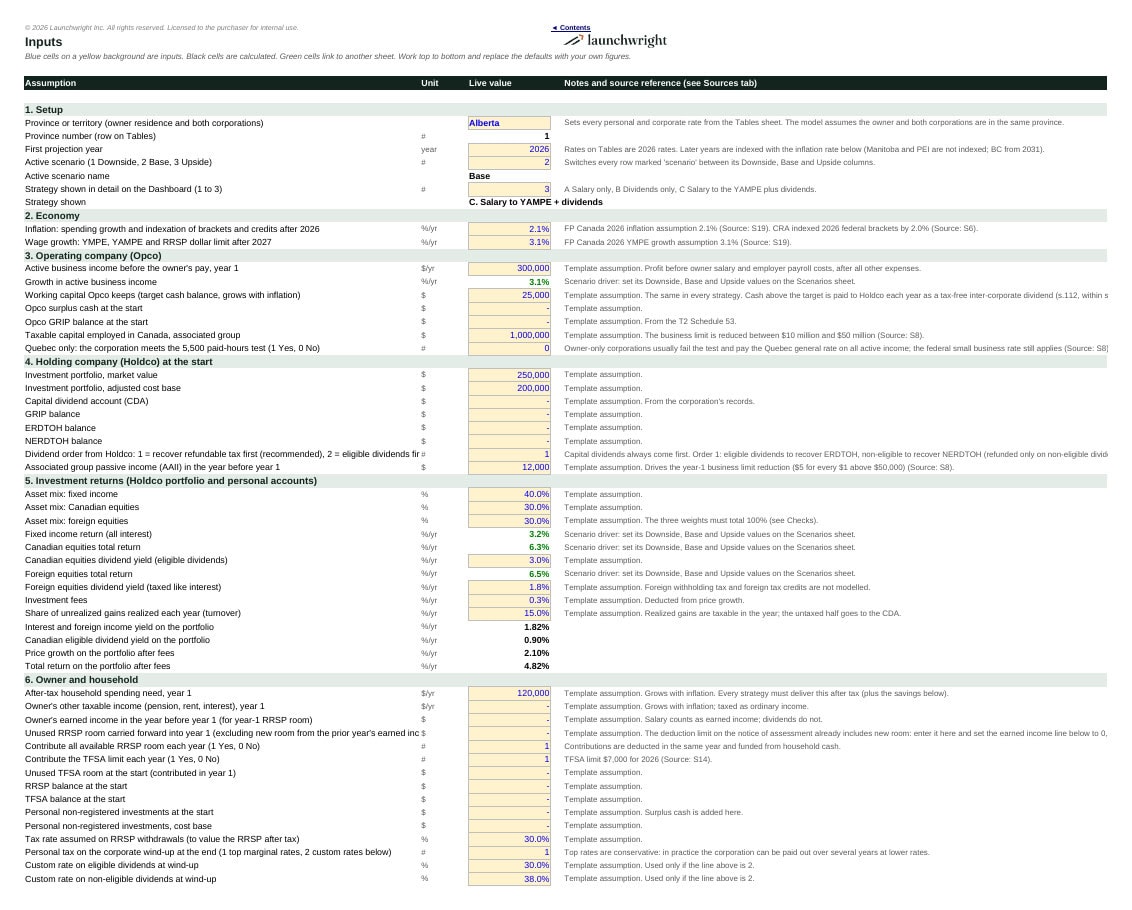
You enter your province, your business income before your pay, your Holdco’s portfolio and tax pools, and what your household needs to spend after tax. For every year and every strategy, the model solves the exact salary or dividend that delivers that need, plus your TFSA and the RRSP room your salary creates, then follows the money through Opco, Holdco and your personal accounts. Because every strategy funds the same spending, the after-tax wealth at the end can be compared directly.
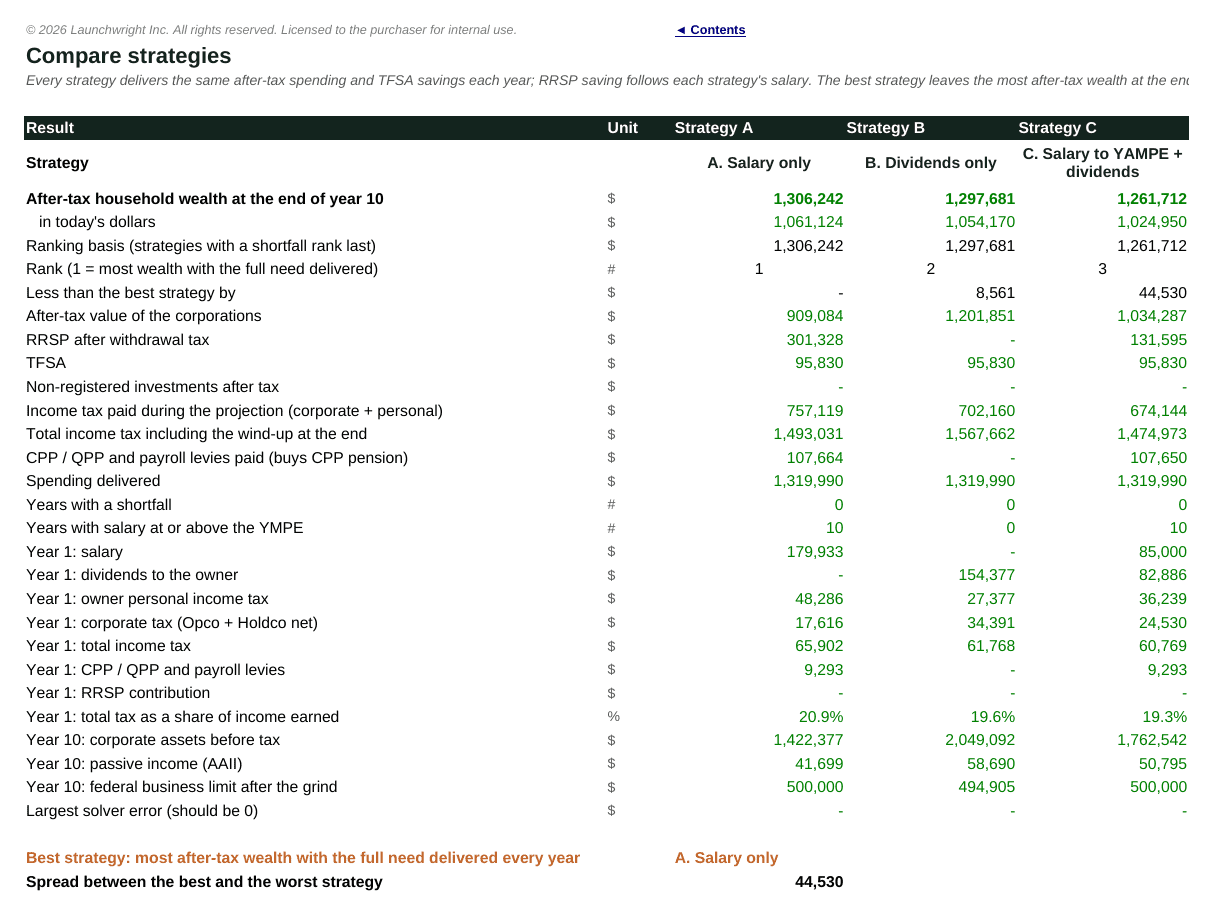
Strategies compared side by side
- A. Salary only, solved each year to fund the need; surplus stays in Holdco
- B. Dividends only: capital dividends from the CDA first, then eligible dividends up to GRIP, then non-eligible dividends
- C. Salary at the YAMPE ($85,000 in 2026) for full CPP and RRSP room, with dividends topping up
- Due Diligence Edition adds D. Custom (your own salary schedule and payout rule) and E. Pay out everything and invest personally, which isolates the value of corporate deferral
Canadian tax rules built in
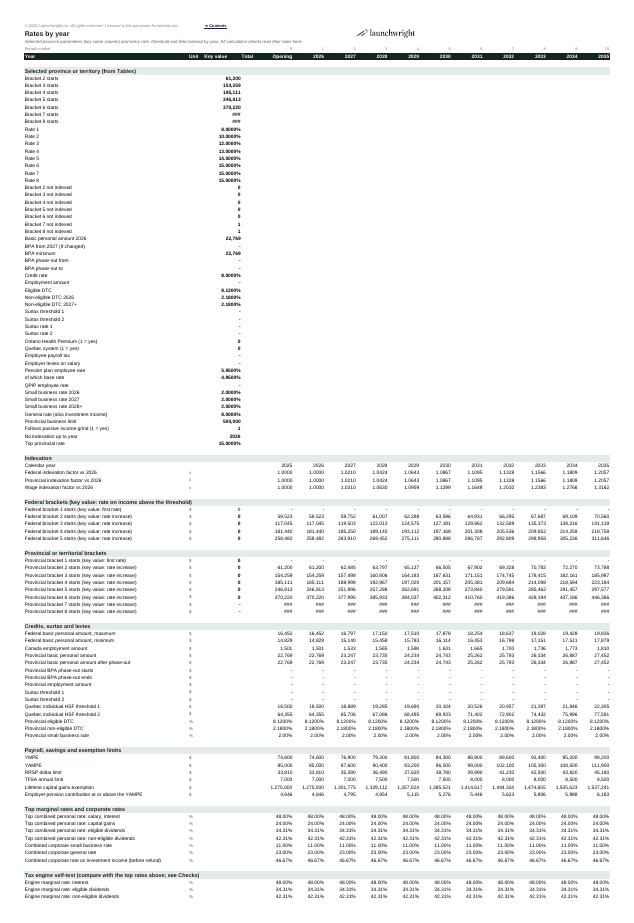
- Federal and all 13 provincial and territorial 2026 brackets, basic personal amounts with their phase-outs, CPP or QPP credits and deductions, the Canada employment amount, dividend gross-ups and tax credits, the Ontario surtax and Health Premium, the Quebec abatement and Health Services Fund contribution, and the NWT and Nunavut payroll tax
- Opco: small business rate up to the business limit, reduced by the passive income grind and the taxable capital grind. Ontario and New Brunswick keep their provincial limit; Quebec’s 5,500-hour test is a switch
- Holdco: Part I tax on investment income, Part IV tax on portfolio dividends, ERDTOH and NERDTOH with dividend refunds at 38 1/3%, CDA from capital gains, GRIP from Opco’s general-rate income, and tax-free inter-corporate dividends. Dividends are paid in the order that recovers the most refundable tax at the lowest personal tax
- Personal: RRSP room from salary, TFSA contributions, a non-registered account for surplus cash, and indexation of brackets, YMPE and limits every year
Results
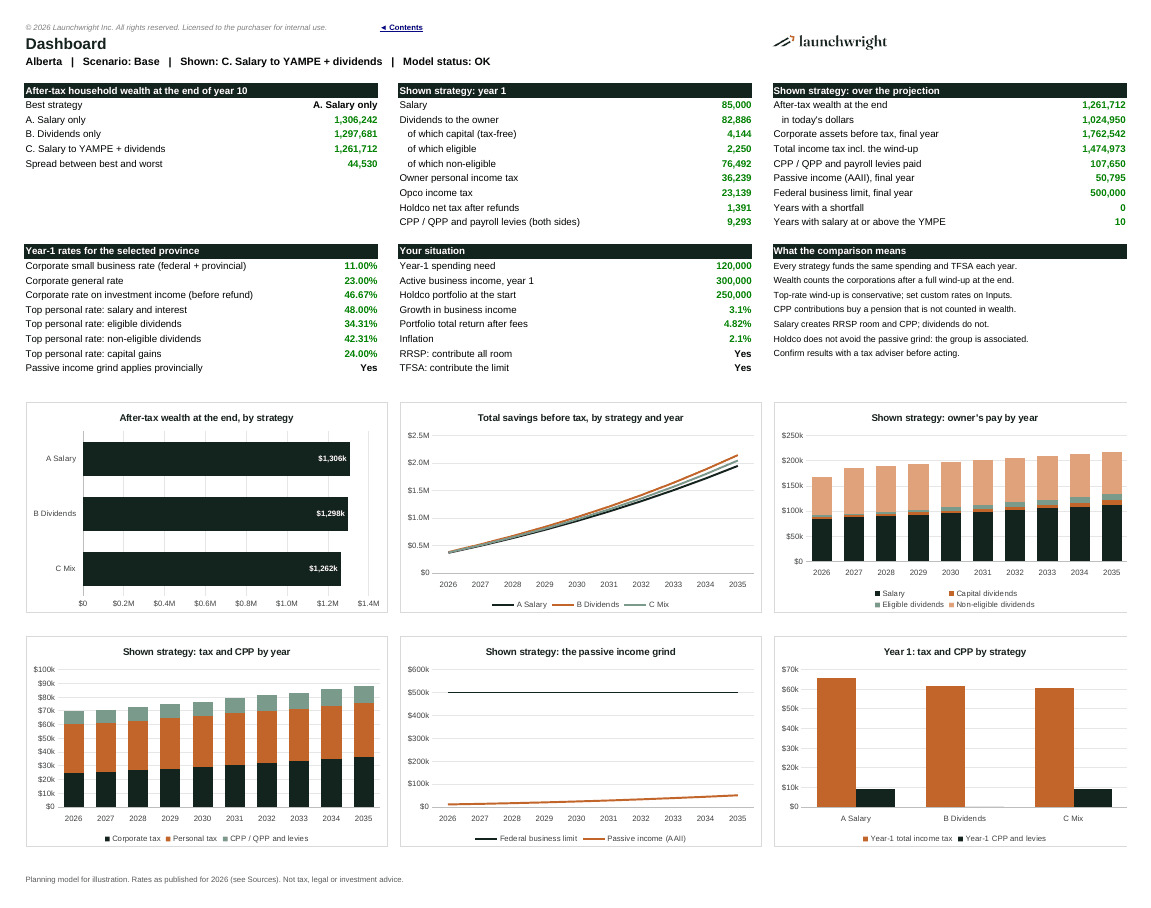
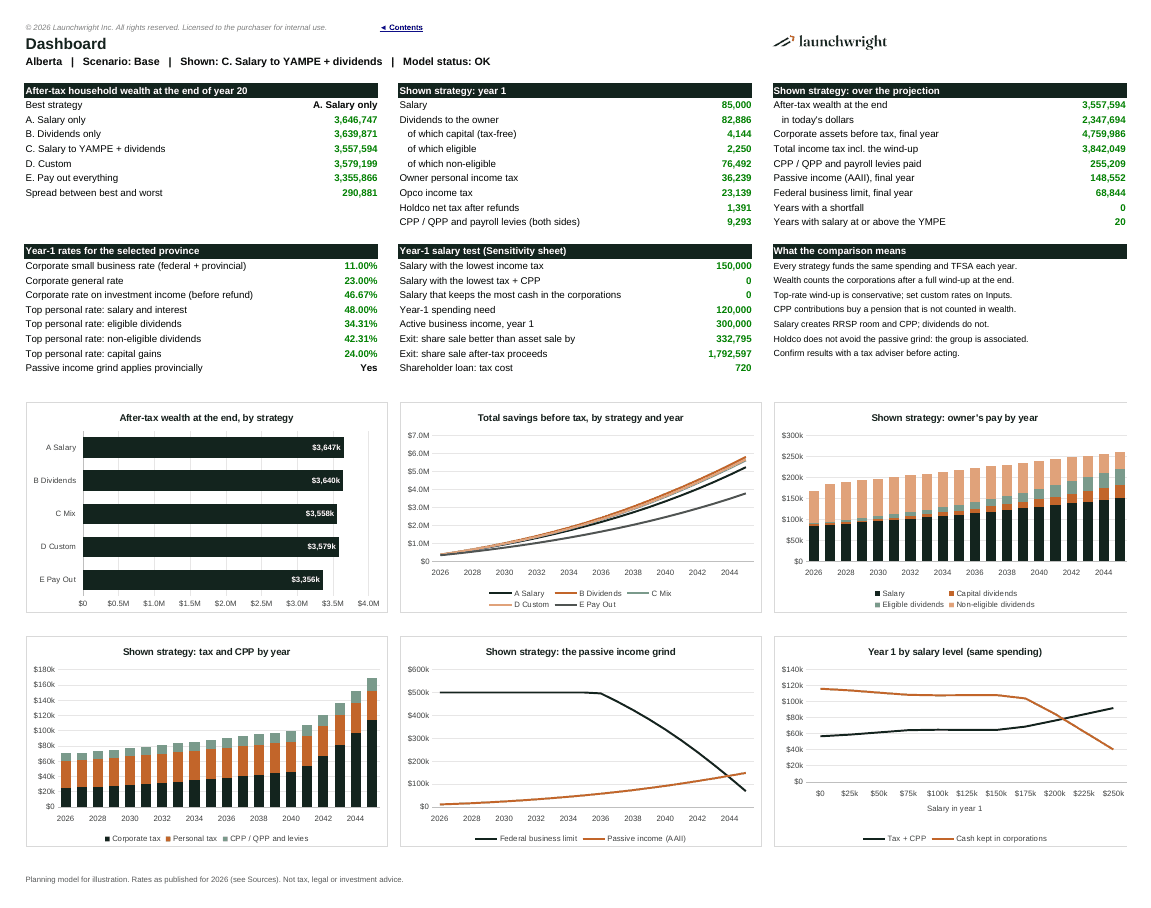
- After-tax household wealth at the end for every strategy, in nominal and today’s dollars, with a ranking that puts any strategy with a funding shortfall last
- Total tax over the projection both before and including the wind-up, so deferral strategies are not flattered
- Year-by-year salary, dividends by type, personal and corporate tax, CPP, the business limit and passive income
- Dashboard with six charts, including the passive income grind and the owner’s pay mix
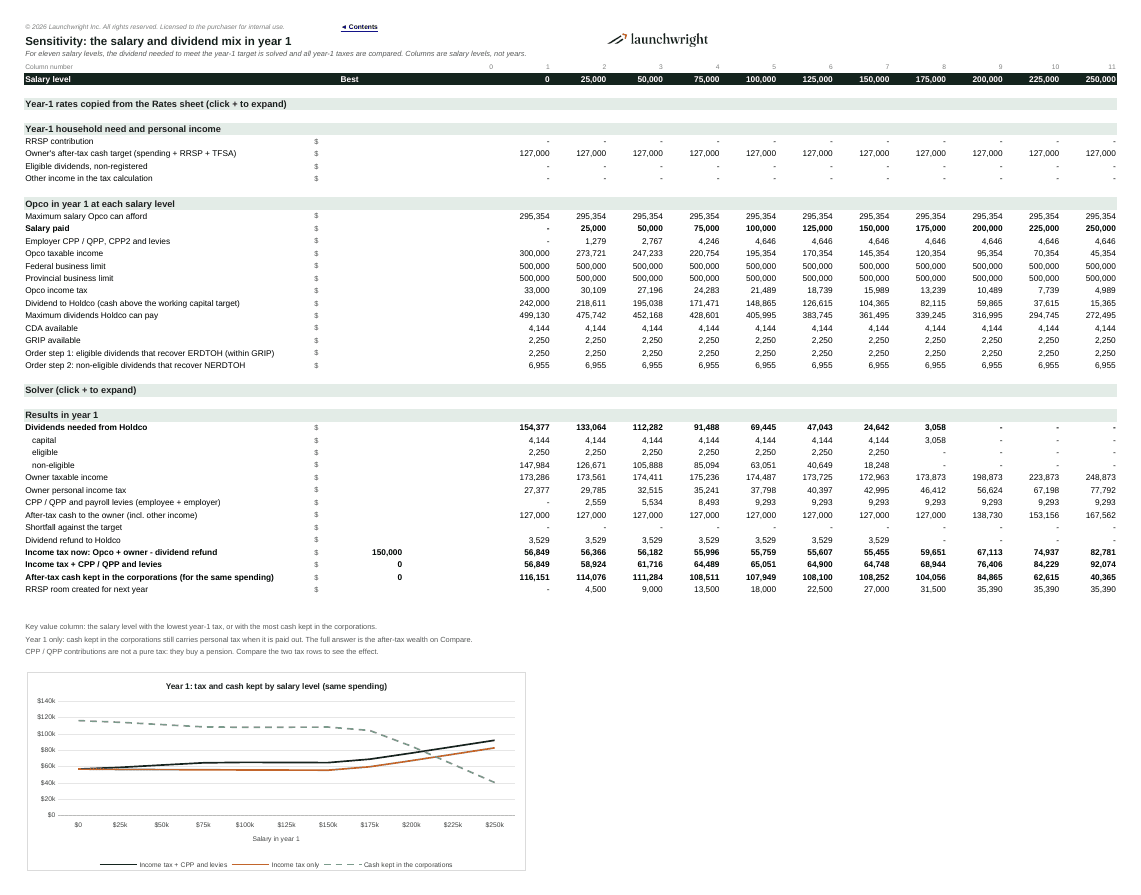
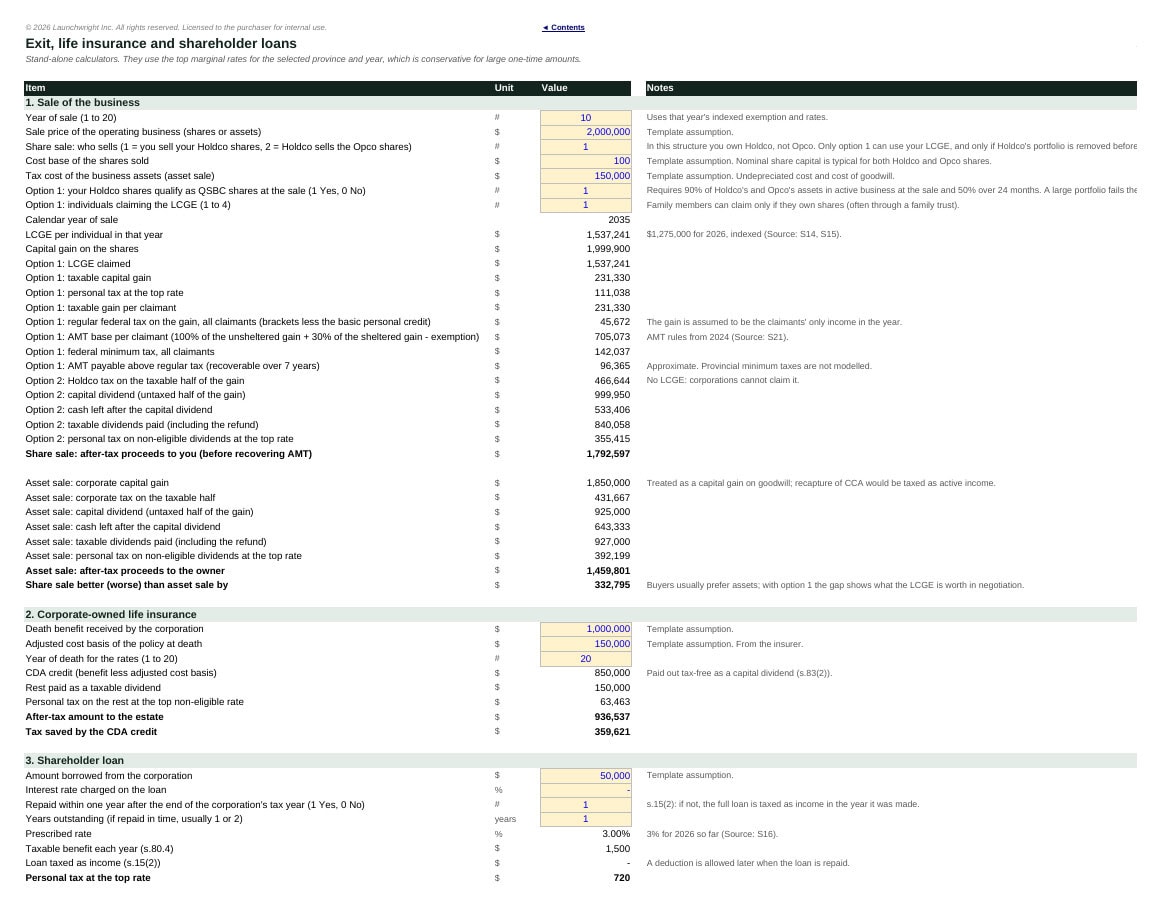
- Due Diligence Edition: family shareholders with a TOSI screen, a year-1 test of eleven salary levels, a share sale with the lifetime capital gains exemption and AMT compared with an asset sale (you selling Holdco shares, or Holdco selling Opco), the CDA credit from corporate-owned life insurance, and shareholder loan rules (s.15(2) and s.80.4)
Built to modeling best practice
- Inputs, calculations and outputs on separate, colour-coded sheets; inputs blue on yellow, formulas black, links green
- No macros, no circular references, no iterative calculation, no protected cells, no external links; the solver is visible bisection rows
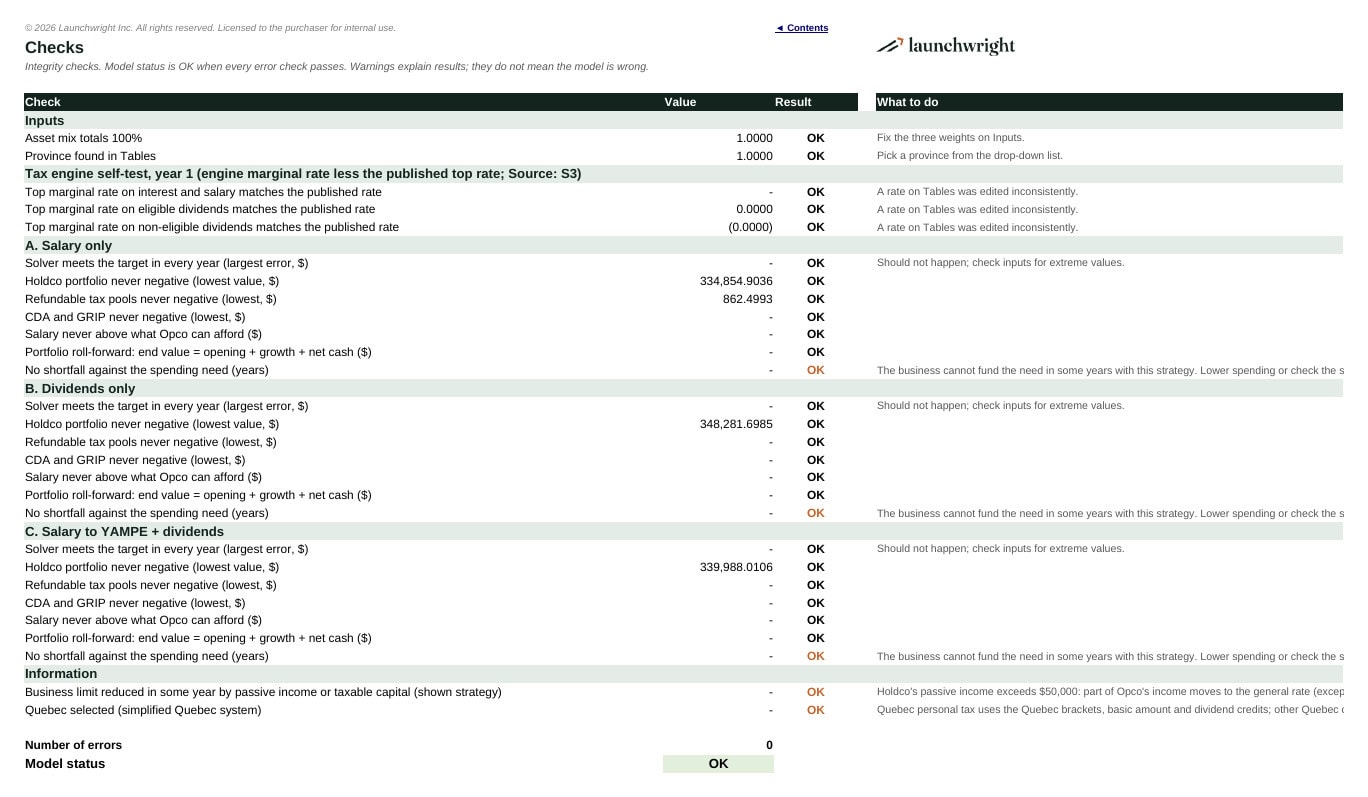
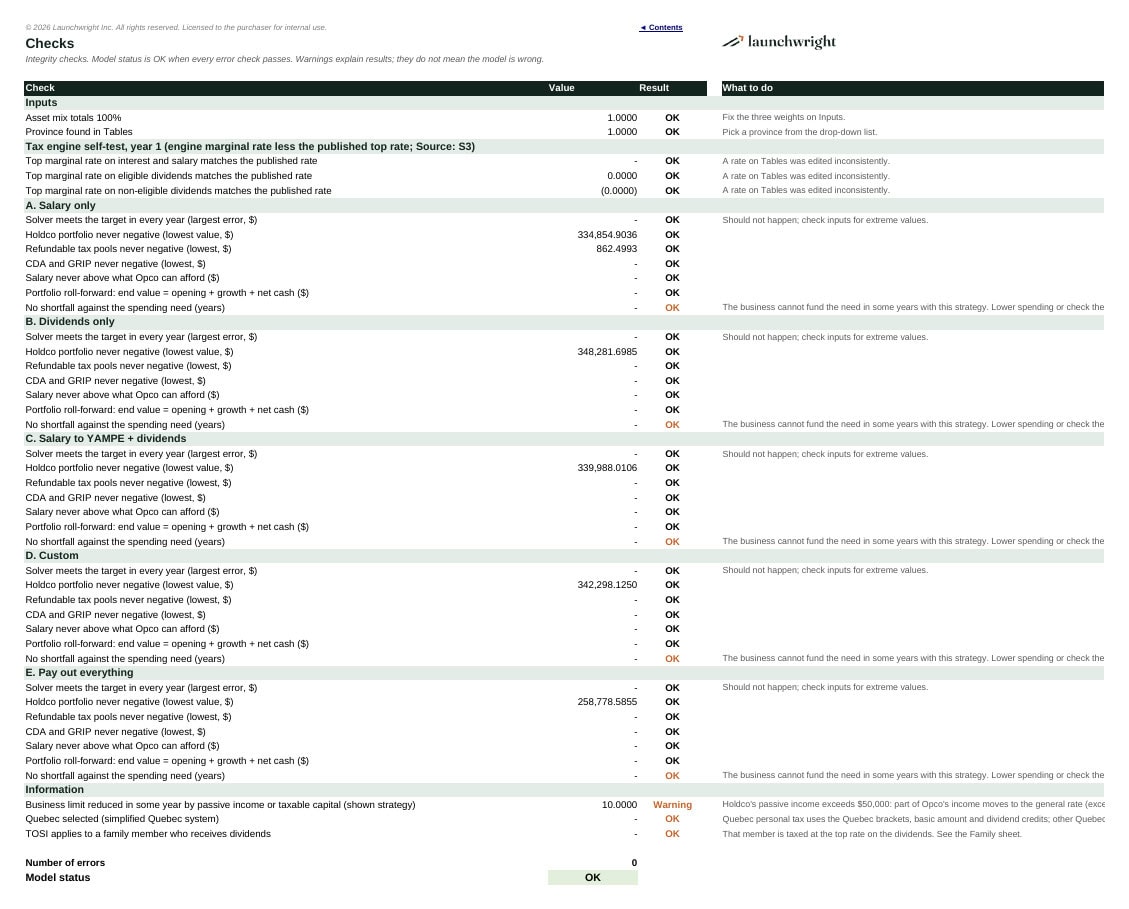
- A Checks sheet tests the tax engine’s marginal rates against the top combined rates (which match published 2026 tables), the solver, every tax pool and the portfolio roll-forward
- Every rate is on an editable Tables sheet and cited on a Sources sheet, so you can update it after each budget
Default case
An Alberta owner-manager whose Opco earns $300,000 before pay and keeps $25,000 of working capital, with a $250,000 Holdco portfolio and a $120,000 after-tax spending need. On these defaults salary only and dividends only finish within 0.2% of each other after 20 years (Due Diligence Edition), and the result changes by province, portfolio size and horizon, which is exactly why a year-by-year model beats a one-year calculator. Rates are 2026 published rates; returns follow FP Canada’s 2026 Projection Assumption Guidelines. Replace every default with your own figures.
What you get
- One Excel workbook (.xlsx) for the edition purchased, using only classic Excel functions (no dynamic arrays, no macros)
- A free PDF demo showing the main sheets of the Due Diligence Edition
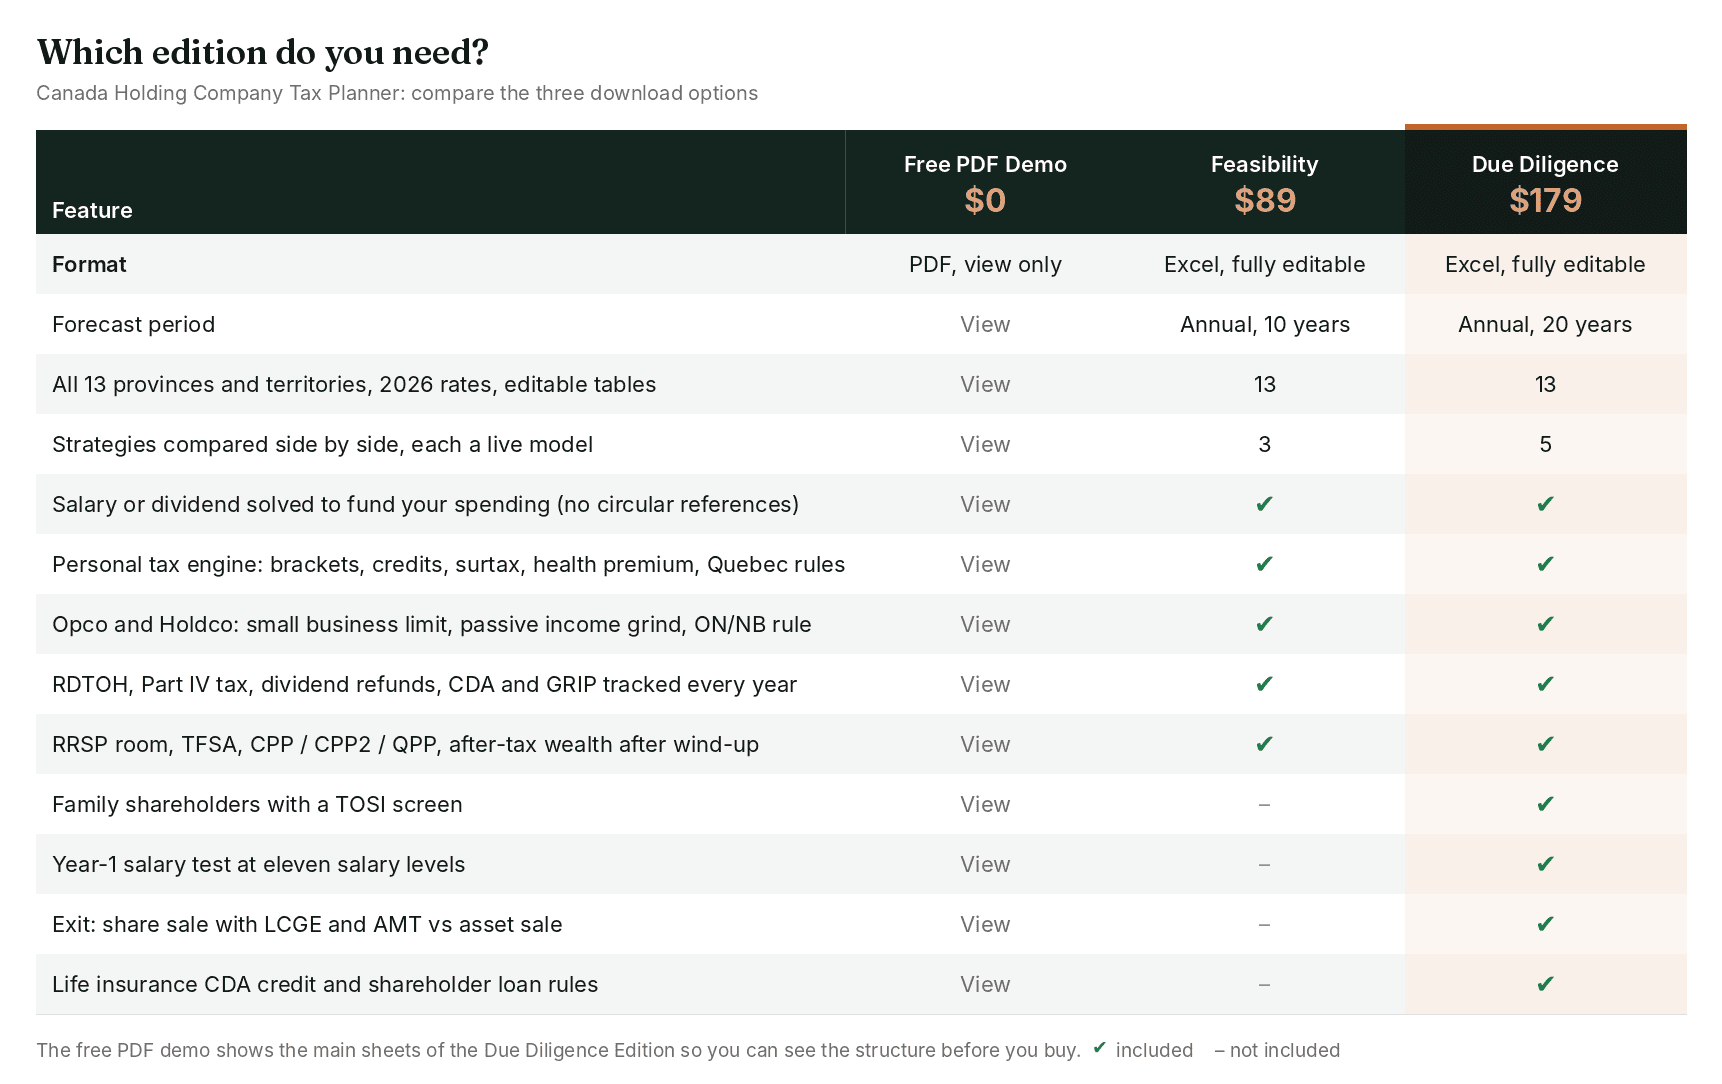
Compare the editions
The free PDF demo, the Feasibility Edition ($89) and the Due Diligence Edition ($179) side by side:
Support
Questions about how the template works are answered by email at the address inside the model. If you need the model adapted, please use the eFinancialModels custom service.
Important
This template is for planning and illustration. It is not tax, legal, accounting or investment advice. Rates change with every budget; have your plan reviewed by a qualified tax adviser before acting.
Frequently asked questions
Does it really find the salary or dividend for me without macros?
Yes. Each strategy sheet has a grouped block of solver rows that narrows the answer by bisection and finishes with a final interpolation step. It recalculates instantly, needs no Solver or Goal Seek, and creates no circular references. The Checks sheet confirms the target is met in every year.
Which provinces are covered?
All ten provinces and three territories, with 2026 personal and corporate rates. Change the province on Inputs. The rates sit on the Tables sheet so you can update them when budgets change.
Why does salary sometimes beat dividends?
It depends on your province and horizon. Salary creates RRSP room and CPP, passive income kept in a corporation is taxed more heavily in some provinces once paid out, and a large Holdco portfolio can trigger the passive income grind. The model shows which effect wins for your numbers.
Does a holding company avoid the passive income grind?
No. Opco and Holdco are associated, so Holdco’s investment income reduces Opco’s small business limit. The model applies this every year, except at the provincial level in Ontario and New Brunswick, which did not adopt the grind.
Is CPP counted in the wealth figure?
No. CPP and QPP contributions are shown separately because they buy a pension rather than build savings. Salary-based strategies are therefore understated, and the Dashboard says so.
Can I include my spouse or adult children?
Yes, in the Due Diligence Edition. Up to three family shareholders can receive dividends; a TOSI screen applies the top rate when no exclusion is met, and their net dividends reduce what the owner has to draw.
Which Excel versions does it work in?
Excel 2010 or later on Windows or Mac. It uses classic functions only and has been fully recalculated and tested. Google Sheets has not been tested.
Does it account for CPP and EI?
CPP or QPP and CPP2 are calculated on salary for both the owner and the corporation. EI is not charged, because an owner who controls more than 40% of the voting shares, directly or through a holding company, is not insurable. QPIP still applies in Quebec.
Is this tax advice?
No. It is a planning model built on published rates. Use it to prepare for a conversation with your accountant, not to replace one.
Similar ProductsOther customers were also interested in...



 eFinancialModels
Electric Vehicle (EV) Charging Station Financial M...
With this comprehensive 5- or 10-year monthly tool, investors can assess the viability of setting up... Read more

Financial Model for Mobile App | Mobile App Busine...
The Mobile App Financial Plan Template in Excel allows you to develop financial projections when lau... Read more

 HenrySheykin
Food Truck Financial Model Excel Template
The Food Truck Financial Model helps entrepreneurs, founders, business owners, consultants, and anal... Read more

Green Hydrogen Production from Wind Energy Financi...
The Green Hydrogen from Wind Financial Model aims to comprehensively forecast a horizon of 40 years ... Read more

Simple Mutual Non-Disclosure Agreement Template
Protect your business secrets with ease using our Simple Mutual Non-Disclosure Agreement Template. S... Read more

Solar Energy Financial Model
The Solar Energy Financial Model Spreadsheet Template in Excel assists you in preparing a sophistica... Read more
 Peter Graf
The Customer-Centric Financial Model for Restauran...
Starting a restaurant without a financial plan is like driving a car blindfolded. You wouldn´t do i... Read more
You must log in to submit a review.