
0 ITEMS

Used-Oil Re-Refining Plant Financial Model: 7 Technologies, Group II and Group III Base Oil, Clay, Solvent, Fuel and RFO Routes, Project Finance
Annual Excel model for a used lubricating oil re-refinery. Compare seven technologies from Group II/III base oil to recycled fuel oil, model used oil collection and stewardship incentives, size debt to a target DSCR and get IRR, NPV and three linked statements.
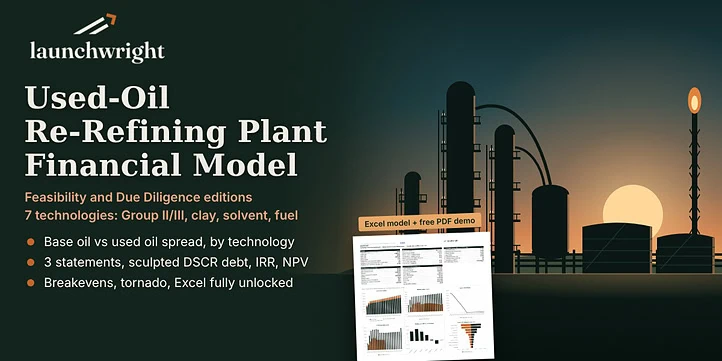
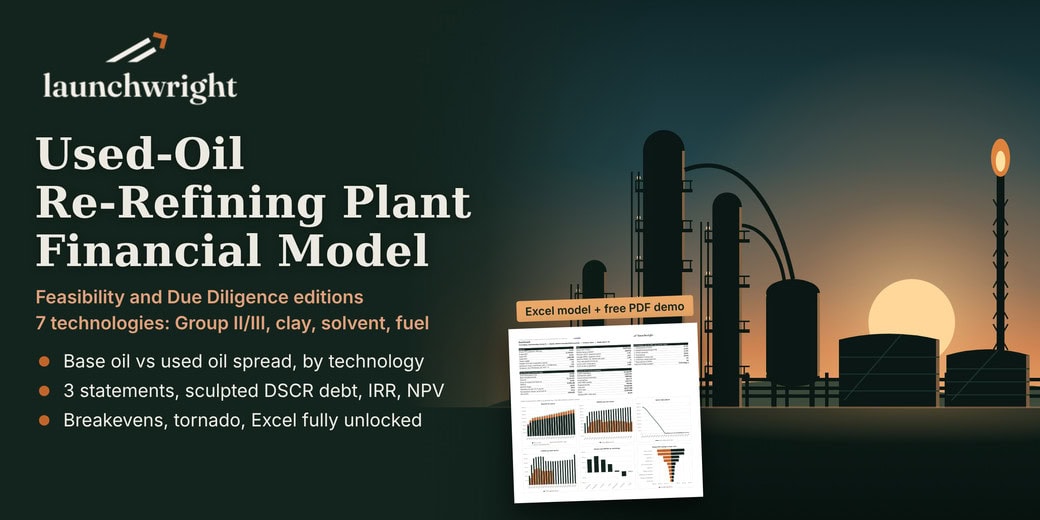
Planning a used oil re-refinery, or assessing one for investors or lenders? This Excel model turns your plant assumptions into a full financial case, and it is built around the question that decides every re-refinery: the spread between what you sell base oil for and what you pay to collect or buy used oil.
Why this model
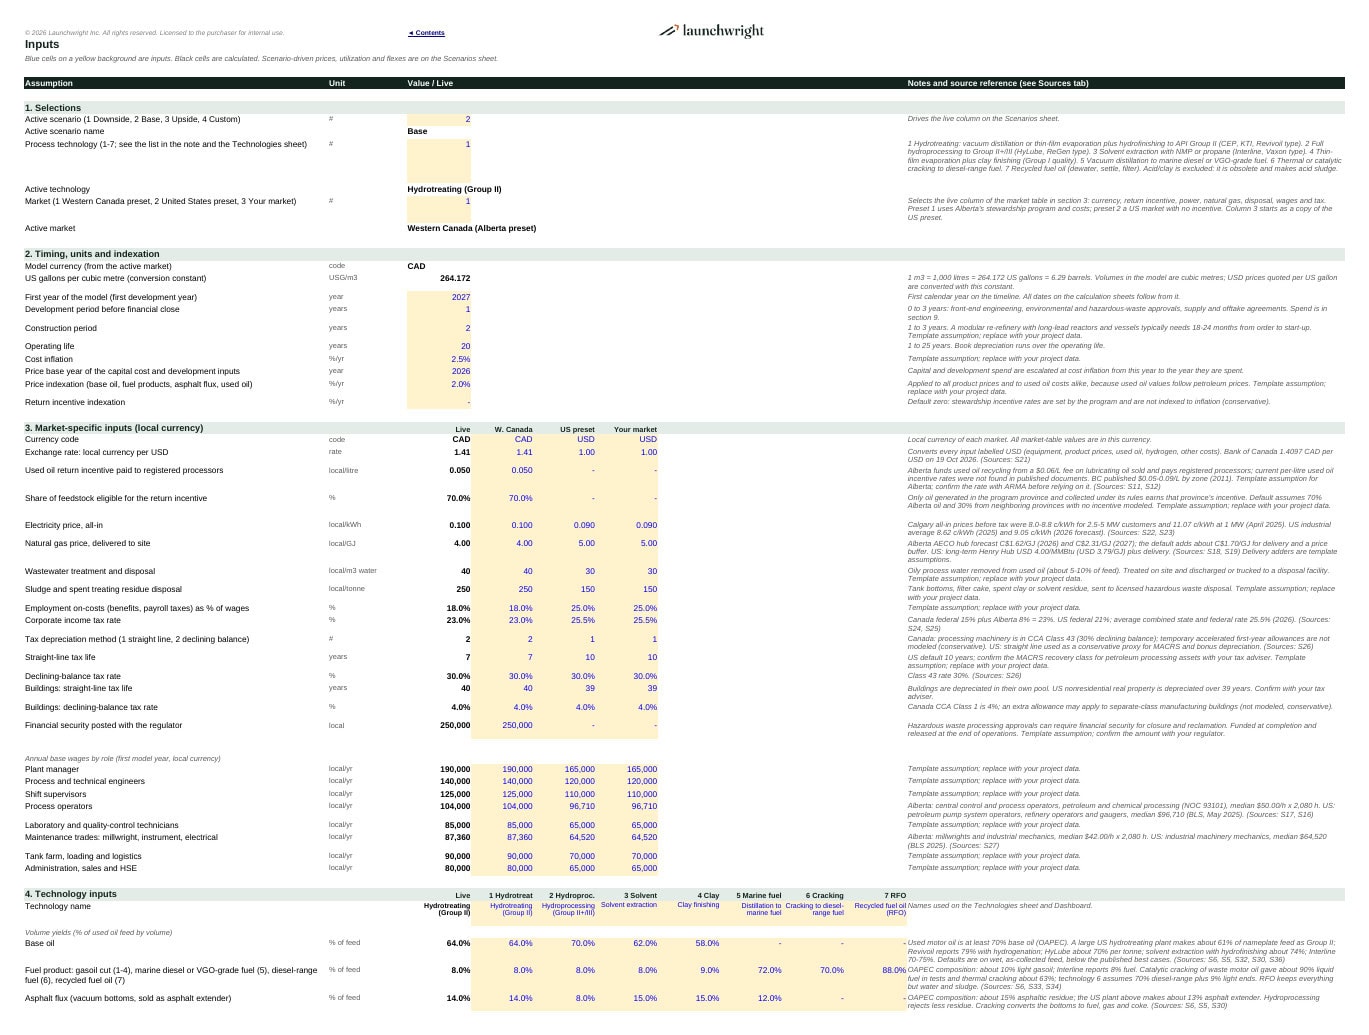
Used oil can be turned into very different businesses, and the right choice depends on your feedstock, market and budget. This model compares seven commercially used technologies side by side at the same plant size, each with its own yields, product prices, hydrogen, catalyst, energy, staffing and itemized capital cost:
- Hydrotreating to API Group II (vacuum distillation or thin-film evaporation plus hydrofinishing)
- Full hydroprocessing to Group II+/III (the HyLube-type route)
- Solvent extraction with NMP or propane
- Thin-film evaporation with clay finishing
- Vacuum distillation to marine diesel or VGO-grade fuel
- Thermal or catalytic cracking to diesel-range fuel
- Recycled fuel oil: dewatering, settling and filtration
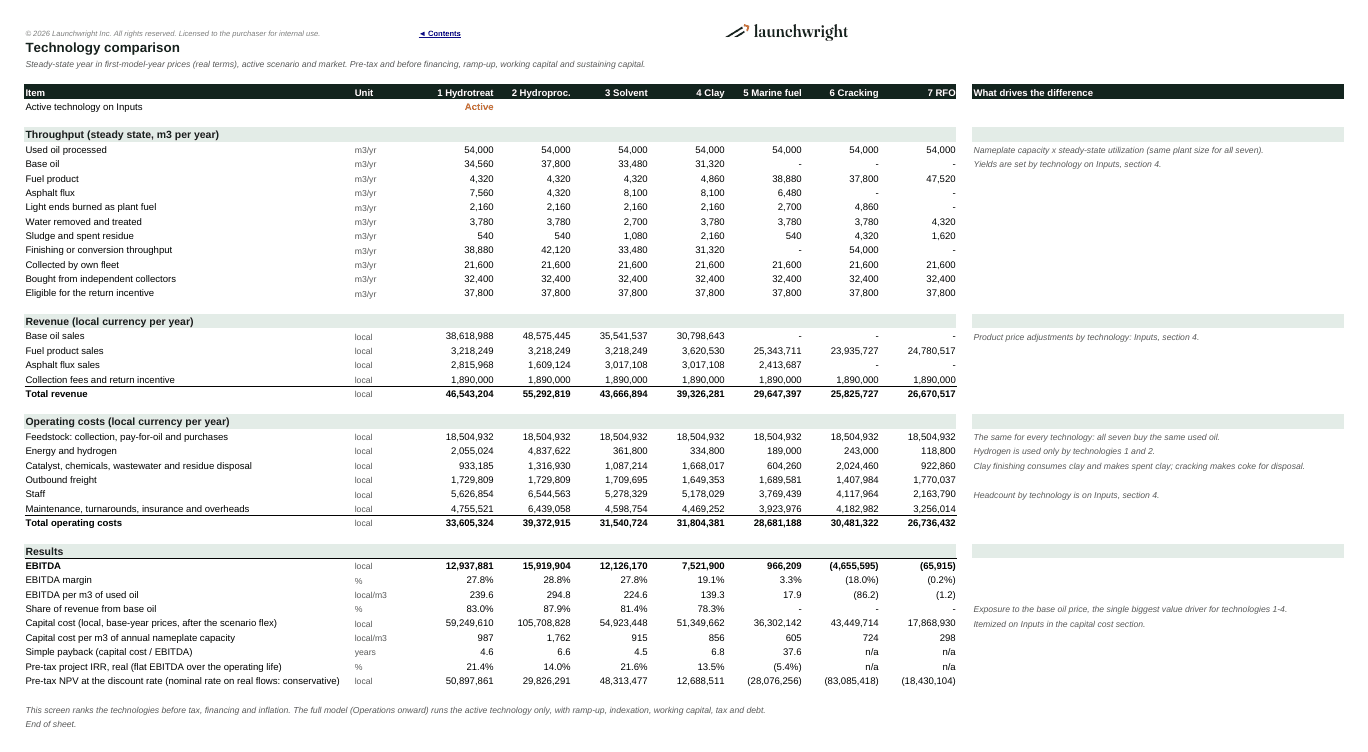
The Technologies sheet ranks all seven on revenue, operating cost, EBITDA, capital cost per m3 and pre-tax return. The technology you select then runs through a full annual model with ramp-up, indexation, working capital, tax and debt.
Feedstock comes from your own collection fleet, where you pay generators for their oil or charge them to remove it, and from independent collectors at a delivered price. Revenue covers base oil, fuel products, asphalt flux, collection fees and stewardship return incentives. The model works in any market: a Western Canada preset built on Alberta’s used oil stewardship program (CAD), a United States preset (USD) and a third column for your own market, each with its own currency, incentive, energy prices, disposal costs, wages and tax rules.
How it compares with other listings
- Most oil models on the marketplace are crude oil refineries, which buy crude and sell fuels. A re-refinery’s economics are the spread between base oil and used oil, which this model is built around.
- Generic recycling business plans do not model process technology. This model has seven, with volume balances that close every year.
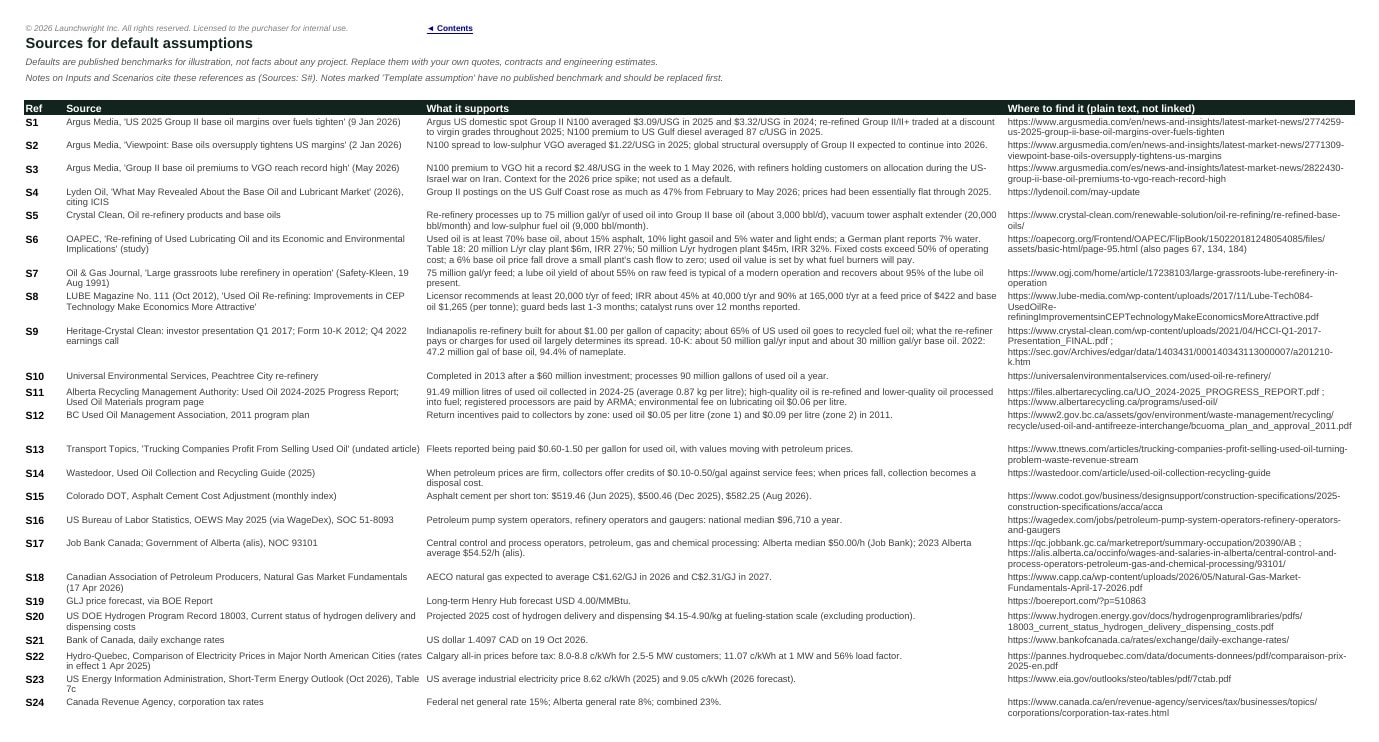
- Defaults are cited to 36 public sources, including 2025 US base oil price data, built re-refinery costs and Alberta’s used oil program, and the Sources sheet lists them all.
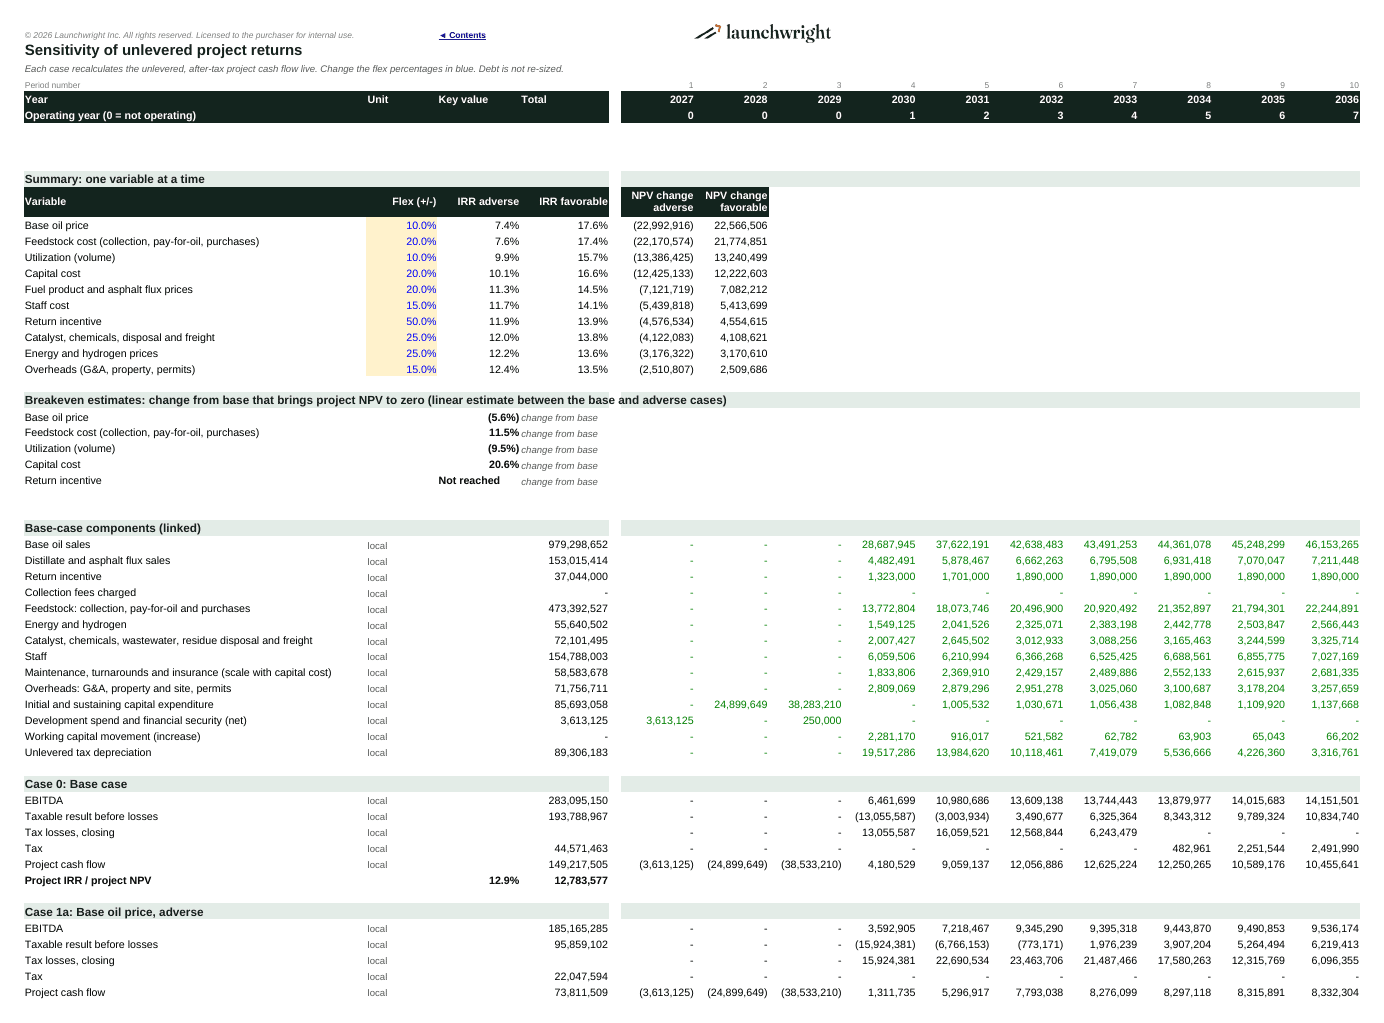
- It reports what lenders and investors ask first: the base oil price at which project NPV is zero, and how much feedstock costs can rise before value is lost (Due Diligence Edition).
Two editions
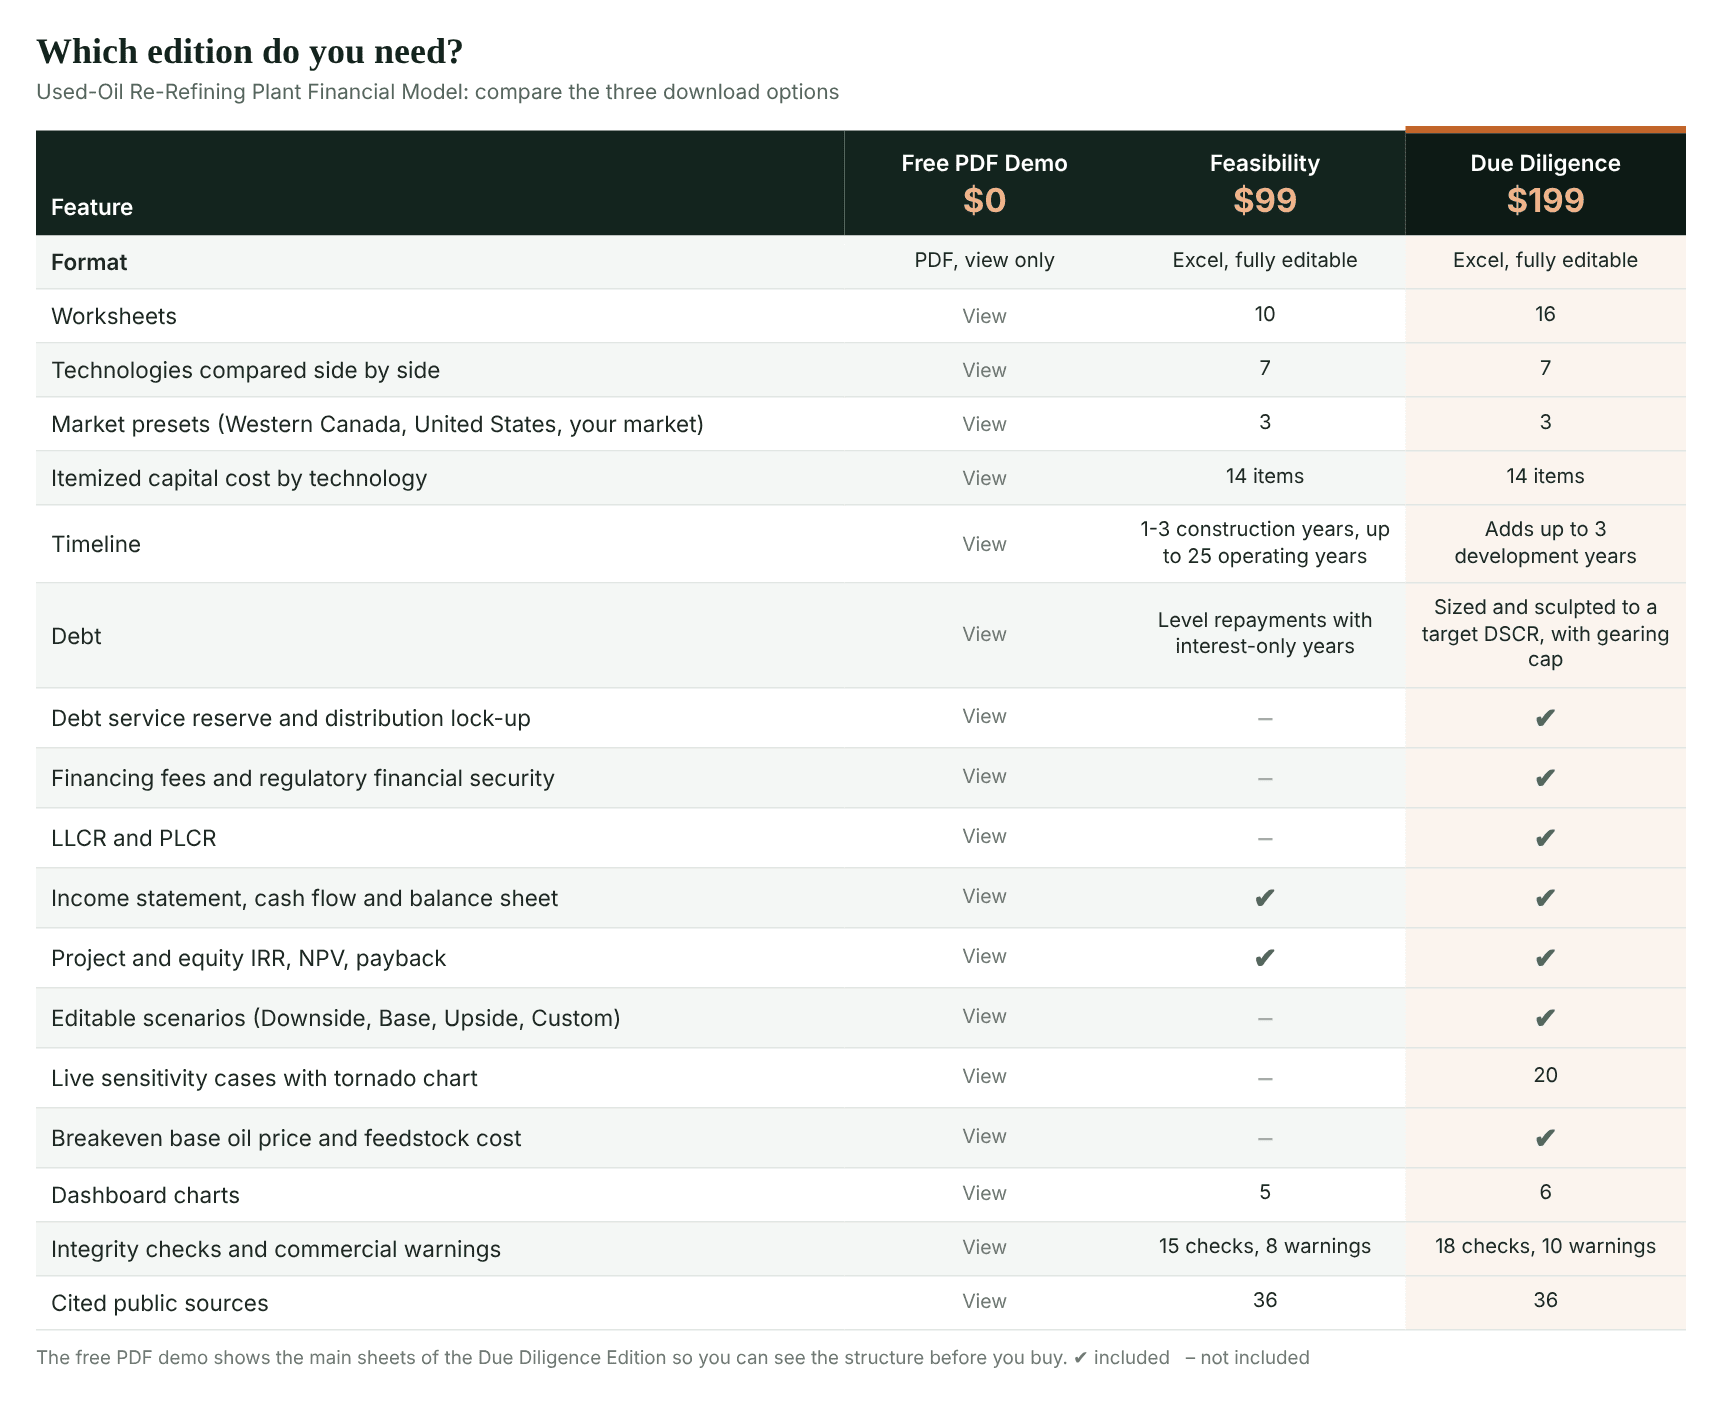
- Feasibility Edition: a fast, clear annual model for early screening. It covers the seven technologies, three market columns, own and third-party feedstock, a 14-item capital cost build, staffing by role, working capital with inventory, debt with interest-only years and level repayments, tax depreciation, three linked statements, returns and a dashboard.
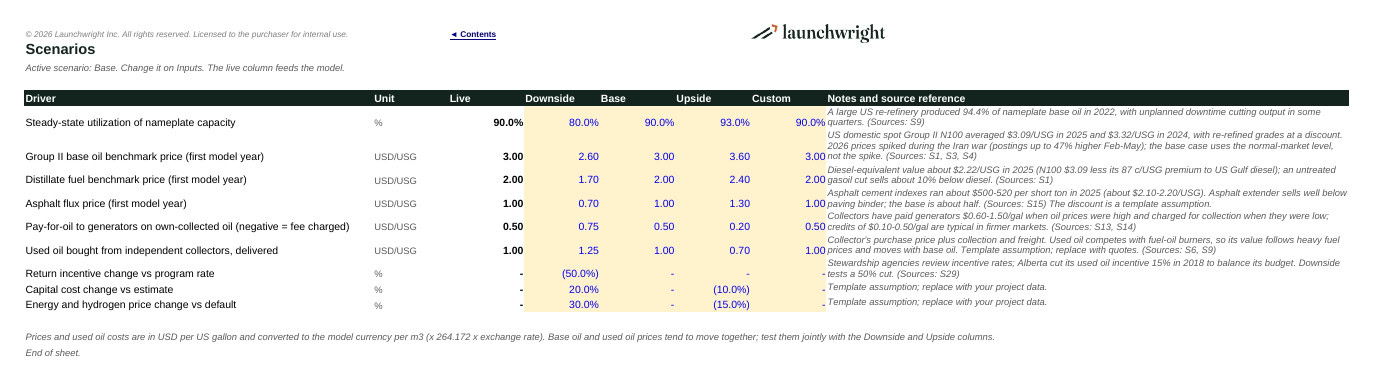
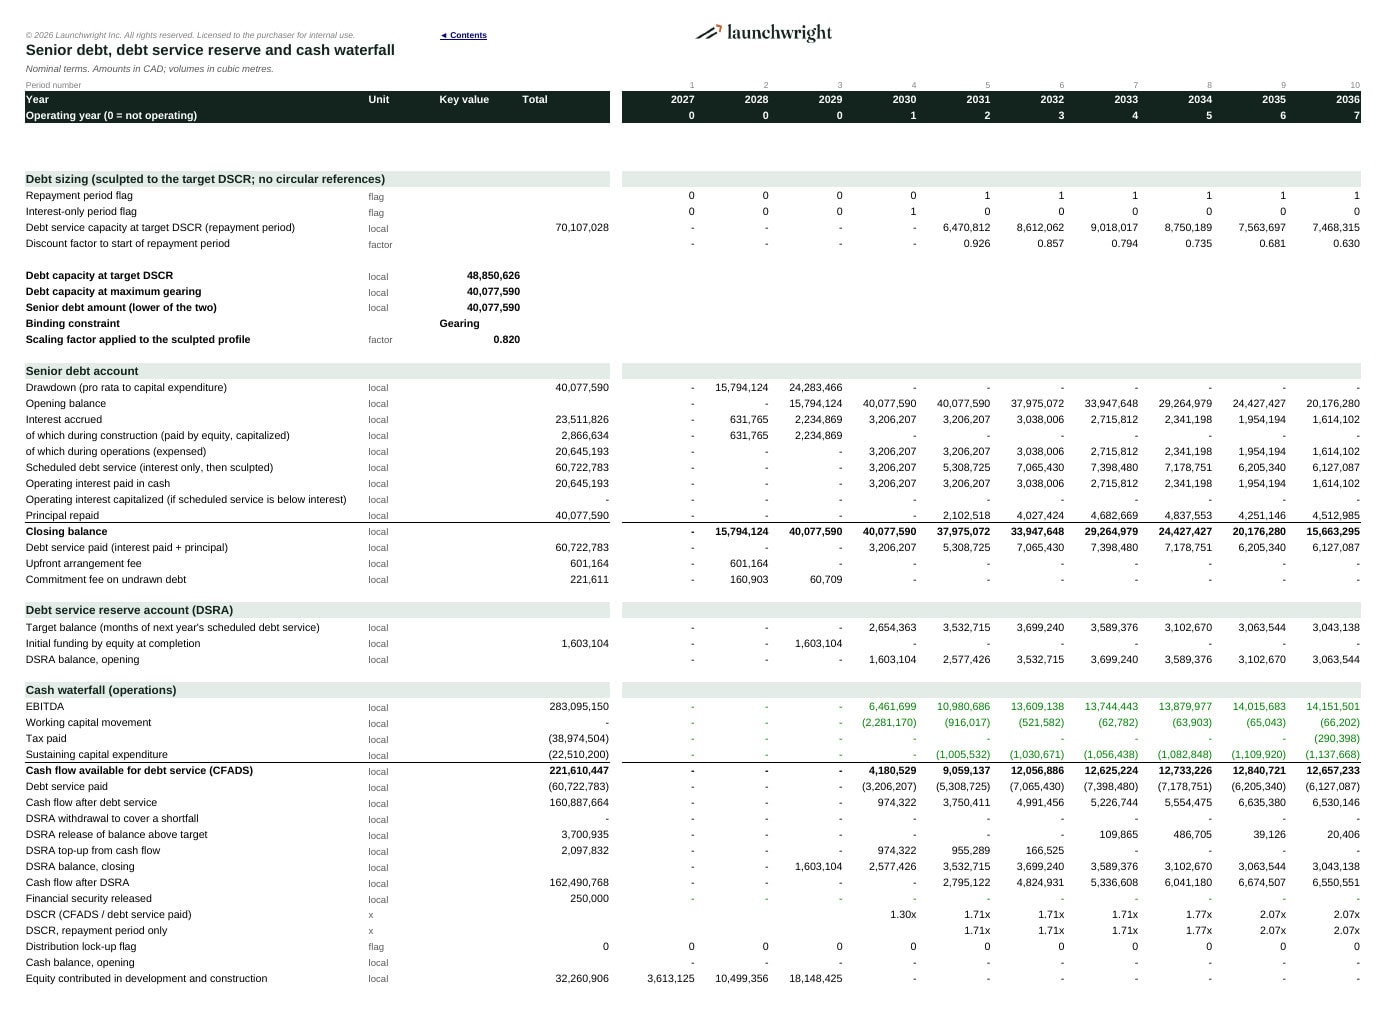
- Due Diligence Edition: everything in the Feasibility Edition, plus a development period with development spend, debt sized and sculpted to a target DSCR with no circular references, a debt service reserve account and distribution lock-up, regulatory financial security, LLCR and PLCR, four editable scenarios, and 20 live sensitivity cases with breakeven estimates and a tornado chart.
Key outputs
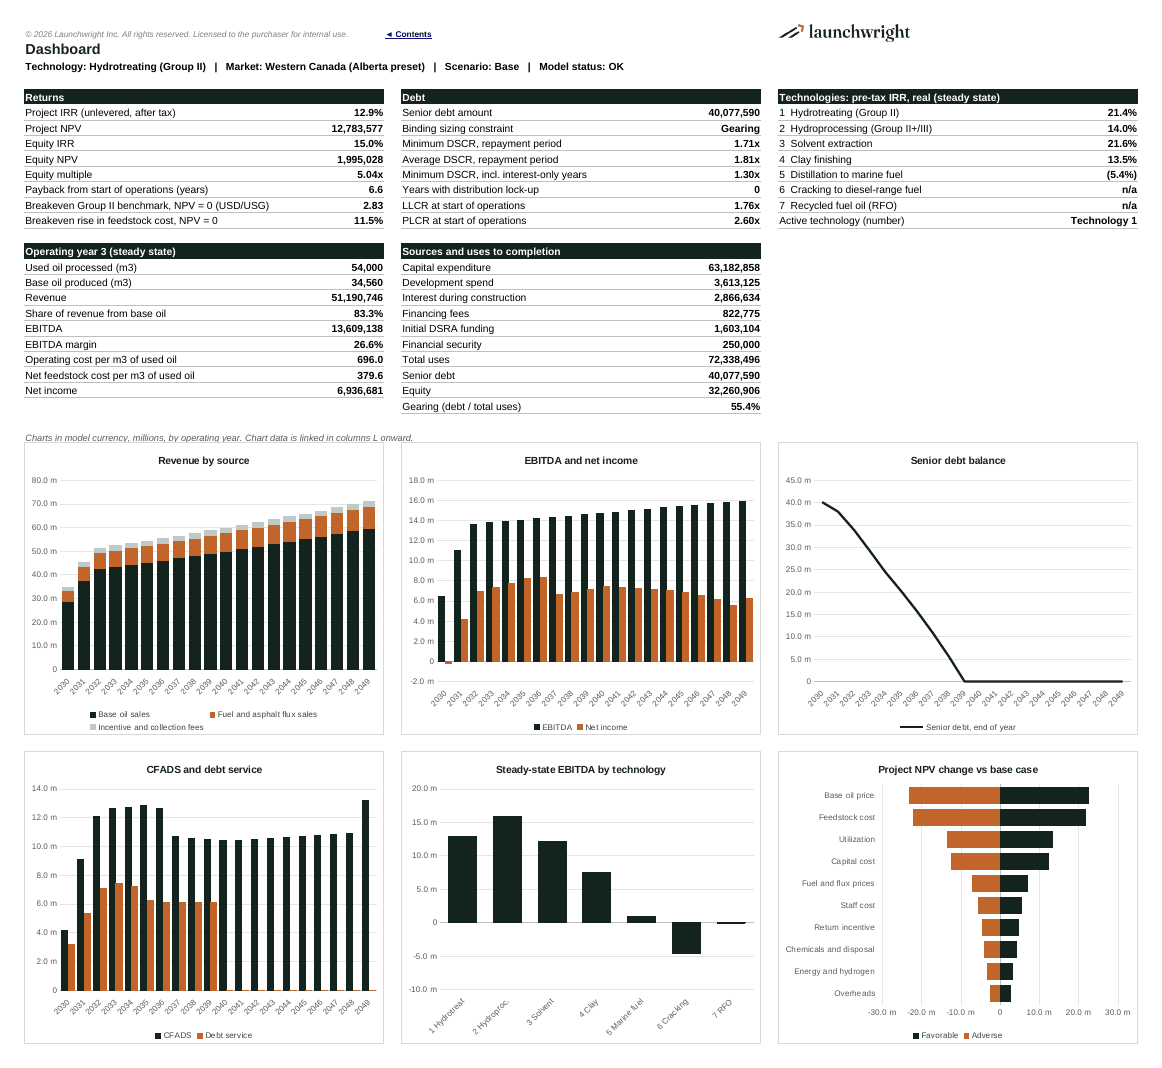
- Project IRR (unlevered, after tax), equity IRR, NPV, equity multiple and payback
- Senior debt amount and DSCR; binding sizing constraint, LLCR and PLCR in the Due Diligence Edition
- Steady-state comparison of the seven technologies: revenue, operating cost, EBITDA, capital cost per m3 and pre-tax IRR
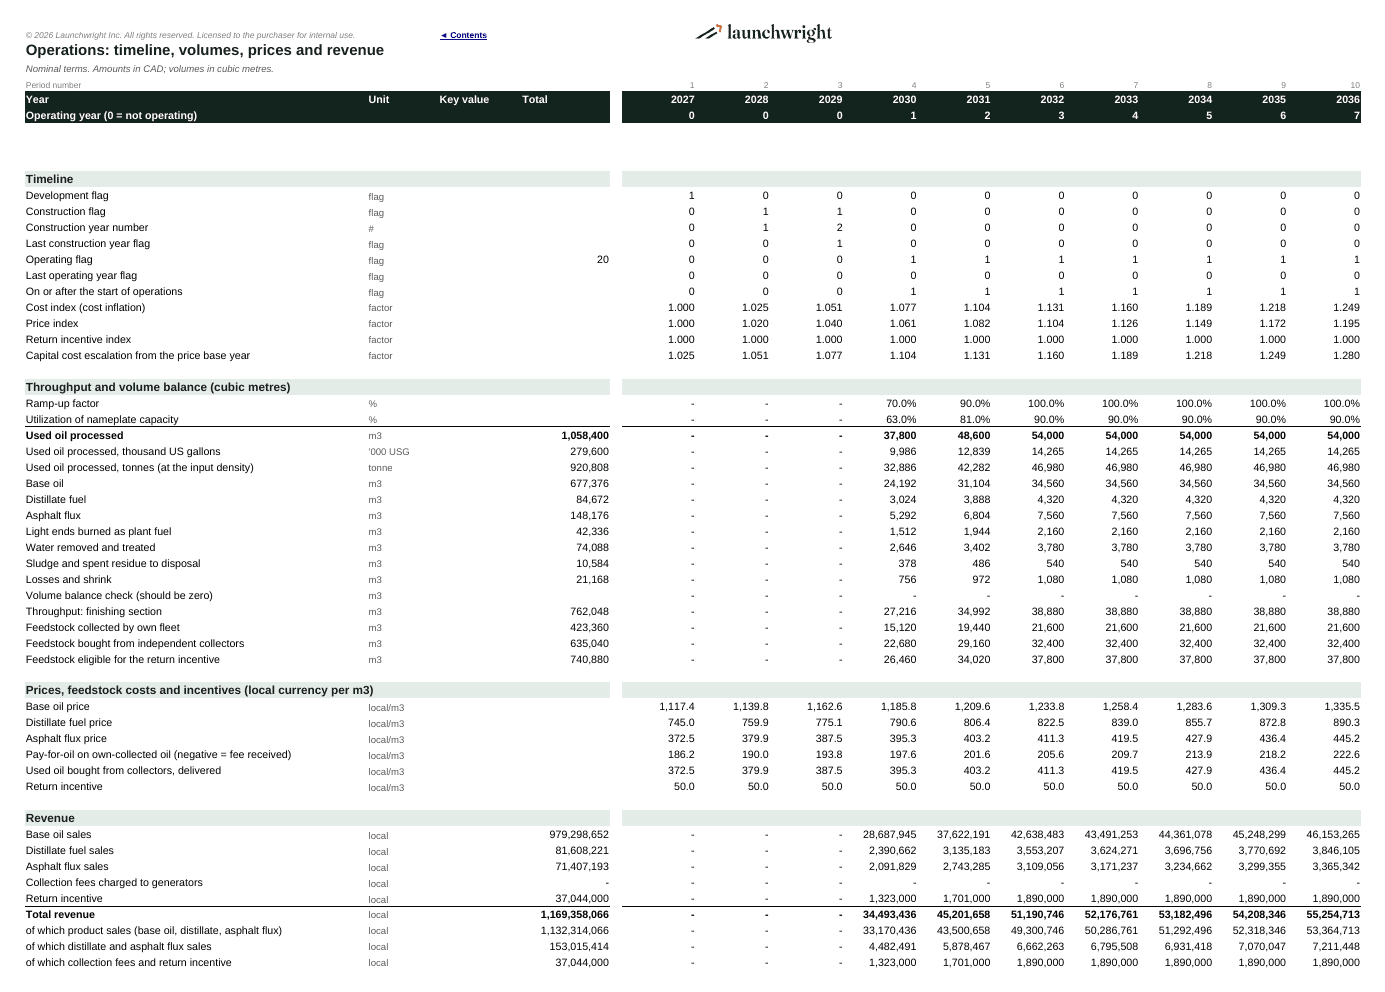
- Volume balance every year: base oil, distillate, asphalt flux, light ends, water, residue and losses
- Net feedstock cost and operating cost per m3 of used oil
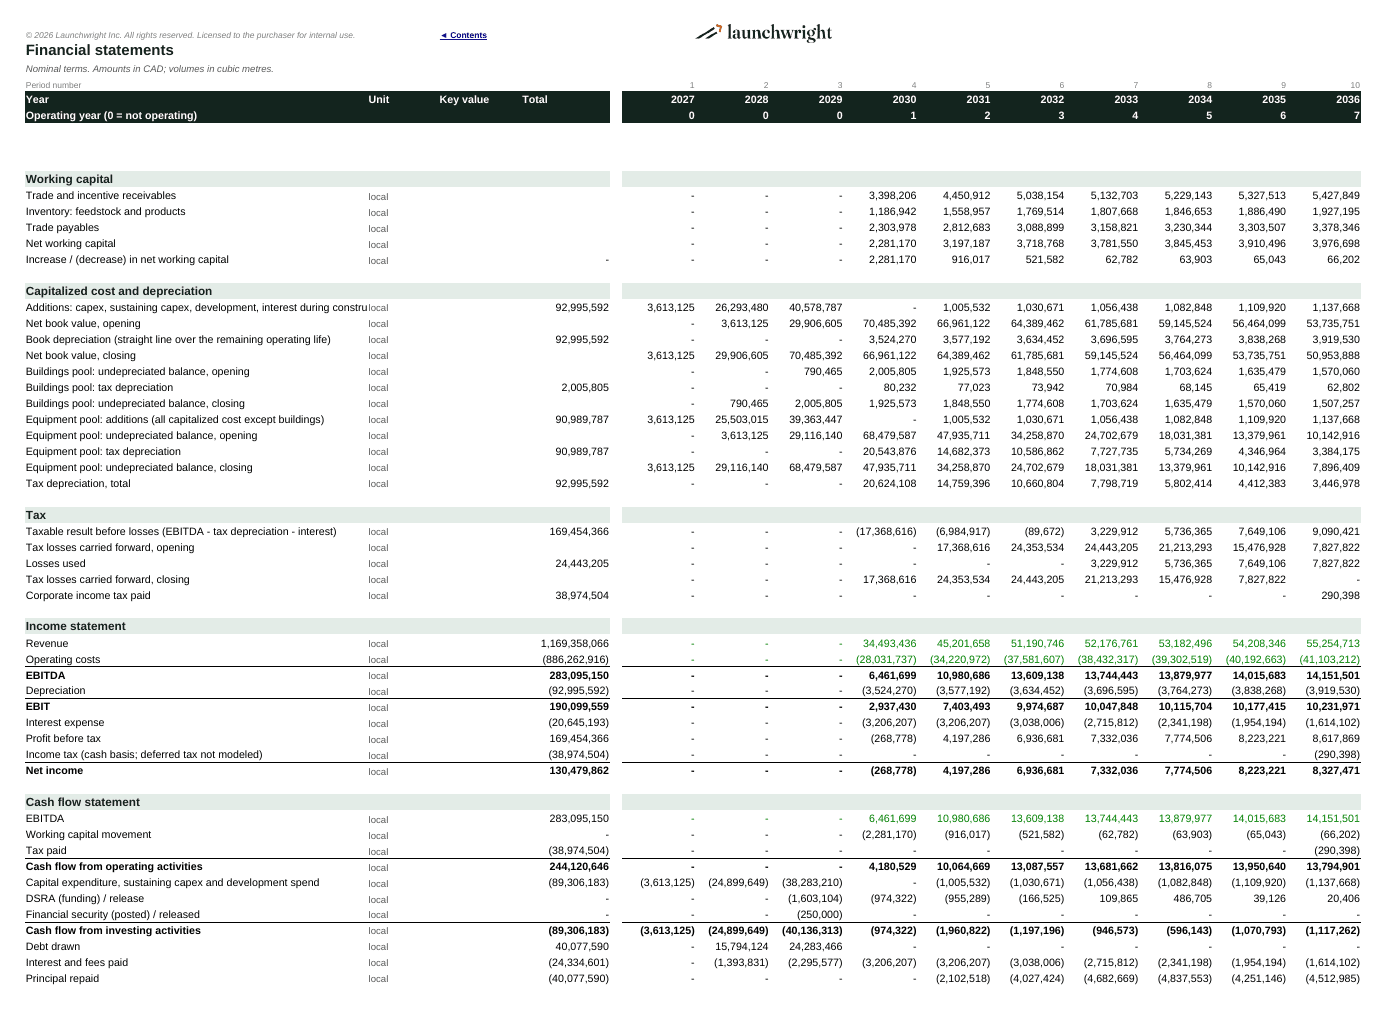
- Income statement, cash flow statement and balance sheet for every year, with a balance check
- Dashboard with revenue by source, EBITDA and net income, CFADS against debt service, debt balance, technology comparison and NPV tornado charts, plus breakeven base oil price and feedstock cost
Built to modeling best practice
- Inputs, calculations and outputs on separate sheets; inputs in blue on yellow, formulas in black
- Consistent formulas across every year; start year, inflation and capital cost base year are inputs
- Capital cost itemized in 14 installed-cost lines by technology and scaled to plant capacity, plus EPCM, owner’s costs and contingency; sustaining capital over the life
- Tax depreciation in two pools (buildings and equipment), straight line or declining balance, with losses carried forward
- No macros, no circular references, no hidden or protected sheets, no external links
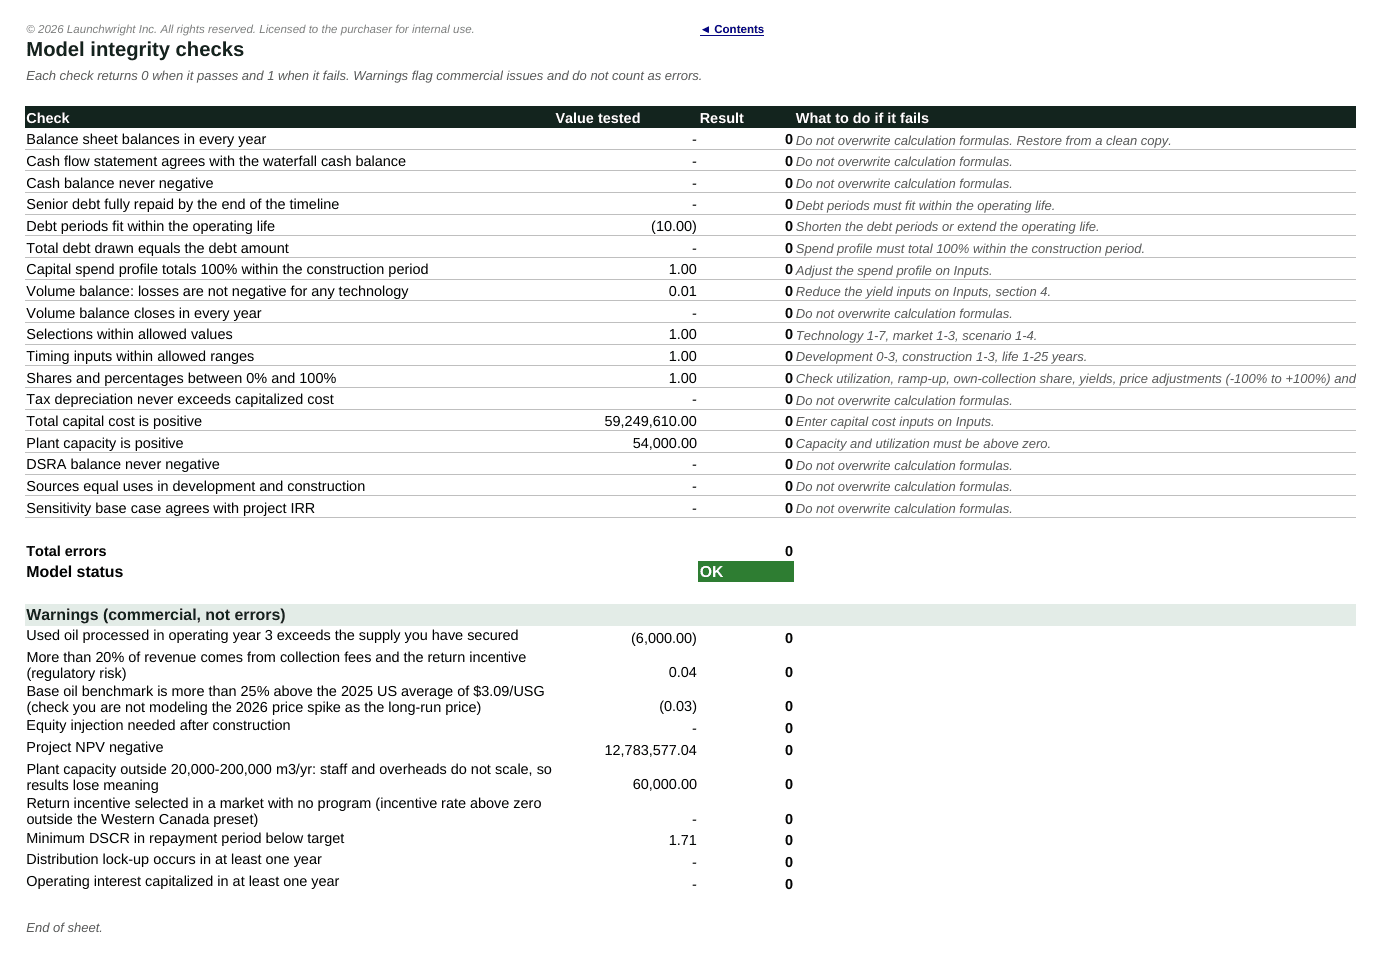
- Checks sheet confirms the balance sheet balances, cash never goes negative, debt is repaid, the volume balance closes and selections are valid; warnings flag commercial risks, including a base oil price set above normal-market levels
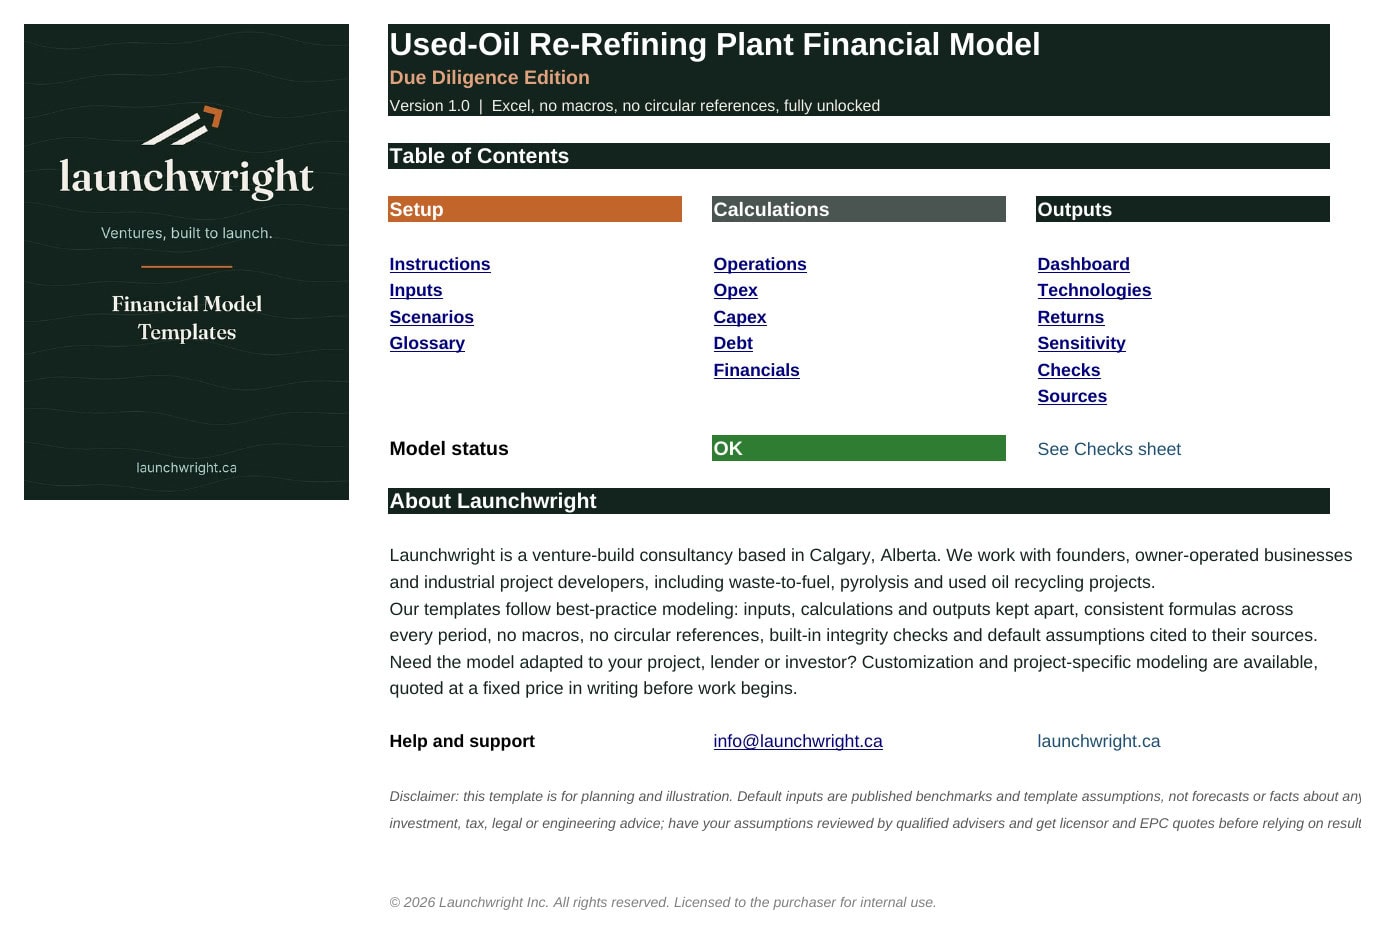
- Contents sheet with links, step-by-step instructions, a glossary and a source list of 36 references
Timeline
Annual periods. Up to 3 development years (Due Diligence Edition), 1 to 3 construction years and up to 25 operating years, with a ramp-up over the first two operating years. Product prices and used oil costs, operating and capital costs, and stewardship incentives escalate at separate rates.
Default assumptions
Defaults describe a 60,000 m3 a year (about 15.9 million US gallons) hydrotreating re-refinery in Alberta running at 90% utilization. Base oil yield is 64% of feed. Group II base oil is priced at $3.00 per US gallon, near the 2025 US average, not the 2026 price spike. Total capital cost is about USD 42 million (CAD 59 million) in 2026 prices, checked against published costs of built North American re-refineries. Prices, wages, energy, tax rates and yields are cited to public sources on the Sources sheet. Replace every default with your own quotes and contracts.
What you get
- One Excel workbook (.xlsx) for the edition purchased, built only with functions available since Excel 2010 (no dynamic arrays, no macros)
- A free PDF demo showing the main sheets of the Due Diligence Edition
- Built for Microsoft Excel on Windows or Mac. The charts by year resize to the operating life using named ranges, which Google Sheets, Apple Numbers and LibreOffice do not support in charts.
Compare the editions
The free PDF demo, the Feasibility Edition ($99) and the Due Diligence Edition ($199) side by side:
Support and customization
Questions about how the template works are answered by email us via the Contact Author button or through customer support chat.. Adapting the model to your project, region, lender or investor requirements is available as a custom service ordered through eFinancialModels.
Similar ProductsOther customers were also interested in...



 eFinancialModels
Electric Vehicle (EV) Charging Station Financial M...
With this comprehensive 5- or 10-year monthly tool, investors can assess the viability of setting up... Read more

Financial Model for Mobile App | Mobile App Busine...
The Mobile App Financial Plan Template in Excel allows you to develop financial projections when lau... Read more

 HenrySheykin
Food Truck Financial Model Excel Template
The Food Truck Financial Model helps entrepreneurs, founders, business owners, consultants, and anal... Read more

Green Hydrogen Production from Wind Energy Financi...
The Green Hydrogen from Wind Financial Model aims to comprehensively forecast a horizon of 40 years ... Read more

Simple Mutual Non-Disclosure Agreement Template
Protect your business secrets with ease using our Simple Mutual Non-Disclosure Agreement Template. S... Read more

Solar Energy Financial Model
The Solar Energy Financial Model Spreadsheet Template in Excel assists you in preparing a sophistica... Read more

 Peter Graf
The Customer-Centric Financial Model for Restauran...
Starting a restaurant without a financial plan is like driving a car blindfolded. You wouldn´t do i... Read more
You must log in to submit a review.