
0 ITEMS

EV Charging Station Financial Model Excel – 15-Year Forecast, 15 Sites, Grid Capacity, Debt & IRR
A 15-year EV charging infrastructure Excel financial model linking 15 AC/DC charging locations, 225 site-year calculations, utilization, grid capacity, energy costs, installation CAPEX, equipment debt, three integrated financial statements, project NPV, project/equity IRR and three operating scenarios. Includes 14 worksheets, 8 native dashboard charts and a separate 25-page English PDF guide.
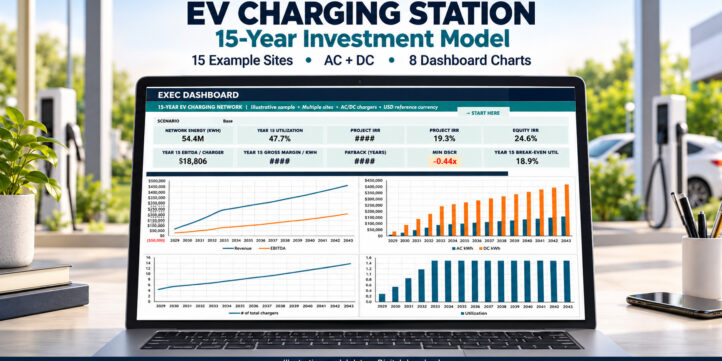


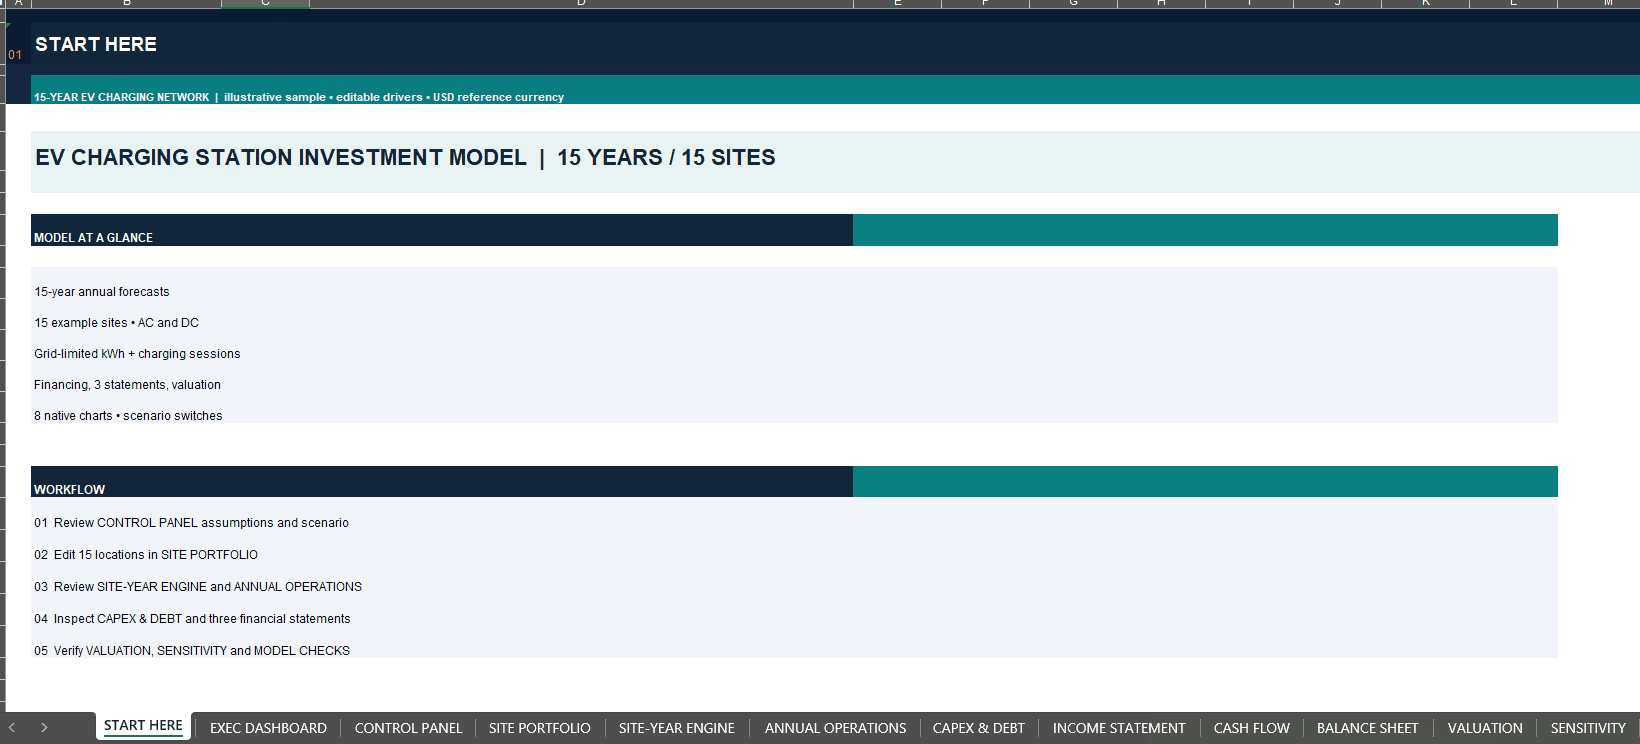
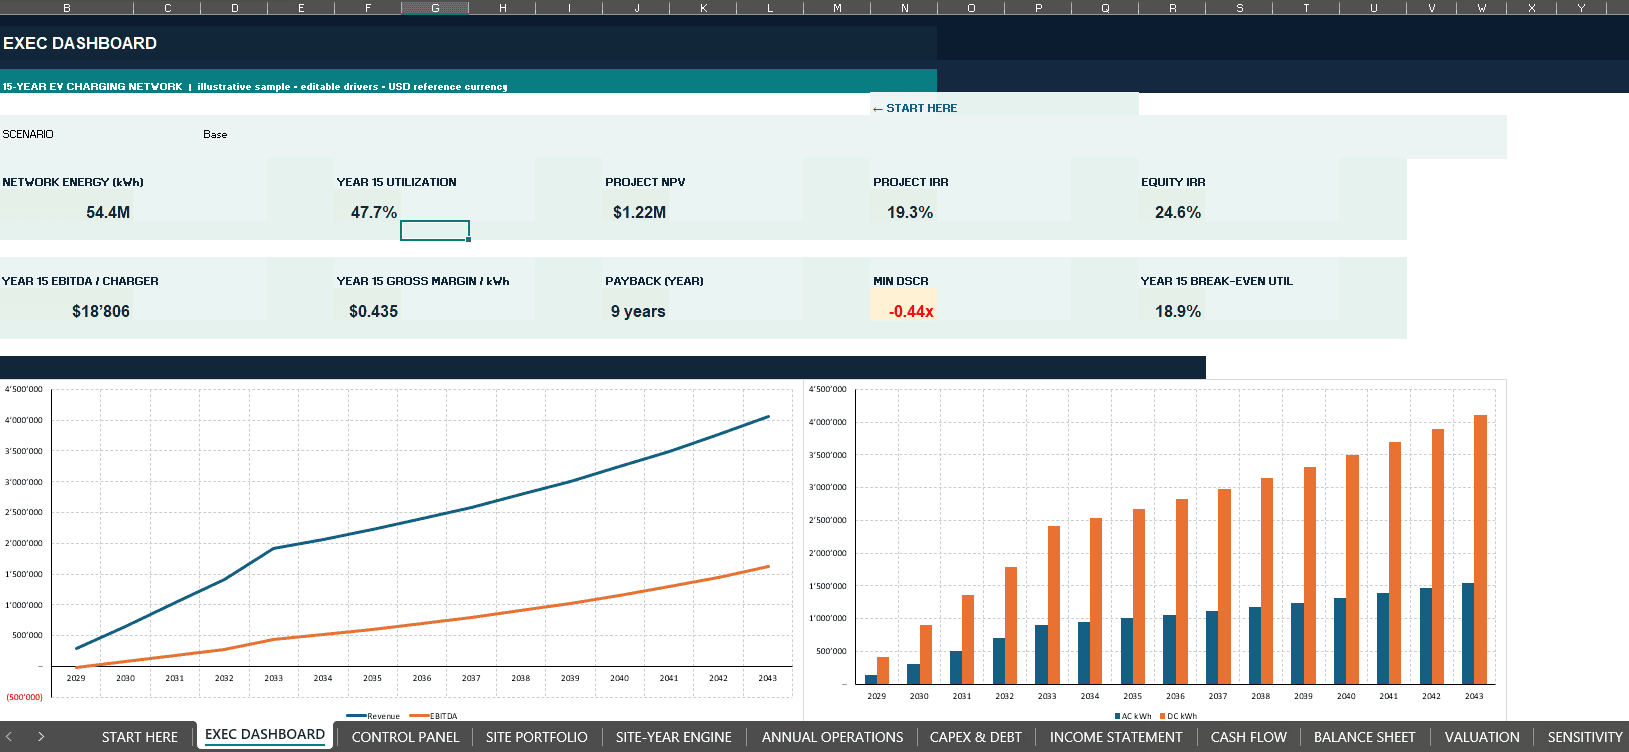
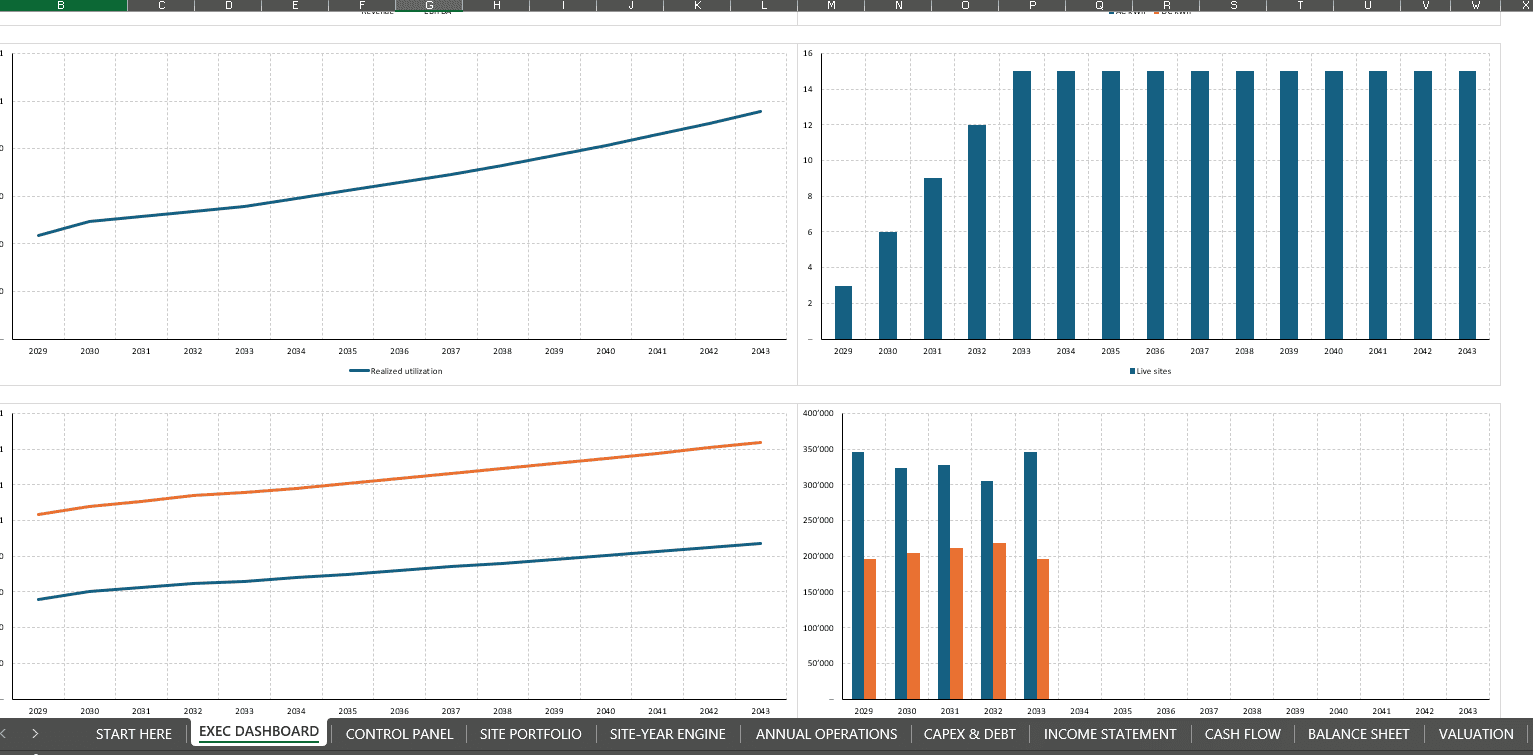


EV CHARGING STATION FINANCIAL MODEL – 15-YEAR SIGNATURE EDITION
From Site Rollout and Charging Demand to Electricity Costs, Project Financing and Investment Returns — One Connected Excel Financial Model.
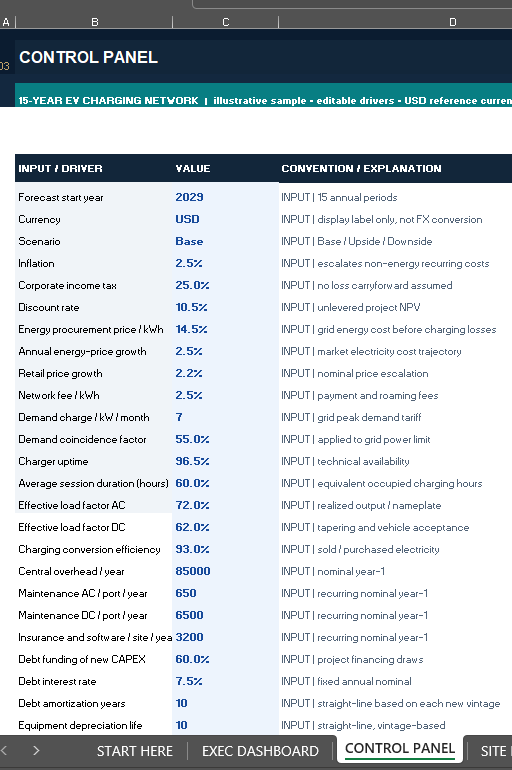
The EV Charging Station Financial Model by SheetworksStudio provides a comprehensive, fully editable Excel framework for evaluating the long-term financial economics of electric vehicle charging infrastructure.
Built around a 15-year integrated financial forecast, the model connects 15 configurable charging locations, AC/DC equipment capacity, grid-constrained electricity sales, operating expenditures, installation CAPEX, debt financing, three financial statements and investment valuation.
Designed for EV charging network operators, infrastructure developers, project sponsors, financial analysts, consultants and investment professionals, this workbook helps users evaluate charging economics, capital requirements, financial performance and potential investment returns.
The package includes 14 interconnected Excel worksheets, eight native dashboard charts, three financial scenarios and a detailed 25-page English PDF user guide.
⚡ 1. SITE-LEVEL EV CHARGING ECONOMICS
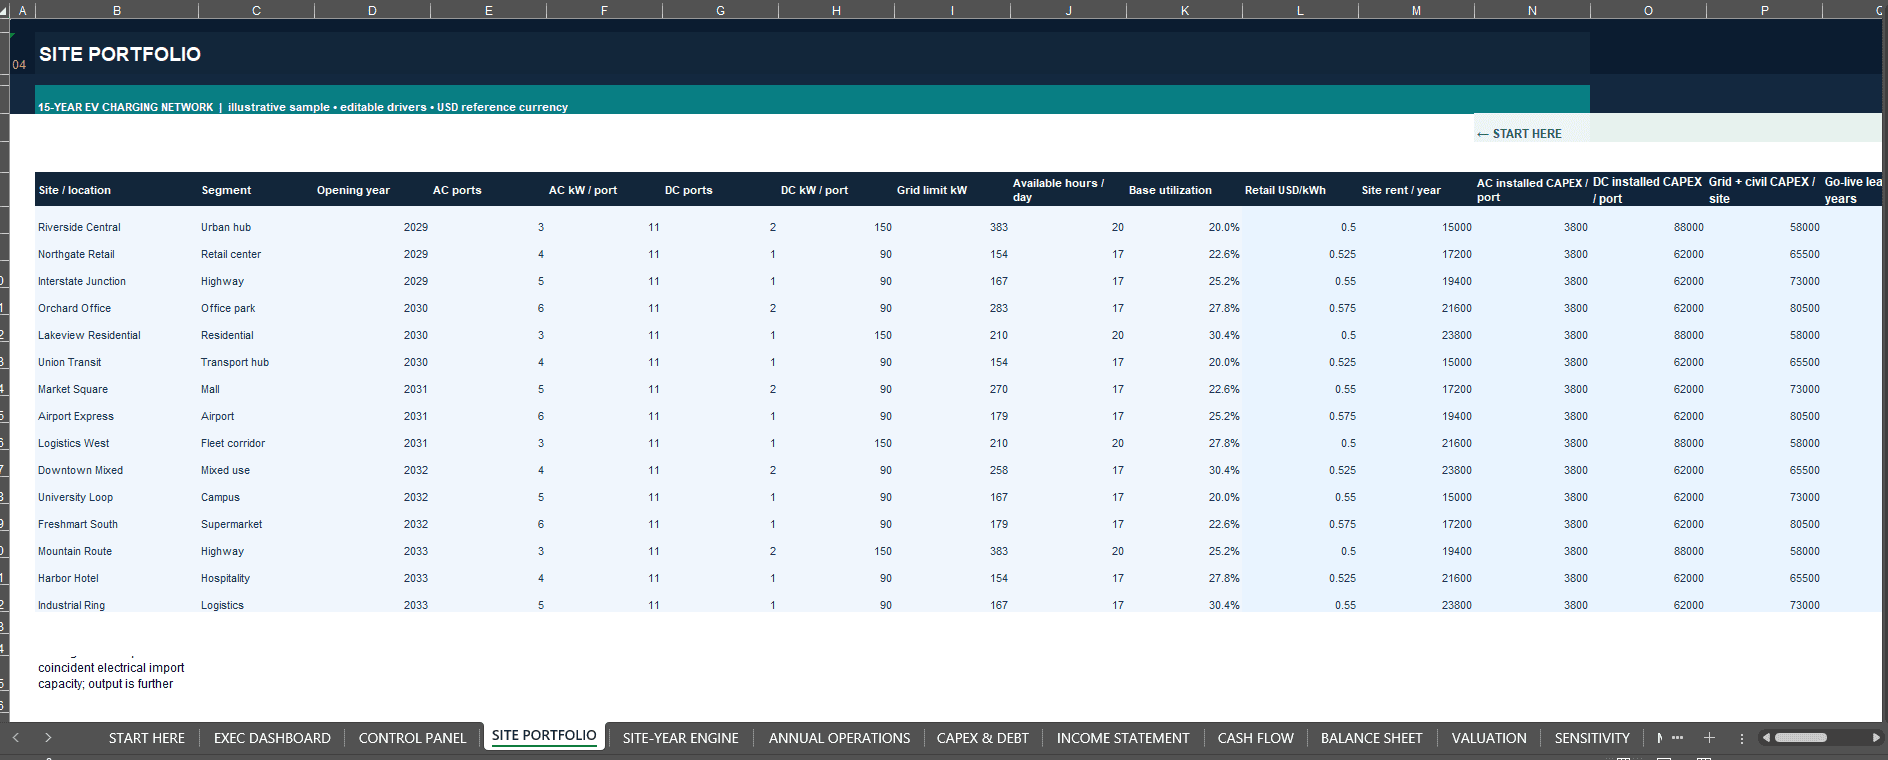
Build a connected infrastructure forecast around 15 editable charging locations, with 225 site-year calculations across the investment period.
Site-Level Modeling Features:
- Charging Site Segments and Locations
- Opening Years and Network Rollout
- AC and DC Charging Port Quantities
- Rated Charging Power per Port
- Electrical Grid Connection Limits
- Available Charging Hours
- Charger Utilization
- Technical Uptime and Availability
- Effective AC/DC Charging Load Factors
- Charging Conversion Efficiency
- Equivalent Charging Sessions
- Customer Charging Tariffs
- Annual Charging Price Escalation
The SITE-YEAR ENGINE connects physical infrastructure assumptions with projected electricity sales.
Energy output is constrained by the model’s charging equipment and electrical grid capacity calculations.
Purchased electricity reflects modeled conversion losses, providing a distinction between electricity purchased from the grid and electricity sold to charging customers.
Operating Cost Calculations Include:
- Electricity Procurement
- Annual Energy Price Escalation
- Grid Demand Charges
- Network and Payment Processing Fees
- Charger Maintenance
- Site Rent
- Insurance and Software
- Central Operating Overhead
These drivers feed site-level contribution margins and consolidated network operating performance.
📊 2. PREMIUM EXECUTIVE DASHBOARD & INVESTMENT KPIs
The Executive Dashboard consolidates the most important operating, financial and investment indicators.
Key Performance Indicators Include:
- Cumulative Network Energy Sold
- Year 15 Charger Utilization
- Project Net Present Value (NPV)
- Unlevered Project Internal Rate of Return (IRR)
- Levered Equity Internal Rate of Return
- Year 15 EBITDA per Active Charger
- Year 15 Gross Margin per kWh
- Simple Project Payback Year
- Minimum Debt Service Coverage Ratio (DSCR)
- Year 15 Break-Even Utilization
Eight native, data-linked Excel charts provide visual reporting on charging activity, network performance, operating profitability, financial statements and investment economics.
The dashboard connects directly to the financial calculation schedules and updates when the applicable model assumptions are changed.
Separate financing warnings help identify potential funding shortfalls and inadequate debt coverage.
🏦 3. INFRASTRUCTURE CAPEX & EQUIPMENT FINANCING
Evaluate the investment requirements associated with building and expanding an EV charging network.
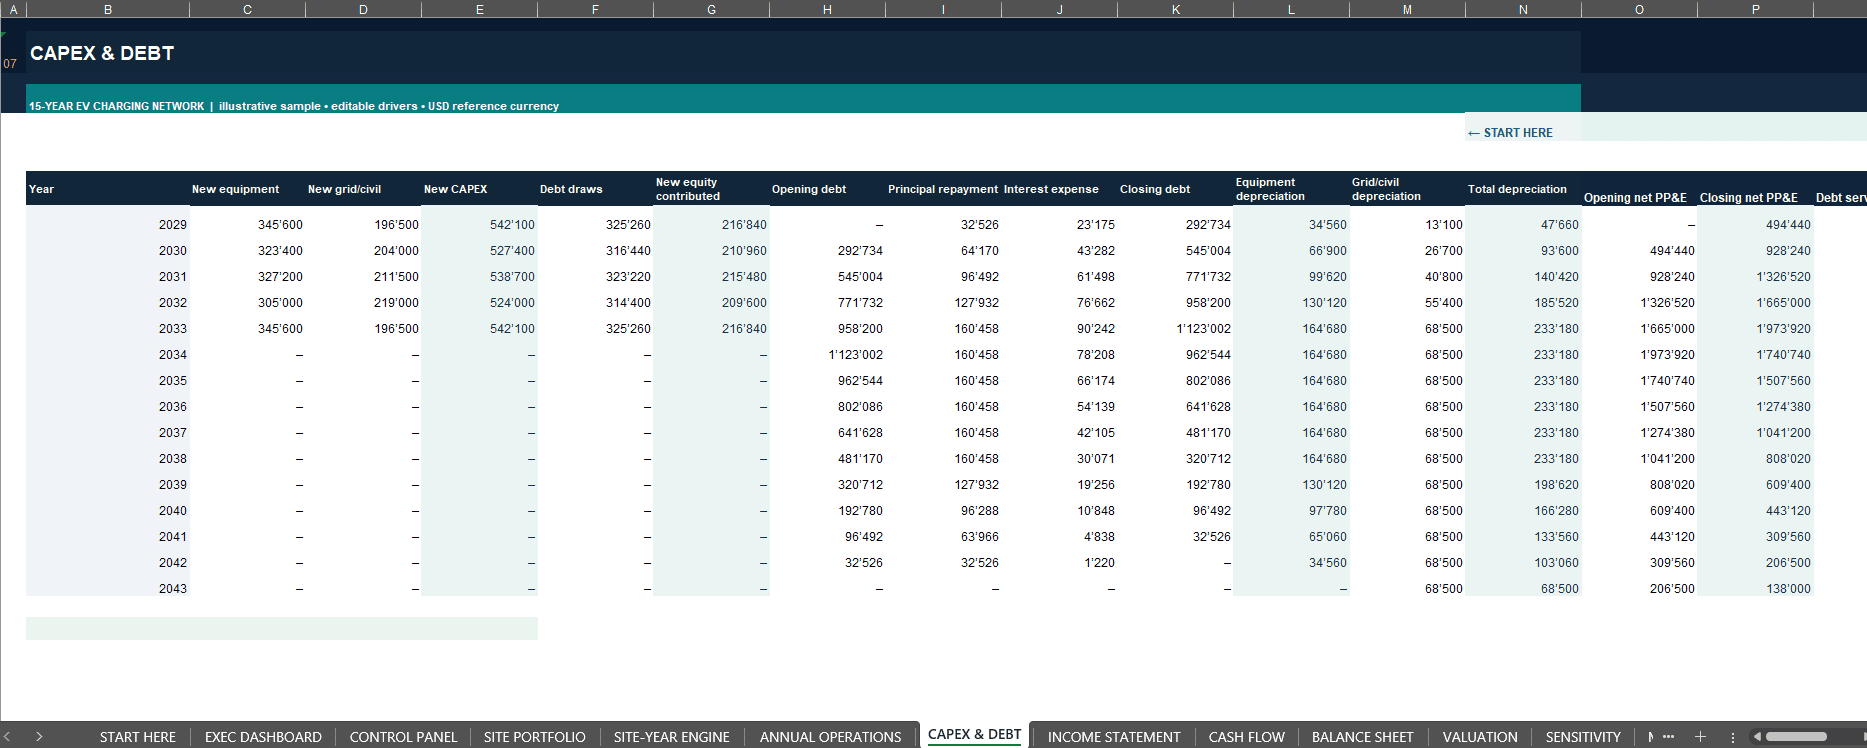
The model calculates infrastructure spending as locations enter operation.
Capital Investment Features:
- AC Charger Installation CAPEX
- DC Charger Installation CAPEX
- Grid Connection and Civil Infrastructure
- Site-Specific Investment Expenditure
- Phased Network Rollout
- Equipment Capitalization
- Vintage-Based Depreciation
- Cumulative Investment Requirements
Financing Features:
- Debt-Funded Share of New CAPEX
- Equipment Loan Drawdowns
- Investor Equity Contributions
- Annual Interest Expense
- Scheduled Principal Repayments
- Outstanding Loan Balances
- Debt Service Payments
- Debt Service Coverage Ratio
Loan assumptions can be adjusted through the CONTROL PANEL, including debt funding percentage, interest rate and amortization period.
The model makes financing shortfalls visible through negative projected cash balances instead of automatically inserting additional financing to eliminate liquidity gaps.
📈 4. INTEGRATED THREE FINANCIAL STATEMENTS
The workbook includes 15 connected annual reporting periods covering the illustrative years 2029–2043.
Integrated Financial Statements:
- Income Statement / Profit & Loss
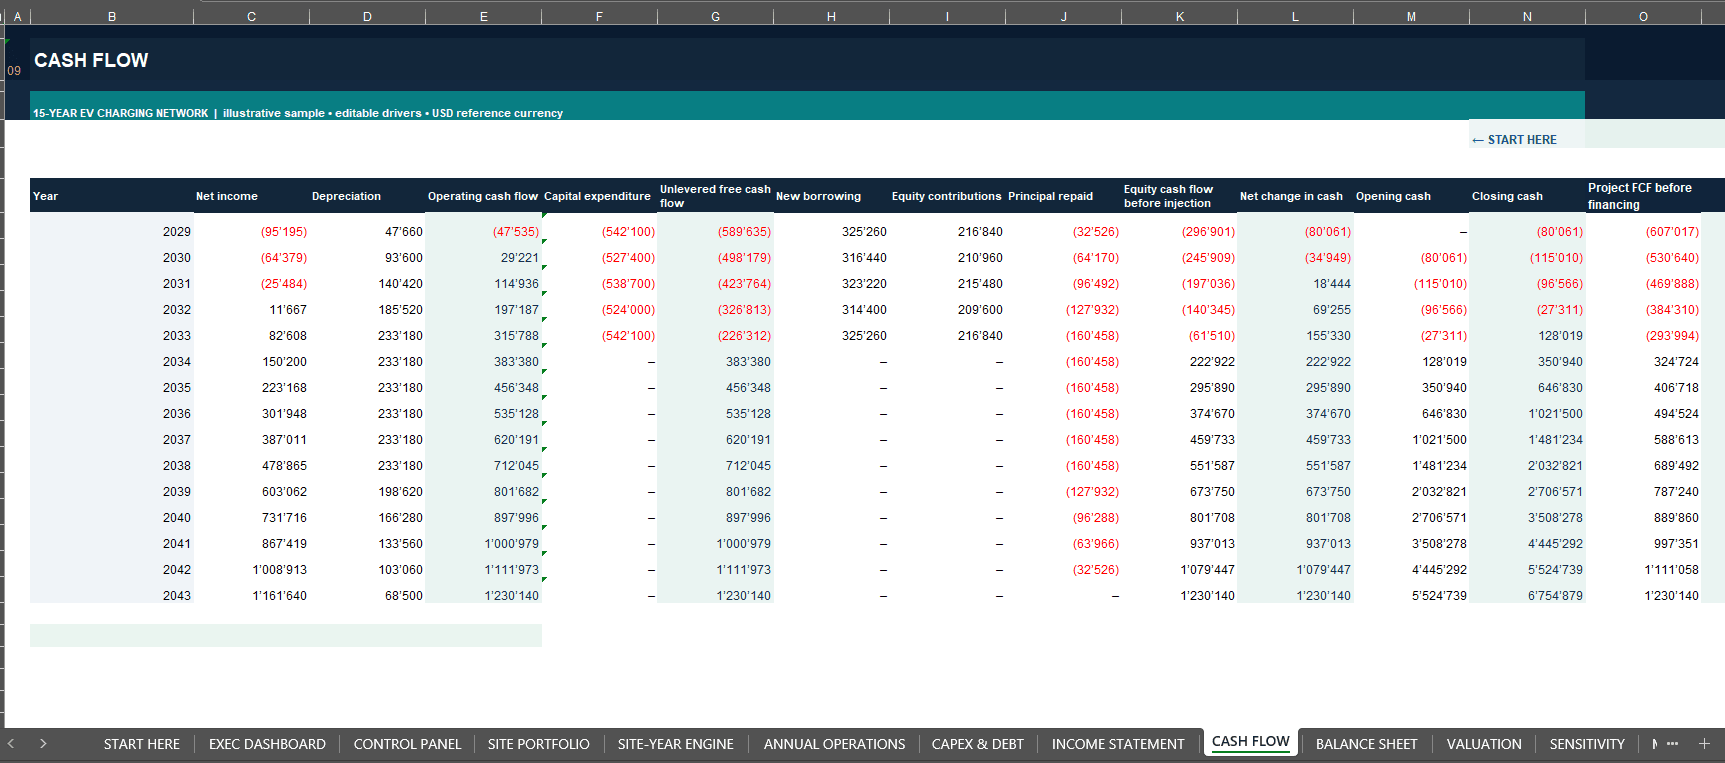
- Cash Flow Statement
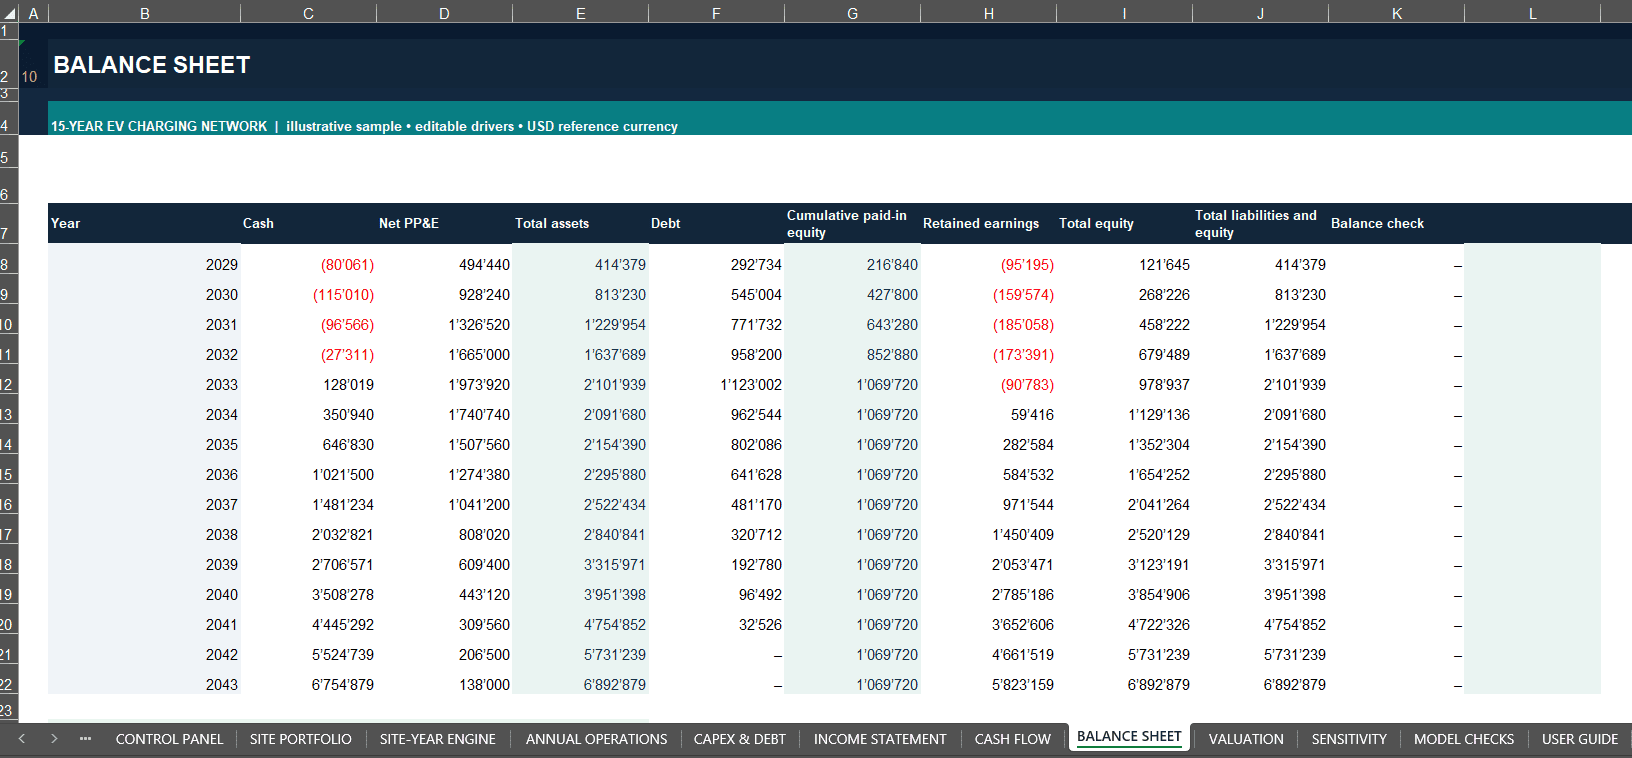
- Balance Sheet
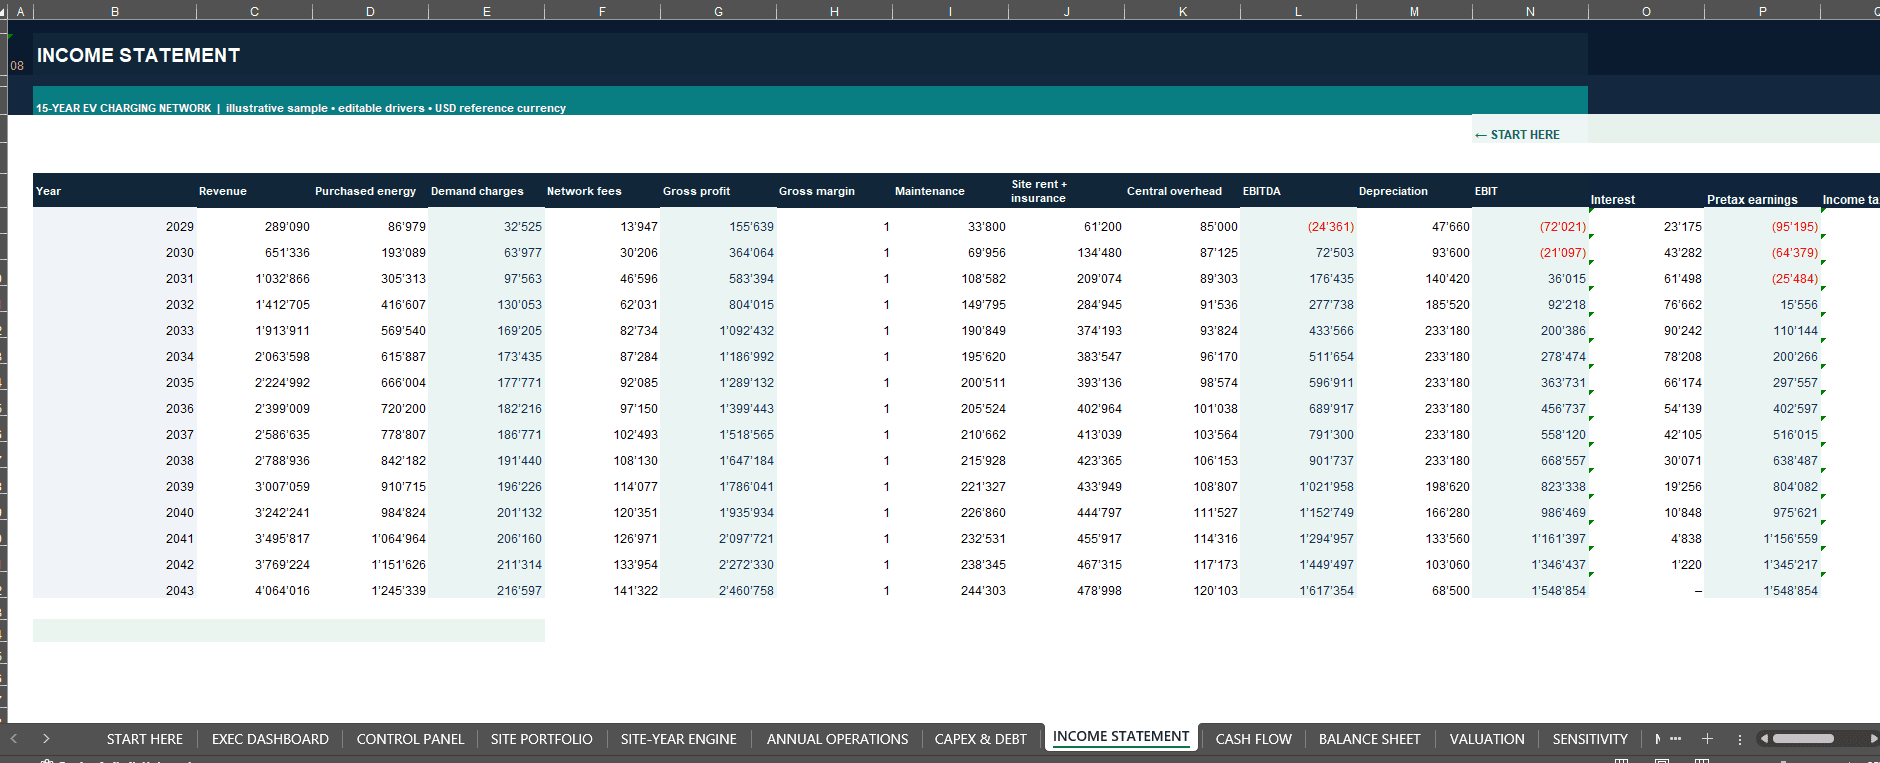
Financial reporting connects charging revenues, electricity purchases, network fees, operating expenses, CAPEX, depreciation, interest, taxes, debt financing and investor equity contributions.
Supporting Analysis Includes:
- Charging Revenue and Gross Profit
- Operating EBITDA
- Depreciation and Interest
- Taxable Income and Income Taxes
- Operating Cash Flow
- Capital Investment
- Financing Cash Movements
- Closing Cash Balances
- Net Property, Plant and Equipment
- Outstanding Debt
- Shareholder Equity
The annual financial statements provide a structured view of projected operating profitability, liquidity and financial position.
💼 5. INVESTMENT VALUATION & FINANCIAL RETURNS
Evaluate the long-term project economics using connected financial valuation calculations.
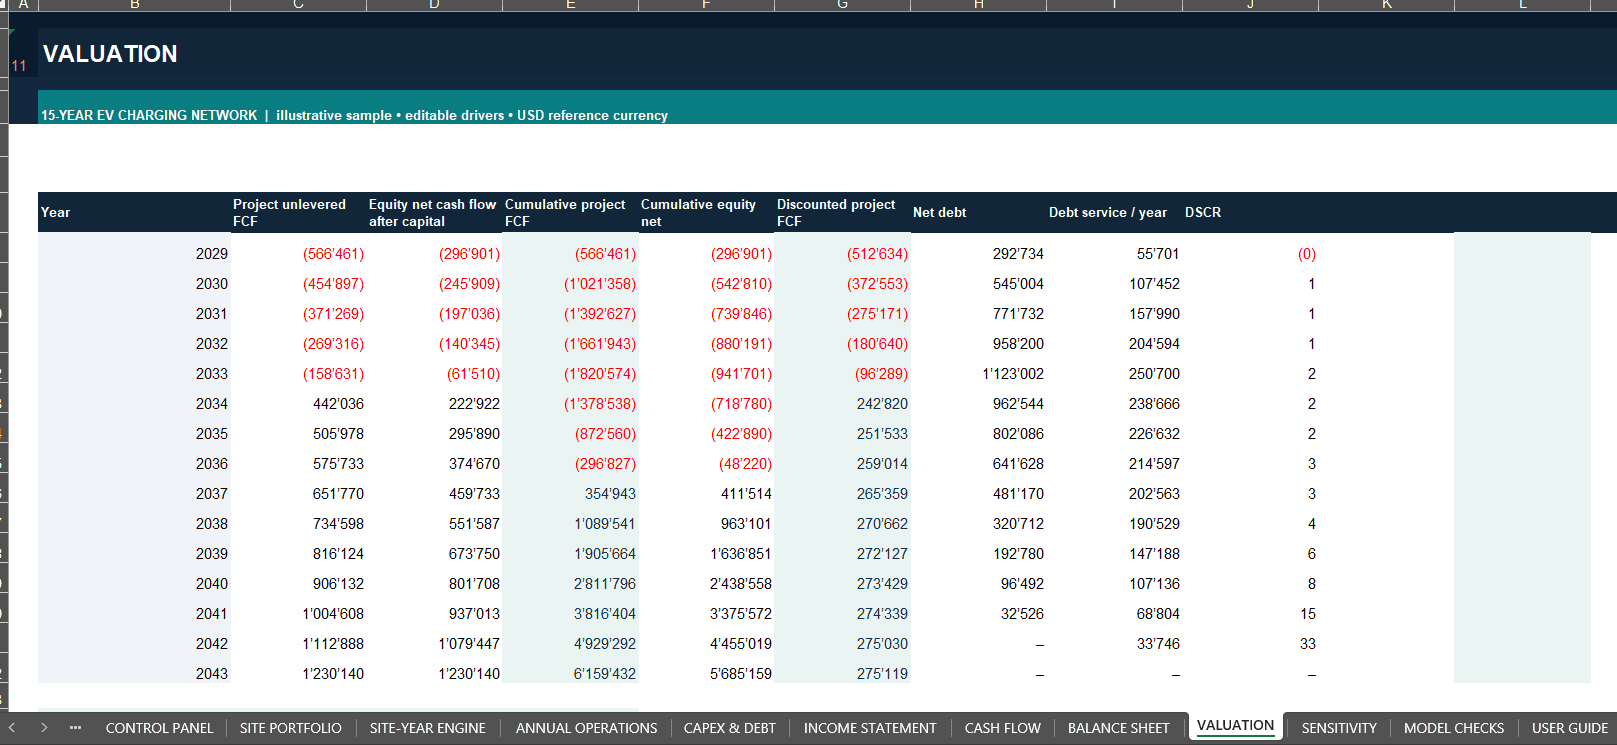
Investment Analysis Features:
- Project Net Present Value
- Annualized Unlevered Project IRR
- Annualized Levered Equity IRR
- Unlevered Project Free Cash Flows
- Investor Equity Cash Flows
- Cumulative Project Cash Flow
- Cumulative Equity Cash Flow
- Simple Project Payback Year
- Total Infrastructure CAPEX
- Discounted Annual Project Cash Flows
The valuation framework uses an editable annual discount rate and the model’s projected annual project cash flows.
Important Valuation Convention: The project NPV uses year-end discounted cash flows without an additional terminal value.
Unlevered project returns and levered equity returns are calculated separately, allowing users to examine the effects of borrowing and debt service on investor performance.
🔄 6. BASE, UPSIDE & DOWNSIDE SCENARIOS
Evaluate alternative investment outcomes using three selectable financial scenarios.
Available Scenarios:
- Base
- Upside
- Downside
Editable Scenario Drivers Include:
- Electricity Procurement Prices
- EV Charger Utilization
- Installation Capital Expenditure
- Charging Site Rollout Timing
Scenario factors connect to the site-year operating engine, consolidated financial statements and investment calculations.
This allows users to explore how charging demand, installation costs, purchasing prices and rollout timing may influence operating profitability, liquidity and financial returns.
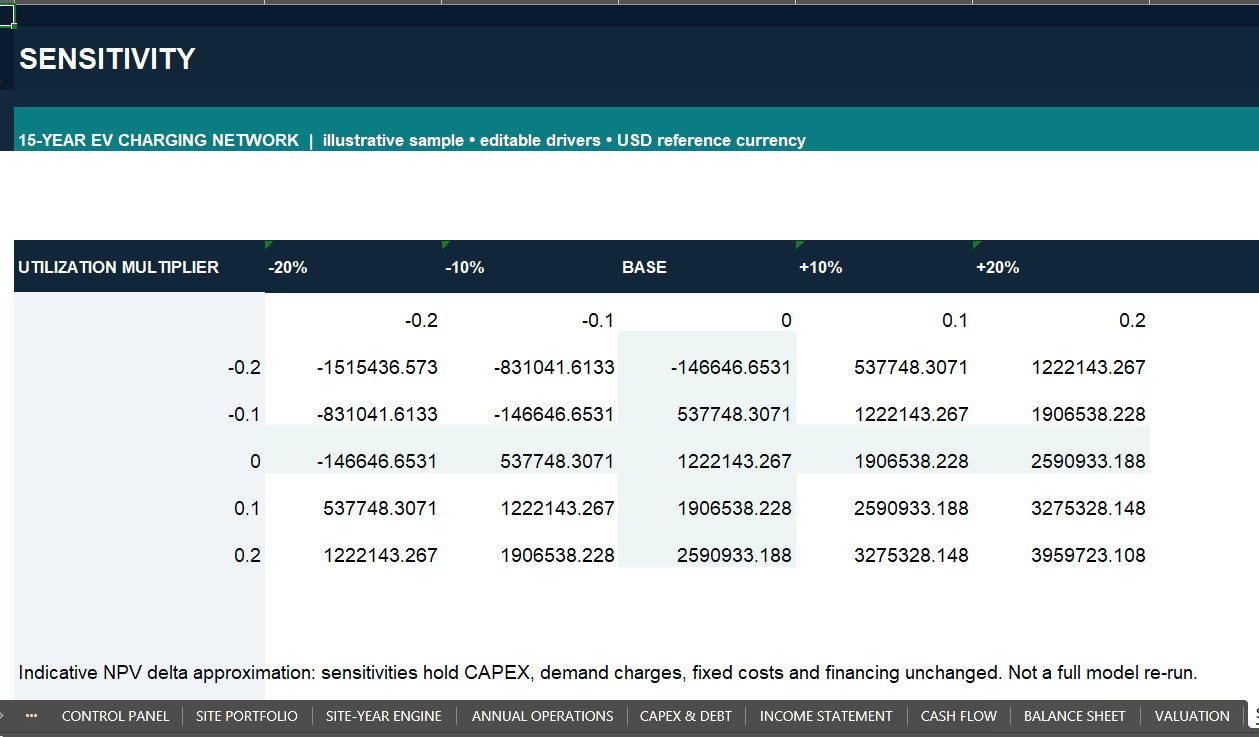
5 × 5 NPV SENSITIVITY ANALYSIS
The dedicated SENSITIVITY worksheet provides an indicative valuation matrix using simplified operating contribution adjustments.
The sensitivity calculation is an approximation, not an independent recalculation of every financial statement, financing schedule and tax assumption.
Use the scenario selector for linked operating and financing analysis.
✅ 7. MODEL INTEGRITY & FINANCIAL RISK CONTROLS
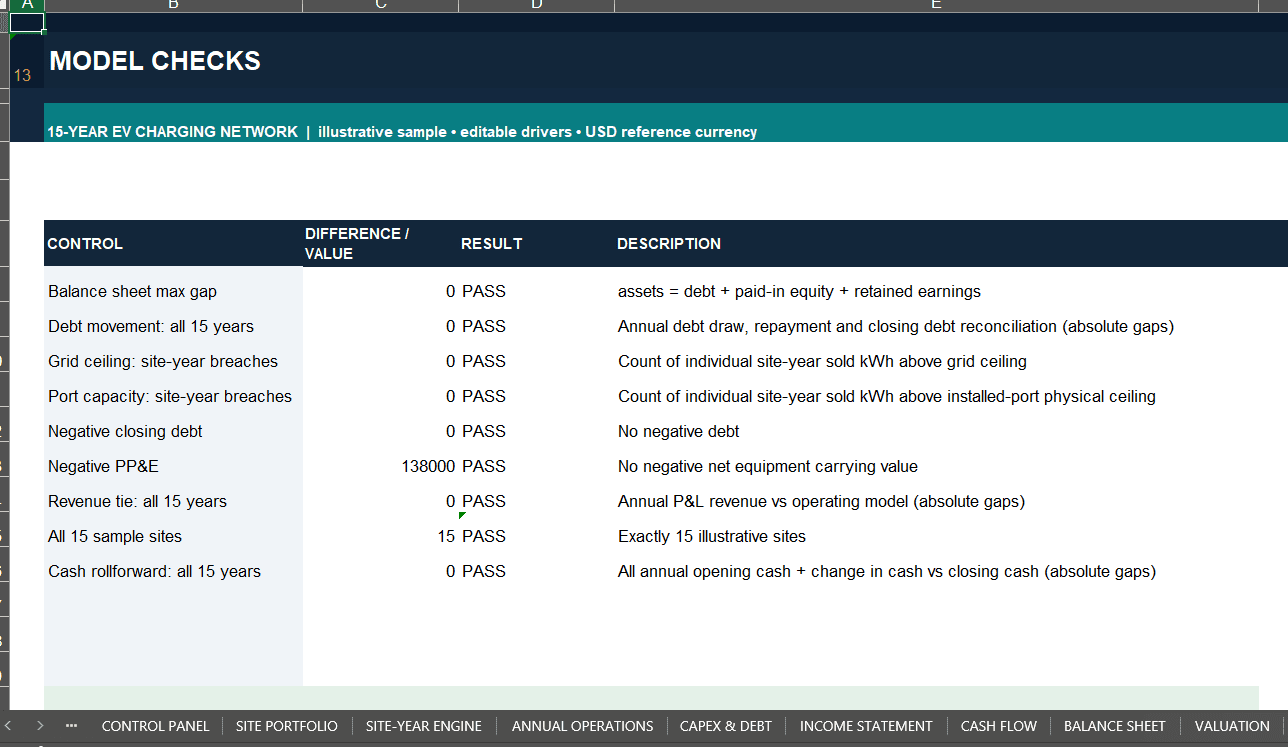
The MODEL CHECKS worksheet provides nine core reconciliation and operating-capacity controls.
Control Areas Include:
- Balance Sheet Reconciliation
- Annual Debt Movement Consistency
- Site-Year Grid Capacity Limits
- Site-Year Charging Equipment Capacity
- Non-Negative Debt Balances
- Net Equipment Carrying Values
- Annual Charging Revenue Reconciliation
- Site Register Completeness
- Annual Cash Flow Roll-Forward
Separate financing indicators identify potential negative cash balances and weak debt-service coverage.
Important: A PASS result confirms the programmed model reconciliations. It does not establish that the project is fully financed, economically viable or acceptable to lenders.
The fictional Base scenario contains both a funding-gap warning and a debt-service warning. These results are retained intentionally for transparent financial analysis.
📦 8. WHAT’S INCLUDED
FILE 1 — EV CHARGING STATION 15-YEAR FINANCIAL MODEL (.XLSX)
One editable Excel workbook containing:
- 14 Interconnected Worksheets
- 15 Editable Charging Locations
- 225 Site-Year Calculation Records
- 15 Annual Forecast Periods
- Eight Native Executive Dashboard Charts
- AC and DC Charging Economics
- Grid-Constrained Energy Calculations
- Electricity Procurement and Demand Charges
- Installation CAPEX and Depreciation
- Equipment Debt and Equity Financing
- Income Statement
- Cash Flow Statement
- Balance Sheet
- Project NPV
- Project and Equity IRR
- Simple Payback Analysis
- Base, Upside and Downside Scenarios
- 5 × 5 Indicative Sensitivity Analysis
- Dedicated Model Integrity Controls
- In-Workbook User Guidance
FILE 2 — COMPLETE HOW-TO-USE GUIDE (.PDF)
A professional 25-page English operating manual covering:
- Initial Workbook Setup
- Worksheet Navigation
- Editable Input Locations
- AC/DC Charging Assumptions
- Electrical Grid Capacity Calculations
- Charging Energy and Session Modeling
- Operating Expense Forecasting
- CAPEX and Equipment Financing
- Integrated Financial Statements
- NPV, IRR and Investment Returns
- Scenario and Sensitivity Analysis
- Model Integrity Checks
- Troubleshooting
- Important Financial Modeling Conventions
- Model Limitations and Final Review Checklist
Both purchased files are delivered together in one downloadable ZIP package.
The PDF guide may also be provided separately as a complimentary reference document. The free guide does not include the paid Excel financial model.
9. WHO IS THIS FINANCIAL MODEL FOR?
Designed for:
- EV Charging Network Operators
- EV Charging Infrastructure Developers
- Infrastructure Project Sponsors
- Financial Planning and Analysis Professionals
- Charging Business Entrepreneurs
- Infrastructure Investment Analysts
- Corporate Finance Managers
- Financial Consultants
- Investment Committees
- Energy and Mobility Infrastructure Professionals
The model is particularly suitable for evaluating early-stage charging infrastructure projects within a 15-location, annual financial planning framework.
🧭 10. HOW TO USE
STEP 1 — CONFIGURE THE INVESTMENT
Open START HERE and CONTROL PANEL. Set the forecast start year, reporting currency, financing parameters and active financial scenario.
STEP 2 — CUSTOMIZE CHARGING LOCATIONS
Replace fictional site assumptions with your own AC/DC charger quantities, rated power, grid limits, utilization, charging tariffs, electricity costs and rollout timing.
STEP 3 — REVIEW OPERATING ECONOMICS
Analyze SITE-YEAR ENGINE and ANNUAL OPERATIONS to understand projected charging volumes, electricity purchases, operating costs and margins.
STEP 4 — EVALUATE FINANCING
Review CAPEX & DEBT, investment requirements, outstanding borrowing and annual debt-service obligations.
STEP 5 — ANALYZE FINANCIAL PERFORMANCE
Examine the Executive Dashboard, integrated financial statements, VALUATION and SENSITIVITY worksheets.
STEP 6 — VERIFY MODEL RESULTS
Review MODEL CHECKS, negative cash balances, debt-service coverage and the assumptions behind projected investment returns.
11. TECHNICAL SPECIFICATIONS
- Product: EV Charging Station Financial Model
- Forecast Horizon: 15 Years
- Illustrative Forecast: 2029–2043
- Worksheets: 14
- Charging Locations: 15
- Site-Year Calculations: 225
- Native Dashboard Charts: 8
- Scenarios: Base, Upside, Downside
- Financial Reporting: Three Integrated Annual Statements
- Investment Metrics: NPV, Project IRR, Equity IRR, Payback
- Sensitivity: 5 × 5 Indicative NPV Matrix
- Documentation: 25-Page English PDF Guide
- File Formats: XLSX + PDF
- Recommended Software: Microsoft Excel Desktop
- Macros / VBA: Not Required
- Live External Data Connections: Not Required
- Delivery: Digital ZIP Download
Software Compatibility: Microsoft Excel Desktop is recommended. Google Sheets import and functional compatibility have not been independently verified. Equivalent formula calculations, charts, navigation, dropdowns and formatting are therefore not guaranteed.
The currency setting changes the reporting label only and does not perform automatic foreign-exchange conversion.
12. IMPORTANT MODEL LIMITATIONS & DISCLAIMER
The workbook contains fictional illustrative charging locations and financial assumptions provided for financial planning, educational use and scenario analysis.
This is an annual investment planning model, not an hourly charging dispatch simulator. Detailed charging queues, smart charging control, vehicle arrival distributions and grid engineering studies are outside its scope.
The model uses simplified financing, accounting, taxation and depreciation conventions. It does not include full working-capital movements, tax-loss carryforwards, replacement CAPEX, terminal value, debt sculpting or lender-specific covenant certification.
Equity returns should be reviewed alongside actual equity funding requirements and projected cash deficits.
The illustrative Base scenario includes negative cash balances and weak debt-service coverage. These outputs do not establish that the project is fully funded or financeable.
This is an independent, unofficial SheetworksStudio template. It is not affiliated with any vehicle manufacturer, charging network or software provider.
The product does not constitute investment, lending, engineering, legal, tax or accounting advice.
Users should replace all fictional assumptions with independently supported project-specific information and conduct appropriate financial and technical due diligence before making real-world investment decisions.
PLAN SITES. MODEL ENERGY. CONTROL CAPEX. ANALYZE RETURNS.
One Connected Excel Model for Professional EV Charging Infrastructure Investment Analysis.
SheetworksStudio | Premium Financial Modeling Templates
Similar ProductsOther customers were also interested in...


 eFinancialModels
Electric Vehicle (EV) Charging Station Financial M...
With this comprehensive 5- or 10-year monthly tool, investors can assess the viability of setting up... Read more

Financial Model for Mobile App | Mobile App Busine...
The Mobile App Financial Plan Template in Excel allows you to develop financial projections when lau... Read more

 HenrySheykin
Food Truck Financial Model Excel Template
The Food Truck Financial Model helps entrepreneurs, founders, business owners, consultants, and anal... Read more

Green Hydrogen Production from Wind Energy Financi...
The Green Hydrogen from Wind Financial Model aims to comprehensively forecast a horizon of 40 years ... Read more

Simple Mutual Non-Disclosure Agreement Template
Protect your business secrets with ease using our Simple Mutual Non-Disclosure Agreement Template. S... Read more

Solar Energy Financial Model
The Solar Energy Financial Model Spreadsheet Template in Excel assists you in preparing a sophistica... Read more

 Peter Graf
The Customer-Centric Financial Model for Restauran...
Starting a restaurant without a financial plan is like driving a car blindfolded. You wouldn´t do i... Read more
You must log in to submit a review.