
0 ITEMS

Self-Storage Acquisition and Lease-Up Underwriting Model — Unit Mix, ECRI, Monthly Absorption, Loan Sizing at MIN(LTV, DSCR, Debt Yield) and LP/GP Returns
Self-storage lease-up: unit mix, street versus in-place rates, monthly absorption, loan sized on stabilized NOI, levered IRR, LP/GP promote returns.

This Excel template underwrites a self-storage acquisition that is still leasing up, over a ten-year monthly hold. It is built the way a lender and an equity investor each look at the same facility, and it is designed for buyers and sponsors preparing a loan request or an investor presentation, lenders sizing a lease-up loan on stabilized NOI, and analysts who need to show when the facility stabilizes, what the loan supports and what comes back to equity.
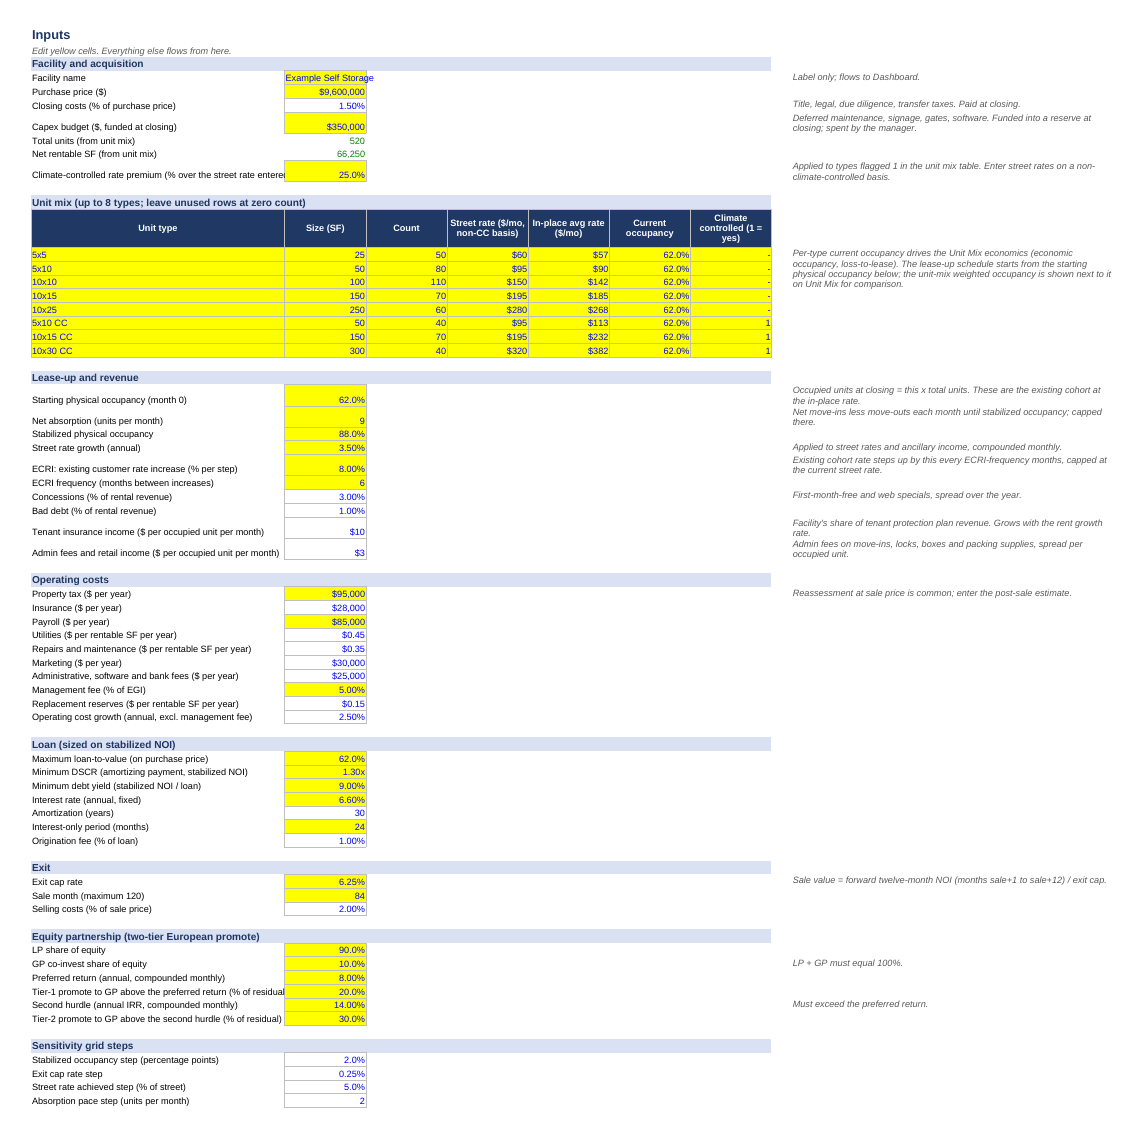
The Inputs sheet holds the full assumption set in one place: purchase price, closing costs and capex budget; a unit mix table of up to eight types with size, count, street rate, in-place average rate, current occupancy and a climate-controlled flag, with a single climate-controlled premium applied to flagged types; starting physical occupancy, net absorption in units per month, stabilized occupancy, street rate growth, the ECRI percentage and frequency that step existing customers toward street, concessions, bad debt, tenant insurance and admin and retail income per occupied unit; property tax, insurance, payroll, marketing and admin as fixed amounts, utilities, repairs and reserves per rentable square foot, management fee as a percent of EGI and operating cost growth; loan terms including maximum LTV, minimum DSCR, minimum debt yield, rate, amortization, interest-only months and origination fee; exit cap, sale month and selling costs; and the LP/GP equity split, preferred return, second IRR hurdle and the two promote tiers.
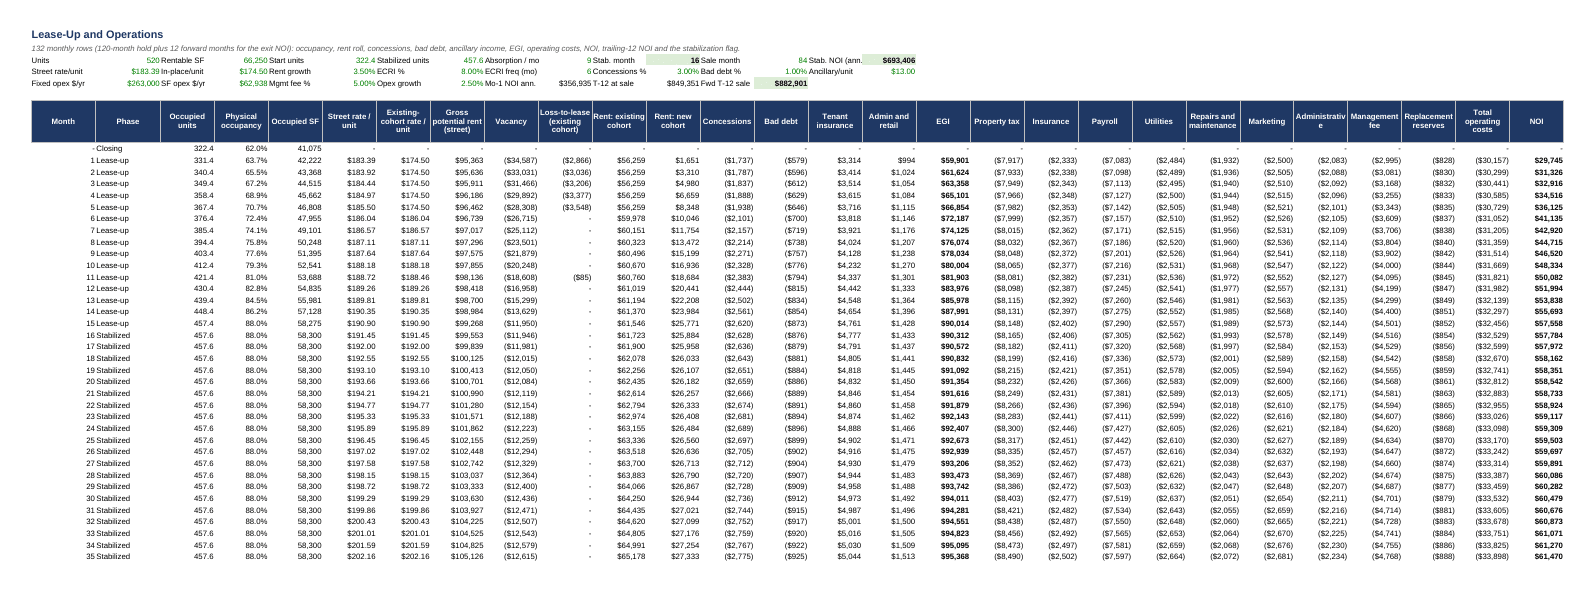
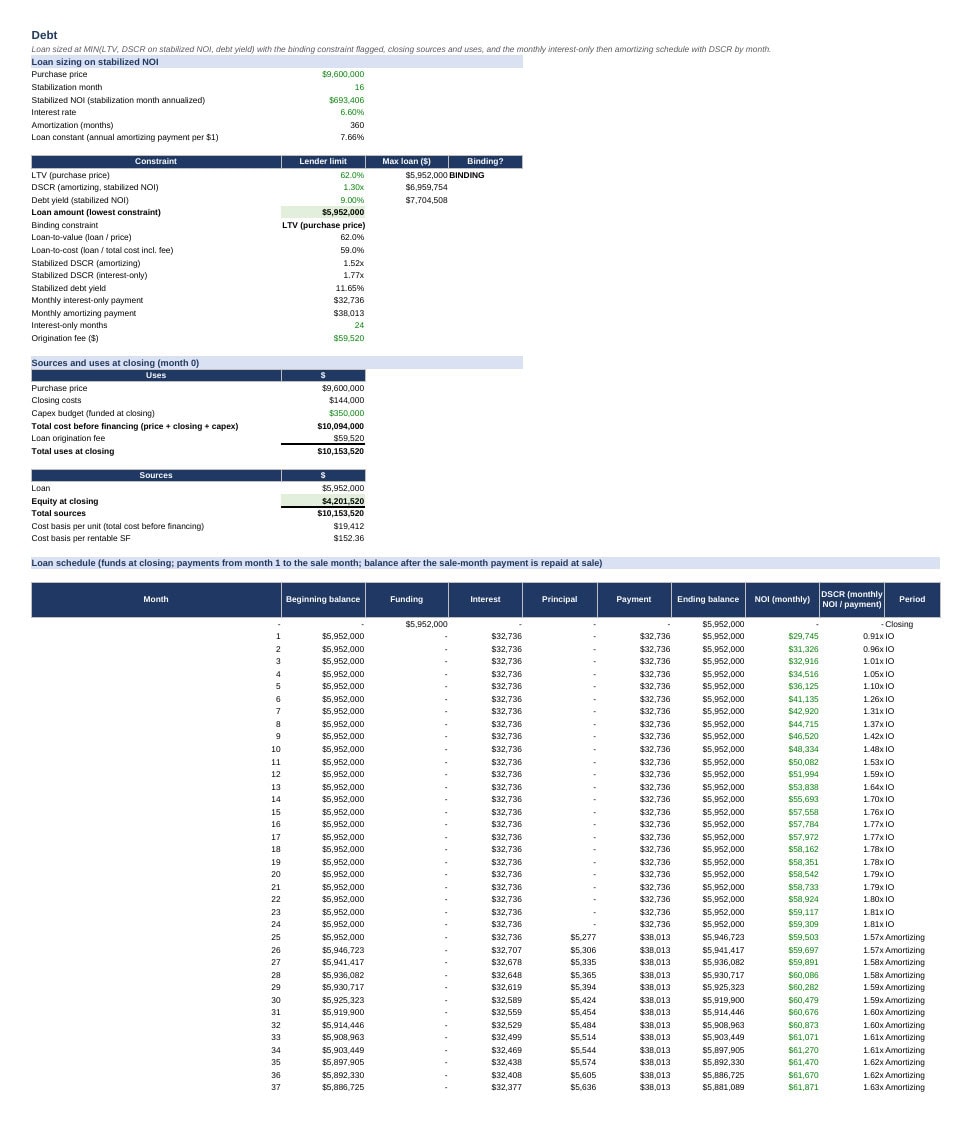
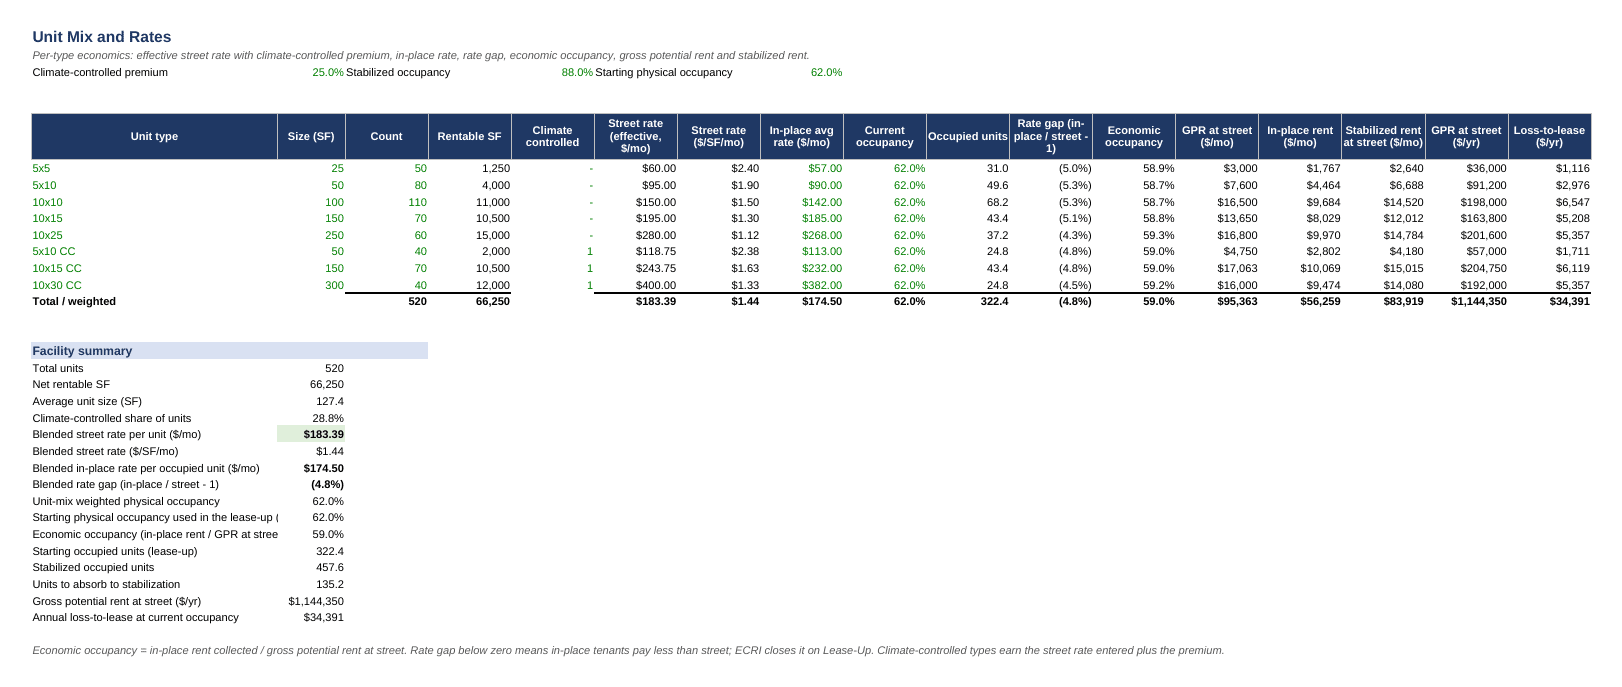
Unit Mix reports the per-type economics: effective street rate, street rate per square foot, in-place rate, occupied units, rate gap, economic occupancy, gross potential rent, in-place rent, stabilized rent and annual loss-to-lease, with blended totals. Lease-Up runs 132 monthly rows (the 120-month hold plus 12 forward months so a forward twelve-month NOI exists at any sale month): occupied units and square feet, physical occupancy, street rate and the existing-customer rate with ECRI step-ups capped at street, gross potential rent, vacancy, loss-to-lease, rent from the existing and new cohorts, concessions, bad debt, tenant insurance, admin and retail, EGI, each operating cost line, NOI, annualized and trailing-12 NOI, the stabilization flag and the marginal NOI per occupied unit that feeds the sensitivity. Debt sizes the loan at the lowest of LTV on price, DSCR on the amortizing payment against stabilized NOI and debt yield, flags the binding constraint, reports stabilized DSCR and debt yield at the sized loan, builds the closing sources and uses, and runs the monthly schedule with interest-only payments, the level amortizing payment thereafter, the balance repaid at sale and DSCR by month with the minimum over the hold.
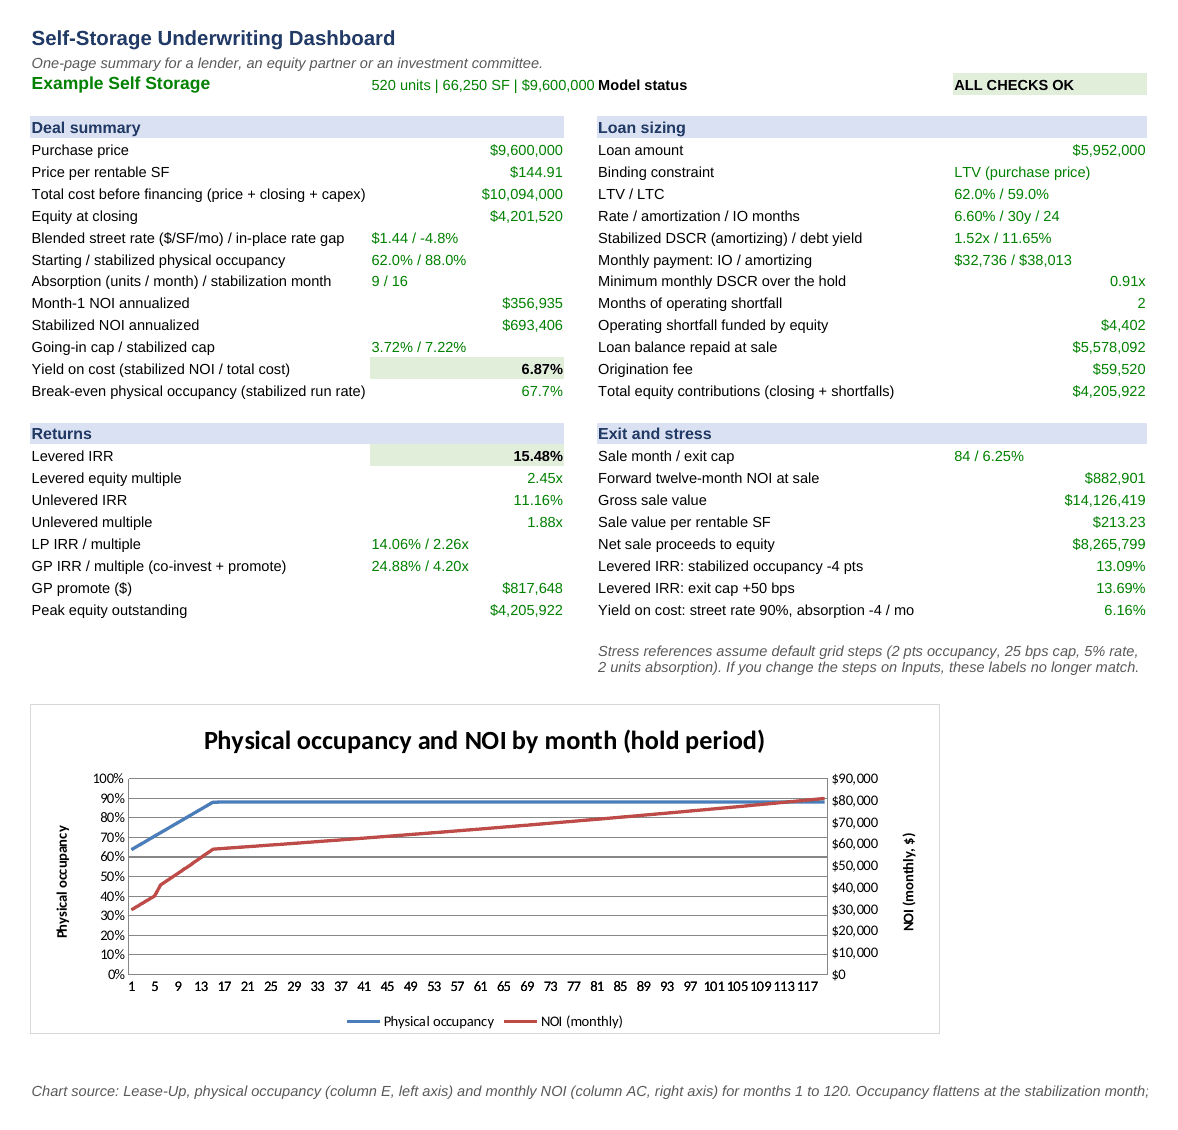
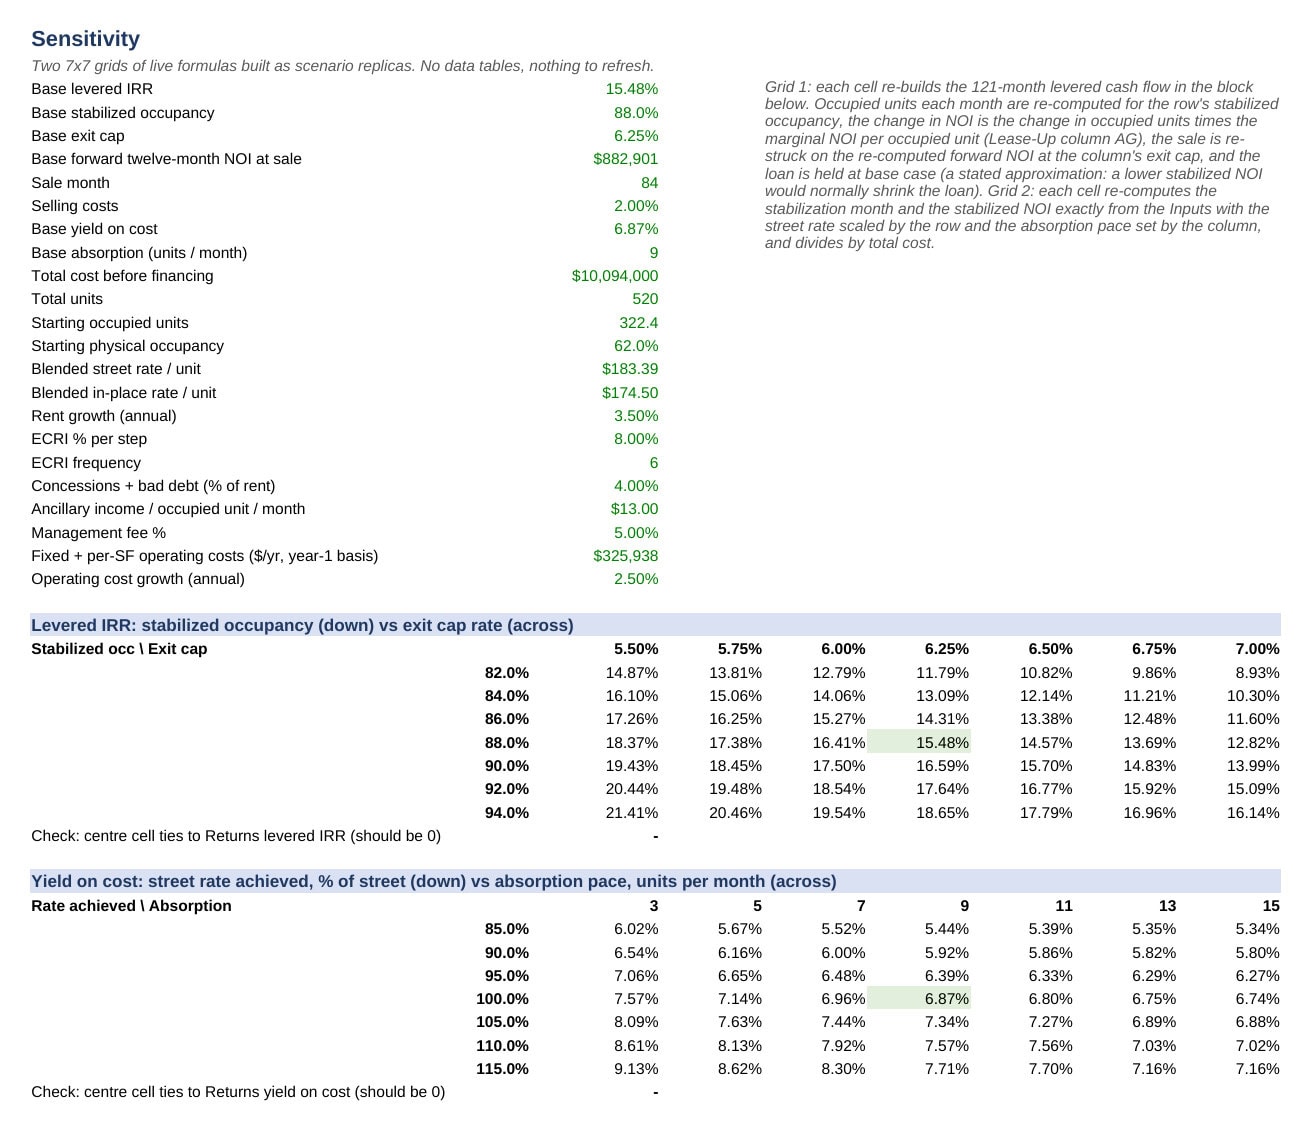
Returns builds the unlevered cash flow (total cost at closing, NOI to sale, net sale proceeds before debt) and the levered cash flow (equity at closing, NOI less debt service, loan payoff and net sale), reports IRRs and multiples, going-in cap, stabilized cap, yield on cost, break-even occupancy at the stabilized run rate, peak equity and the months and dollars of operating shortfall, and runs a European two-tier waterfall with hypothetical capital accounts for the preferred return and the second hurdle to produce LP and GP returns and the promote. Sensitivity contains two live 7×7 grids with no data tables: levered IRR against stabilized occupancy and exit cap, which rebuilds the 121-month levered cash flow for each of the 49 cells, and yield on cost against street rate achieved and absorption pace, which re-computes the stabilization month and stabilized NOI exactly for each cell. The Dashboard summarizes the deal, the loan, the returns and the stress cases on one page with a physical occupancy and NOI chart and a single status cell that rolls up twelve checks.
Formatting follows standard conventions: blue inputs, black formulas, green cross-sheet links, yellow fill on primary inputs. No macros, no data tables, no circular references, no external links, no protected sheets. Runs in Excel 2016 or later and in LibreOffice. The example case is a 520-unit, 66,250 square foot facility bought at 62% occupancy, stabilizing at 88% in month 16 and sold in month 84.
This template was built and tested by an AI system under a finance professional’s standing specification, recalculated with an independent engine and reviewed before release. It is a modelling tool, not financial, investment, lending or legal advice; match it to the actual rent roll, cost history and loan terms before relying on it.
Similar ProductsOther customers were also interested in...



 eFinancialModels
Electric Vehicle (EV) Charging Station Financial M...
With this comprehensive 5- or 10-year monthly tool, investors can assess the viability of setting up... Read more

Financial Model for Mobile App | Mobile App Busine...
The Mobile App Financial Plan Template in Excel allows you to develop financial projections when lau... Read more

 HenrySheykin
Food Truck Financial Model Excel Template
The Food Truck Financial Model helps entrepreneurs, founders, business owners, consultants, and anal... Read more

Green Hydrogen Production from Wind Energy Financi...
The Green Hydrogen from Wind Financial Model aims to comprehensively forecast a horizon of 40 years ... Read more

Simple Mutual Non-Disclosure Agreement Template
Protect your business secrets with ease using our Simple Mutual Non-Disclosure Agreement Template. S... Read more

Solar Energy Financial Model
The Solar Energy Financial Model Spreadsheet Template in Excel assists you in preparing a sophistica... Read more

 Peter Graf
The Customer-Centric Financial Model for Restauran...
Starting a restaurant without a financial plan is like driving a car blindfolded. You wouldn´t do i... Read more
You must log in to submit a review.