
0 ITEMS

RIA / Wealth-Management Practice Acquisition & SBA Underwriting Financial Model
Buying a wealth-management book or RIA? Underwrite it the way an SBA lender will. The broker prices the book at 2.2x recurring revenue ($4.18M); the bank prices the cash flow at ~6x Adjusted EBITDA ($2.19M) — this model shows both and the ~$2.0M gap. AUM roll-forward, blended-fee engine, retention/transition roll-forward, owner-advisor replacement, market-drawdown down-case, and an SBA 7(a) DSCR gate with the true DSCR next to the naive one. 11 sheets, machine-verified, Excel + Google Sheets.
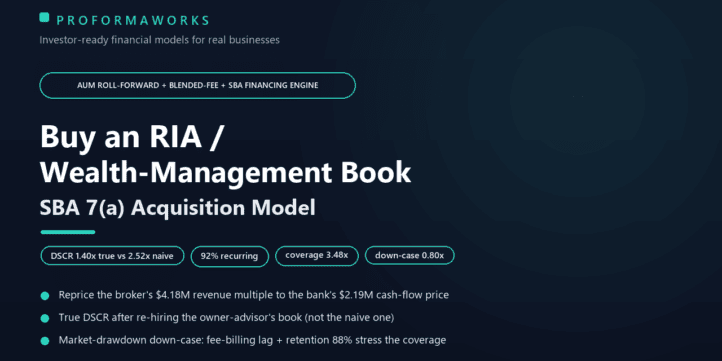


The broker prices a retiring advisor’s book at 2.2x recurring revenue. The bank prices the cash flow at about 6x. This lender-ready model shows you the gap — before you overpay roughly $2,000,000 on a wealth-management acquisition.
A $200M book at a 0.95% blended fee looks like a $4.18M asset on a revenue multiple. Underwritten as an SBA 7(a) acquisition — after a real advisor to replace the owner’s production, after the market can move AUM-linked fees, after transition-year attrition — it pencils at $2.19M (6.0x Adjusted EBITDA). That gap is the whole game, and this is the model a solo or junior buyer, or an aggregator add-on, hands the lender.
The engine. Recurring advisory revenue is built bottom-up: beginning AUM rolled forward by market appreciation and net client flows, times a graduated blended fee, split into recurring fee, planning retainers and any transactional income (recurring share 92%). A retention and transition roll-forward models the single biggest risk in a wealth-book sale: clients who leave when the selling advisor exits — 90-95% retained if the transition is handled, materially less on a botched custodian switch — with an earnout to a 95%-at-month-24 benchmark.
What a revenue multiple hides — priced here. (1) Two prices side by side: the revenue-multiple price ($4.18M) next to the cash-flow price ($2.19M), each with its DSCR. (2) The owner-advisor replacement: the seller usually holds the top relationships and produces a large share of the book; replacing that production (a grid split or salary, about $275k) is deducted to reach Adjusted EBITDA. (3) The true DSCR (1.40x) printed next to the naive DSCR (2.52x) the broker sheet implies. (4) A market-drawdown down-case: because fees are AUM-linked, a -20% drawdown plus transition attrition drives DSCR to 0.80x, below the 1.25x floor — the operating leverage an operating business doesn’t carry. (5) A recurring-versus-transactional re-rate and a client-age / decumulation flag (net flows can turn negative as a book ages).
Financing, honestly. An SBA 7(a) capital stack — your equity, a seller note with a full-standby versus amortizing toggle as a DSCR lever, and a loan sized to DSCR, not LTV, because a wealth book is goodwill and collateral-light. Leverage lands near 66% — that’s how these deals actually fund. Three practice profiles (Transactional & Hybrid-Heavy 5.0x, Balanced Fee-Based 6.0x, Fee-Only Recurring-Forward 7.0x) reload the recurring share, multiple and working capital in one toggle.
What’s inside: an 11-sheet Excel workbook (Google-Sheets compatible, no macros), a 24-page PDF guide, recurring-fee coverage, debt yield, cash-on-cash and a 5-year multiple (leverage-amplified, flagged; no live IRR by design). SDE (~31%) and Adjusted EBITDA (~18%) are realistic, not inflated. Benchmarks from Schwab/Fidelity RIA studies, Kitces fee data, FP Transitions/DeVoe multiples and Live Oak SBA lending. Educational planning tool — not investment or financial advice.
Similar ProductsOther customers were also interested in...



 eFinancialModels
Electric Vehicle (EV) Charging Station Financial M...
With this comprehensive 5- or 10-year monthly tool, investors can assess the viability of setting up... Read more

Financial Model for Mobile App | Mobile App Busine...
The Mobile App Financial Plan Template in Excel allows you to develop financial projections when lau... Read more

 HenrySheykin
Food Truck Financial Model Excel Template
The Food Truck Financial Model helps entrepreneurs, founders, business owners, consultants, and anal... Read more

Green Hydrogen Production from Wind Energy Financi...
The Green Hydrogen from Wind Financial Model aims to comprehensively forecast a horizon of 40 years ... Read more

Simple Mutual Non-Disclosure Agreement Template
Protect your business secrets with ease using our Simple Mutual Non-Disclosure Agreement Template. S... Read more

Solar Energy Financial Model
The Solar Energy Financial Model Spreadsheet Template in Excel assists you in preparing a sophistica... Read more

 Peter Graf
The Customer-Centric Financial Model for Restauran...
Starting a restaurant without a financial plan is like driving a car blindfolded. You wouldn´t do i... Read more
You must log in to submit a review.