
0 ITEMS

Occupational Therapy Financial Model Excel Template
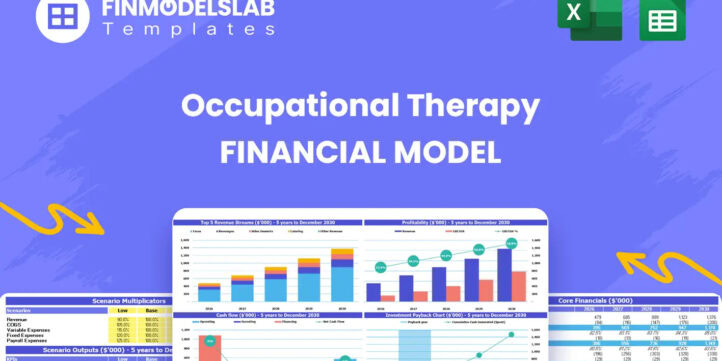
The Occupational Therapy Financial Model helps users build a structured forecast for an OT clinic or therapy services business without starting from a blank spreadsheet. It is designed around the financial drivers that matter most in occupational therapy, including visit volume, payer mix, service pricing, therapist capacity, utilization rates, reimbursement timing, staffing needs, startup costs, operating expenses, cash flow, and profitability. Instead of relying on a generic healthcare model, users can plan around the real economics of pediatric OT, adult rehab OT, geriatric OT, hand therapy, group programs, and other service lines that may be relevant to their clinic. This financial model template is useful for entrepreneurs launching a private practice, clinic owners expanding locations, consultants preparing financial projections, analysts evaluating feasibility, and founders developing business plans or funding documents. It gives users a practical way to define revenue assumptions, estimate therapist productivity, plan payroll, forecast recurring expenses, and understand how changes in utilization, pricing, staffing, and reimbursement affect overall performance. The model is built to support both early planning and investor-ready presentation, helping users communicate the financial logic behind the business in a clear and professional format. The template supports financial planning across multiple years, allowing users to review projected revenue growth, profit margins, EBITDA, cash flow, and return metrics over time. It also helps organize the startup cost breakdown required to open or prepare an occupational therapy practice, including build-out, equipment, technology, furniture, and working capital needs. For ongoing operations, users can estimate fixed and variable expenses, payroll, supply costs, administrative overhead, and other recurring commitments that influence monthly cash requirements and long-term sustainability. By connecting assumptions to automated outputs, the Occupational Therapy Financial Model helps users make better decisions before committing capital, hiring staff, signing leases, or approaching lenders and investors. It can be used to test low, base, and high scenarios, review break-even analysis, monitor KPI performance, and evaluate whether the clinic can become profitable under realistic operating conditions. Fully editable and compatible with Excel and Google Sheets, it gives business owners and planning teams a ready-to-use framework for building a credible occupational therapy forecast, preparing funding discussions, and managing the financial direction of the practice.


Financial Model Overview
The Occupational Therapy Financial Model is a ready-to-use financial model template built for entrepreneurs, clinic owners, consultants, analysts, and founders planning an occupational therapy practice or therapy services business. It helps users turn operational assumptions into a structured financial forecast by connecting visit volume, payer mix, service pricing, therapist staffing, reimbursement assumptions, startup costs, operating expenses, cash flow, and profitability.
For an OT clinic, financial planning depends on more than general healthcare revenue estimates. The model needs to reflect therapist capacity, treatment utilization, service mix, administrative support, insurance collections, private pay activity, and the cost of maintaining a clinical environment.
This template provides an organized framework for evaluating those drivers over a multi-year period, supporting business planning, lender discussions, investor presentations, internal budgeting, and launch decisions. Because the fields are editable, users can adapt the model to a pediatric clinic, adult rehabilitation practice, geriatric service provider, hand therapy specialty clinic, group therapy program, or a broader multi-service occupational therapy business.
All-in-One Dashboard
The all-in-one dashboard brings core inputs and core outputs into one central planning view so users can quickly understand the financial position of the occupational therapy business. This component may include editable assumptions for launch timing, pricing, utilization, therapist capacity, payer behavior, staffing levels, cost categories, and investment requirements, while summarizing the resulting revenue, gross profit, EBITDA, net income, cash flow, and funding position. For an OT practice, this is especially useful because changes in therapist utilization or reimbursement rates can materially affect clinic performance, and the dashboard makes those relationships easier to see.
Instead of searching through multiple worksheets or disconnected calculations, users can review the most important planning variables in a single location and use the outputs to guide decisions about hiring, marketing spend, service expansion, or capital needs. The dashboard is also helpful for communicating with partners, advisors, lenders, and investors because it condenses the operating plan into a clear financial snapshot while still allowing the underlying assumptions to be adjusted as the business plan evolves.
Low, Base, and High Scenario Analysis
The low, base, and high scenario analysis section allows users to test how the occupational therapy clinic may perform under different operating conditions. This component typically uses key assumptions such as patient volume, utilization rates, reimbursement per visit, private pay pricing, therapist salaries, administrative payroll, marketing effectiveness, occupancy costs, and supply expenses to produce alternate forecasts.
The low case can be used to assess downside risk if client acquisition is slower, insurance payments take longer, or staffing costs rise. The base case can represent the most realistic operating plan for business planning and funding discussions. The high case can show the upside potential if therapist schedules fill faster, referral relationships perform well, or higher-margin services contribute more revenue. This is valuable because OT clinics often face uncertainty around initial caseload growth, payer mix, and staffing capacity. By comparing outcomes across scenarios, users can evaluate whether the business remains viable under pressure, identify the assumptions that matter most, and prepare more credible conversations with lenders, investors, or internal decision-makers.
Professional Charts
The professional charts component converts financial projections into visual reports that are easier to interpret and present. This section may display trends in revenue, EBITDA, net profit, cash balance, operating expenses, utilization, service line performance, and growth over time. For occupational therapy planning, charts are useful because they make the relationship between operational growth and financial performance more visible.
A clinic owner can see whether revenue is scaling in line with therapist capacity, whether expenses are rising faster than income, or whether cash reserves are sufficient during the launch period. Consultants and analysts can use these visuals to support business plans, pitch materials, board updates, or lender presentations without building charts manually from scratch.
Professional charts also help non-financial stakeholders understand the forecast quickly, which is important when presenting to clinical founders, practice partners, or external financing sources. By translating spreadsheet outputs into clean visual summaries, this component improves communication and makes the financial model more practical for strategic planning, funding preparation, and ongoing performance review.
ROE Components and DuPont Analysis
The ROE components section uses DuPont analysis to break return on equity into its underlying financial drivers, helping users understand why the occupational therapy business generates a particular level of return. This component may evaluate profitability, asset efficiency, and leverage by connecting net margin, asset turnover, and equity multiplier assumptions to overall ROE. For an OT clinic, this can be helpful when reviewing how operational choices affect investor returns. For example, pricing, therapist productivity, cost control, and payer collections influence margin, while equipment investment, clinic build-out, and working capital affect the asset base.
Financing choices, such as owner equity, loans, or other funding sources, may also influence return metrics. The output helps users go beyond a single return figure and identify whether performance is being driven by strong margins, efficient use of assets, or capital structure. This is especially useful for founders and investors who want to assess whether the business can produce acceptable returns while maintaining a sustainable level of debt and reinvestment. It also supports better decision-making when comparing growth strategies, location expansion, or additional service lines.
Revenue Inputs
The revenue inputs component is where users define the commercial assumptions that drive income for the occupational therapy practice. This section may include service lines such as pediatric OT, adult rehab OT, geriatric OT, hand therapy OT, group programs, evaluations, recurring treatment visits, and other therapy services. Inputs can include the number of therapists, monthly treatment capacity per therapist, utilization rates, appointment volume, price per treatment, reimbursement per session, payer mix, cancellation assumptions, and annual price growth. These assumptions are essential because revenue in an OT clinic is closely tied to available clinical capacity and the ability to keep therapist schedules productive.
The model translates those inputs into monthly and annual revenue projections, helping users estimate how much income each service line can generate and how staffing decisions affect total sales. This section is useful for planning launch targets, setting pricing, validating referral assumptions, comparing services, and determining whether the practice can support its payroll and overhead. It also helps users document the logic behind the forecast, which is important for business plans, loan applications, investor materials, and internal planning.
Bank-Ready Reports
The bank-ready reports component provides lender-friendly financial outputs that help users present the occupational therapy business in a structured and credible format. This section may include projected profit and loss statements, cash flow forecasts, balance sheet summaries, debt service assumptions, funding needs, EBITDA, net income, and other financial outputs that banks and financing partners typically review.
For a clinic seeking a loan, line of credit, or equipment financing, this component helps show whether the business can generate enough cash to cover operating expenses, payroll, rent, debt payments, and working capital needs. It also helps users explain how initial funding will be used, how revenue is expected to ramp up, and when the practice may become financially stable.
Bank-ready reports are valuable because lenders usually want more than optimistic revenue goals. They need to see assumptions, expense structure, liquidity, repayment capacity, and the timing of cash inflows and outflows. By organizing these outputs in a professional format, the model can strengthen funding discussions and reduce the time required to prepare financial documents.
Revenue Breakdown
The revenue breakdown component gives users a detailed view of revenue by service stream, making it easier to understand which parts of the occupational therapy business contribute most to total income. This section may separate pediatric OT, adult rehab OT, geriatric OT, hand therapy, group programs, evaluations, recurring visits, or other custom services depending on the clinic’s business model. Inputs may include pricing, visit volume, utilization, therapist allocation, reimbursement assumptions, and growth rates for each category. The outputs can show monthly revenue, annual revenue, revenue mix, contribution by service line, and changes in service composition over time.
This is particularly useful for OT practices because different services may have different pricing, clinical capacity requirements, supply needs, margins, and referral patterns. A detailed revenue breakdown helps users identify the most important growth drivers, evaluate whether the service mix is balanced, and decide where to focus marketing, hiring, or specialty development. It also helps support strategic decisions such as adding hand therapy, expanding pediatric programs, increasing group services, or shifting toward higher-margin private pay offerings.
KPI Dashboard
The KPI dashboard tracks key performance indicators that help users monitor the operating health of the occupational therapy practice. This component may include metrics such as revenue per therapist, utilization rate, treatments per month, average reimbursement per visit, gross margin, EBITDA margin, payroll as a percentage of revenue, cash balance, client volume, payback period, return on equity, and other clinic-specific benchmarks. For an OT business, KPIs are essential because financial performance depends on both clinical productivity and cost discipline.
A practice may generate strong demand but still struggle if therapist schedules are underutilized, collections are delayed, or administrative expenses grow too quickly. The KPI dashboard helps users compare planned performance against targets and industry-style benchmarks, making it easier to identify issues early and take corrective action. It is also useful for ongoing management after launch, not just initial planning. Owners can use the dashboard during monthly reviews, consultants can use it to evaluate client performance, and investors can use it to assess whether the business is progressing according to the financial plan.
Break-Even Analysis
The break-even analysis component helps users identify when the occupational therapy clinic is expected to cover its total costs and begin generating profit. This section may use assumptions for service pricing, visit volume, therapist utilization, reimbursement rates, variable costs, payroll, rent, administrative expenses, marketing, software, insurance, and other overhead to calculate the revenue level and timing required to reach break-even.
For a new OT practice, this is one of the most important planning tools because the early months often involve marketing spend, staffing commitments, lease costs, equipment purchases, and delayed reimbursement collections before patient volume fully develops. The output can show the break-even month, required monthly visits, required revenue, contribution margin, and cash burn before the clinic reaches stability.
This helps founders understand how much runway they need, how quickly caseload must grow, and which assumptions have the greatest impact on profitability. It is also valuable for lenders and investors because it provides a clear milestone for evaluating business viability and funding risk. By using break-even analysis, users can make more informed decisions about launch timing, hiring pace, pricing, and working capital reserves.
Startup Costs and Funding Plan
The startup costs and funding plan component organizes the initial investment required to open or expand an occupational therapy practice. This section may include clinic build-out and renovation, specialized therapy equipment, treatment tables, sensory tools, hand therapy equipment, office furniture, computers, practice management software, deposits, licenses, insurance, initial marketing, professional fees, hiring costs, and working capital reserves. The model can help users separate one-time startup costs from recurring operating expenses, estimate total capital requirements, and determine how funding may be covered through owner contributions, loans, investor capital, grants, or lines of credit.
For an OT clinic, this is useful because underestimating launch costs can create cash pressure before the practice has enough clients to support itself. A clear funding plan helps users understand how much money is needed before opening, how funds will be allocated, and whether additional financing may be required during the ramp-up period. It also supports business plans and funding documents by presenting a transparent use of funds, giving lenders and investors confidence that the launch budget has been considered carefully and connected to the broader financial forecast.
File types:
Excel – Single-User: .xlsx
Excel – Multi-User: .xlsx
Similar ProductsOther customers were also interested in...


 HenrySheykin
Drug Rehab Clinic Financial Model Excel Template
The Drug and Alcohol Rehab Center Financial Model helps users turn a treatment facility concept into... Read more

Health Clinic Financial Model Excel Template
The Health Clinic Financial Model helps users build a structured financial forecast for a medical cl... Read more

Alcohol Treatment Center Financial Model Excel Tem...
The Drug and Alcohol Rehab Center Financial Model helps users turn a treatment facility concept into... Read more

Ayurveda Center Financial Model Excel Template
The Ayurvedic Consultation Service Financial Model helps entrepreneurs, practitioners, wellness foun... Read more

Acupuncture Center Financial Model Excel Template
The Acupuncture Clinic Financial Model helps users turn an acupuncture practice concept into a struc... Read more

 Giorgos
Speech Therapy Center – 5 Year Financial Model
Financial Model providing an advanced 5-year financial plan for a startup or operating Speech Therap... Read more
Medical Practice Financial Model Excel Template
The Medical Practice Financial Model helps users turn a clinic concept, expansion plan, or healthcar... Read more
Dental Practice Financial Model Excel Template
The Dental Clinic Financial Model helps users turn a dental practice concept, launch plan, or expans... Read more

Ambulatory Surgical Center Financial Model Excel T...
The Ambulatory Surgery Center Financial Model helps founders, healthcare operators, consultants, ana... Read more

Clinic Financial Model Excel Template
The Healthcare Clinic Financial Model helps founders, clinic owners, consultants, analysts, and busi... Read more
You must log in to submit a review.