
0 ITEMS

Music Subscription Service Financial Model Excel Template
The Music Subscription Service Financial Model helps founders, entrepreneurs, consultants, analysts, and business planners turn a music streaming or subscription audio concept into a structured financial forecast. Instead of relying on rough estimates, users can model the economics of recurring subscription revenue, customer acquisition, pricing tiers, startup investment, operating expenses, payroll, cash flow, profitability, and funding requirements in one organized template. It is built for planning a new launch, refining an existing concept, preparing investor materials, or evaluating whether a digital music platform can scale profitably over time. This financial model template is especially useful for anyone building a business plan for a music subscription service with multiple membership tiers, recurring monthly billing, marketing-driven subscriber growth, content costs, technology infrastructure, and staffing needs. The model gives users a practical framework for testing assumptions such as subscriber volume, pricing, conversion rates, customer acquisition cost, plan mix, royalty or licensing costs, payroll, and other operating expenses. By connecting these assumptions to forecasted revenue, profit, and cash flow, the template helps users understand how strategic decisions affect the financial outlook of the business. The template supports financial planning and decision-making by showing how the service may perform over a multi-year period. Users can review projected profitability, assess cash flow timing, estimate startup costs, evaluate payback, and understand break-even analysis before committing capital or presenting the opportunity to stakeholders. It is designed to save time compared with building a model from scratch while still remaining fully editable, so the assumptions can be customized to match a specific market, pricing strategy, launch plan, and growth roadmap. For funding discussions, internal planning, or client work, the Music Subscription Service Financial Model provides a professional way to communicate the business case. It helps users organize key financial statements, revenue assumptions, cost forecasts, operating metrics, and performance indicators into a format that is easier to review and present. Whether the goal is to raise capital, secure a loan, compare strategic scenarios, or make better operating decisions, this financial model template gives buyers a ready-to-use foundation for analyzing the financial potential of a subscription-based music platform.
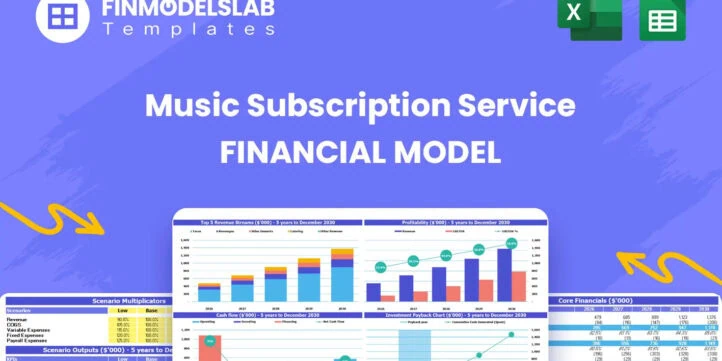


Financial Model Overview
The Music Subscription Service Financial Model is a ready-to-use financial model template designed to help users plan, forecast, and present the economics of a subscription-based music platform. It is built around the financial logic of recurring revenue, subscriber growth, pricing tiers, customer acquisition, content costs, technology infrastructure, payroll, and cash flow management. For a music subscription service, small changes in assumptions such as monthly pricing, plan mix, churn, conversion rates, customer acquisition cost, and royalty expenses can have a major impact on profitability.
This template brings those assumptions into a structured model so founders, business owners, consultants, analysts, and planning teams can evaluate the business before launch, expansion, or fundraising. It helps users replace scattered estimates with a connected forecast that can support business planning, funding discussions, budget reviews, and strategic decision-making.
All-in-One Dashboard
The all-in-one dashboard gives users a centralized view of the most important inputs and outputs in the Music Subscription Service Financial Model. It is designed to make the model easier to navigate by bringing core assumptions and headline results into one practical planning area. Inputs may include launch timing, pricing tiers, subscriber growth assumptions, customer acquisition cost, marketing spend, content cost percentages, staffing assumptions, tax rates, and other key drivers that shape the forecast.
Outputs may include total revenue, gross profit, EBITDA, net income, cash balance, funding needs, break-even timing, and return metrics. This component is useful because a music subscription service depends on many connected variables, and decision-makers need to see the overall picture without searching through every calculation tab. The dashboard helps users understand whether the plan is financially balanced, whether cash reserves remain sufficient, and whether the assumptions support a credible growth story for investors, lenders, internal teams, or strategic partners.
Low, Base, and High Scenario Analysis
The low, base, and high scenario analysis component allows users to compare how the music subscription service may perform under different business conditions. A base case can represent the expected operating plan, while the low case can test more conservative assumptions such as slower subscriber acquisition, lower trial-to-paid conversion, higher churn, higher content costs, or weaker pricing performance. The high case can test stronger outcomes such as improved marketing efficiency, faster family plan adoption, higher average revenue per user, lower customer acquisition cost, or stronger retention.
The component uses selected scenario assumptions to adjust the forecast and show how revenue, expenses, profitability, cash flow, and capital requirements change. This is useful for planning because subscription businesses are sensitive to growth and retention assumptions. By reviewing multiple outcomes, users can prepare for downside risk, identify the assumptions that matter most, set realistic targets, and present a more credible financial plan to investors or stakeholders who want to understand both opportunity and risk.
Professional Charts
The professional charts component converts the financial model’s outputs into clear visual reports that can be used for presentations, investor decks, stakeholder meetings, and internal planning reviews. These charts may visualize subscriber growth, revenue by period, gross margin, EBITDA, net income, monthly cash balance, funding requirements, break-even progress, and other key metrics that help explain the business model. For a music subscription service, visual reporting is valuable because the story often depends on recurring revenue growth, improving unit economics, and the transition from early investment to scalable profitability.
Charts make it easier to communicate how pricing tiers, customer acquisition, retention, and cost control work together over time. This section helps users avoid presenting only raw spreadsheet numbers and instead creates a more polished view of the forecast. It can support investor conversations, loan applications, board updates, and management discussions by making trends easier to understand and by highlighting the financial milestones that matter most.
ROE Components and DuPont Analysis
The ROE components and DuPont analysis section helps users evaluate return on equity by breaking it into the underlying drivers of profitability, efficiency, and leverage. Instead of looking at return on equity as one isolated result, this component helps explain why the return is changing and which parts of the business are influencing it. Inputs and linked outputs may include net profit margin, asset turnover, equity multiplier, net income, total assets, shareholders’ equity, and related balance sheet assumptions.
For a music subscription service, this is helpful because growth often requires upfront investment in technology, marketing, content acquisition, and platform infrastructure before the business reaches full operating efficiency. DuPont analysis can show whether improved ROE is coming from better margins, stronger use of assets, or changes in financing structure. This makes the model more useful for investors and analysts who want to understand not only whether the business can generate returns, but how those returns are created and sustained over time.
Revenue Inputs
The revenue inputs component gives users a structured area to define the assumptions that drive subscription income. For a music subscription service, this may include monthly pricing for individual, family, and student plans, expected subscriber acquisition, plan mix, conversion rates, churn assumptions, trial periods, marketing spend, customer acquisition cost, and growth rates over the forecast period. The template can use these assumptions to estimate monthly recurring revenue, annual recurring revenue, subscriber counts, average revenue per user, and revenue growth over time.
This section is especially important because recurring revenue models depend heavily on the relationship between pricing, acquisition, retention, and customer mix. A plan that looks profitable under one set of revenue assumptions may become unrealistic if CAC rises, conversion weakens, or lower-priced plans make up too much of the subscriber base. By making these inputs clear and editable, the model helps users test the commercial strategy, validate targets, and create a more defensible revenue forecast for planning or fundraising.
Bank-Ready Reports
The bank-ready reports component organizes forecast outputs into a format that can support lender review, financing discussions, and professional business planning. These reports may include projected income statements, cash flow statements, balance sheets, debt assumptions, repayment capacity, profit summaries, liquidity metrics, and other financial outputs that lenders commonly review. For a music subscription service, bank or lender discussions may focus on whether the business can generate stable recurring revenue, maintain enough cash to cover operating commitments, and support any debt or working capital facility.
This component helps users present the forecast in a cleaner, more lender-friendly structure instead of relying on disconnected calculations. It can support applications for startup financing, technology investment funding, working capital lines, or expansion capital. The value of this section is that it translates the model into professional reports that show revenue, costs, profitability, cash position, and financial sustainability in a way that is easier for external reviewers to assess.
Revenue Breakdown
The revenue breakdown component provides a more detailed view of income by revenue stream, plan type, or subscription category. For a music subscription service, this can include individual plan subscriptions, family plan subscriptions, student plan subscriptions, and any other recurring or ancillary revenue streams the user chooses to add. Inputs may include pricing, subscriber counts, plan mix percentages, growth rates, churn, upgrades, downgrades, and timing assumptions. Outputs can show how each plan contributes to total revenue, how revenue composition changes over time, and which customer segments drive the most financial value.
This is useful because a subscription platform may grow total subscribers while still producing weaker revenue if too many users are concentrated in lower-priced plans. A detailed revenue breakdown helps users understand the quality of growth, identify the most valuable plans, and decide where to focus marketing, partnerships, pricing tests, or retention efforts. It also makes the financial plan more transparent for investors and business partners.
KPI Dashboard
The KPI dashboard focuses on the operating metrics that help users evaluate the health and scalability of the music subscription service. These metrics may include customer acquisition cost, average revenue per user, subscriber growth, churn, lifetime value, LTV to CAC ratio, gross margin, contribution margin, monthly recurring revenue, annual recurring revenue, burn rate, cash runway, and benchmark comparisons. For a subscription business, traditional financial statements are important, but operating KPIs often explain the future potential of the model more clearly.
This component helps users monitor whether the business is acquiring customers efficiently, retaining subscribers, generating enough value per user, and improving profitability as it scales. It can also help compare performance against industry expectations or internal targets. By reviewing KPIs alongside the financial forecast, users can make better decisions about marketing spend, pricing, onboarding, content investment, and growth strategy. The KPI dashboard is particularly useful for investor updates, management reviews, and ongoing performance tracking.
Startup and Operating Cost Planning
The startup and operating cost planning component helps users estimate the full financial commitment required to launch and run the music subscription service. Startup costs may include platform development, app or web product design, content management system customization, server infrastructure setup, licensing preparation, legal fees, branding, launch marketing, payment systems, office setup, and initial working capital. Operating expenses may include monthly technology hosting, content royalties or licensing costs, customer support, software subscriptions, marketing, payroll, contractor costs, administrative expenses, insurance, and professional services.
The model can separate one-time startup costs from ongoing fixed and variable expenses, helping users understand both initial funding needs and monthly cost structure. This is useful because subscription businesses often require meaningful upfront spending before revenue stabilizes. A clear cost plan helps prevent undercapitalization, supports budget control, and allows founders to assess whether the business can reach profitability before cash runs short. It also provides a practical basis for funding requests and operating plans.
Cash Flow and Break-Even Forecast
The cash flow and break-even forecast component helps users understand when the music subscription service can cover its costs and whether the business has enough liquidity to operate through the early growth stage. Inputs may include revenue collections, payment timing, startup costs, operating expenses, payroll, marketing spend, content costs, taxes, capital expenditures, financing proceeds, loan repayments, and minimum cash balance assumptions.
Outputs may include monthly cash inflows, cash outflows, ending cash balance, cash runway, funding gaps, and the estimated break-even month. This component is valuable because a subscription service can show attractive long-term revenue potential while still facing short-term cash pressure from customer acquisition, technology development, and content expenses. The break-even view helps users identify the point at which revenue is sufficient to cover fixed and variable costs, while the cash flow forecast shows whether additional funding is needed before that point. Together, they support better decisions about launch timing, fundraising, marketing pace, expense control, and growth strategy.
File types:
Excel – Single-User: .xlsx
Excel – Multi-User: .xlsx
Similar ProductsOther customers were also interested in...


 HenrySheykin
Online Services Marketplace Financial Model Excel ...
The Online Services Marketplace Financial Model helps founders, entrepreneurs, consultants, analysts... Read more
Fashion Marketplace Financial Model Excel Template
The Fashion Retail Financial Model helps entrepreneurs, founders, business owners, consultants, and ... Read more

General Marketplace Financial Model Excel Template
The General Marketplace Financial Model Financial Model Template helps users plan, evaluate, and pre... Read more
Etsy & Ebay Store Financial Model Excel Templa...
The Etsy and eBay Store Financial Model helps marketplace sellers, founders, consultants, and busine... Read more

Toys Marketplace Financial Model Excel Template
The Toy Marketplace Financial Model Template helps founders, entrepreneurs, consultants, analysts, a... Read more
Information Marketplace Financial Model Excel Temp...
The Digital Products Marketplace Financial Model helps founders, entrepreneurs, consultants, analyst... Read more

Books Marketplace Financial Model Excel Template
The Bookstore Financial Model helps entrepreneurs, bookstore owners, consultants, analysts, and busi... Read more
Online Coaching Marketplace Financial Model Excel ...
The Online Coaching Platform Financial Model helps founders, entrepreneurs, consultants, analysts, a... Read more

Kickstarter Marketplace Financial Model Excel Temp...
The Crowdfunding Marketplace Financial Model helps founders, entrepreneurs, analysts, consultants, a... Read more

Airbnb Marketplace Financial Model Excel Template
The Airbnb Business Financial Model helps users turn a short-term rental or vacation rental concept ... Read more
You must log in to submit a review.