
0 ITEMS

Arts, Crafts And Gifts Marketplace Financial Model Excel Template
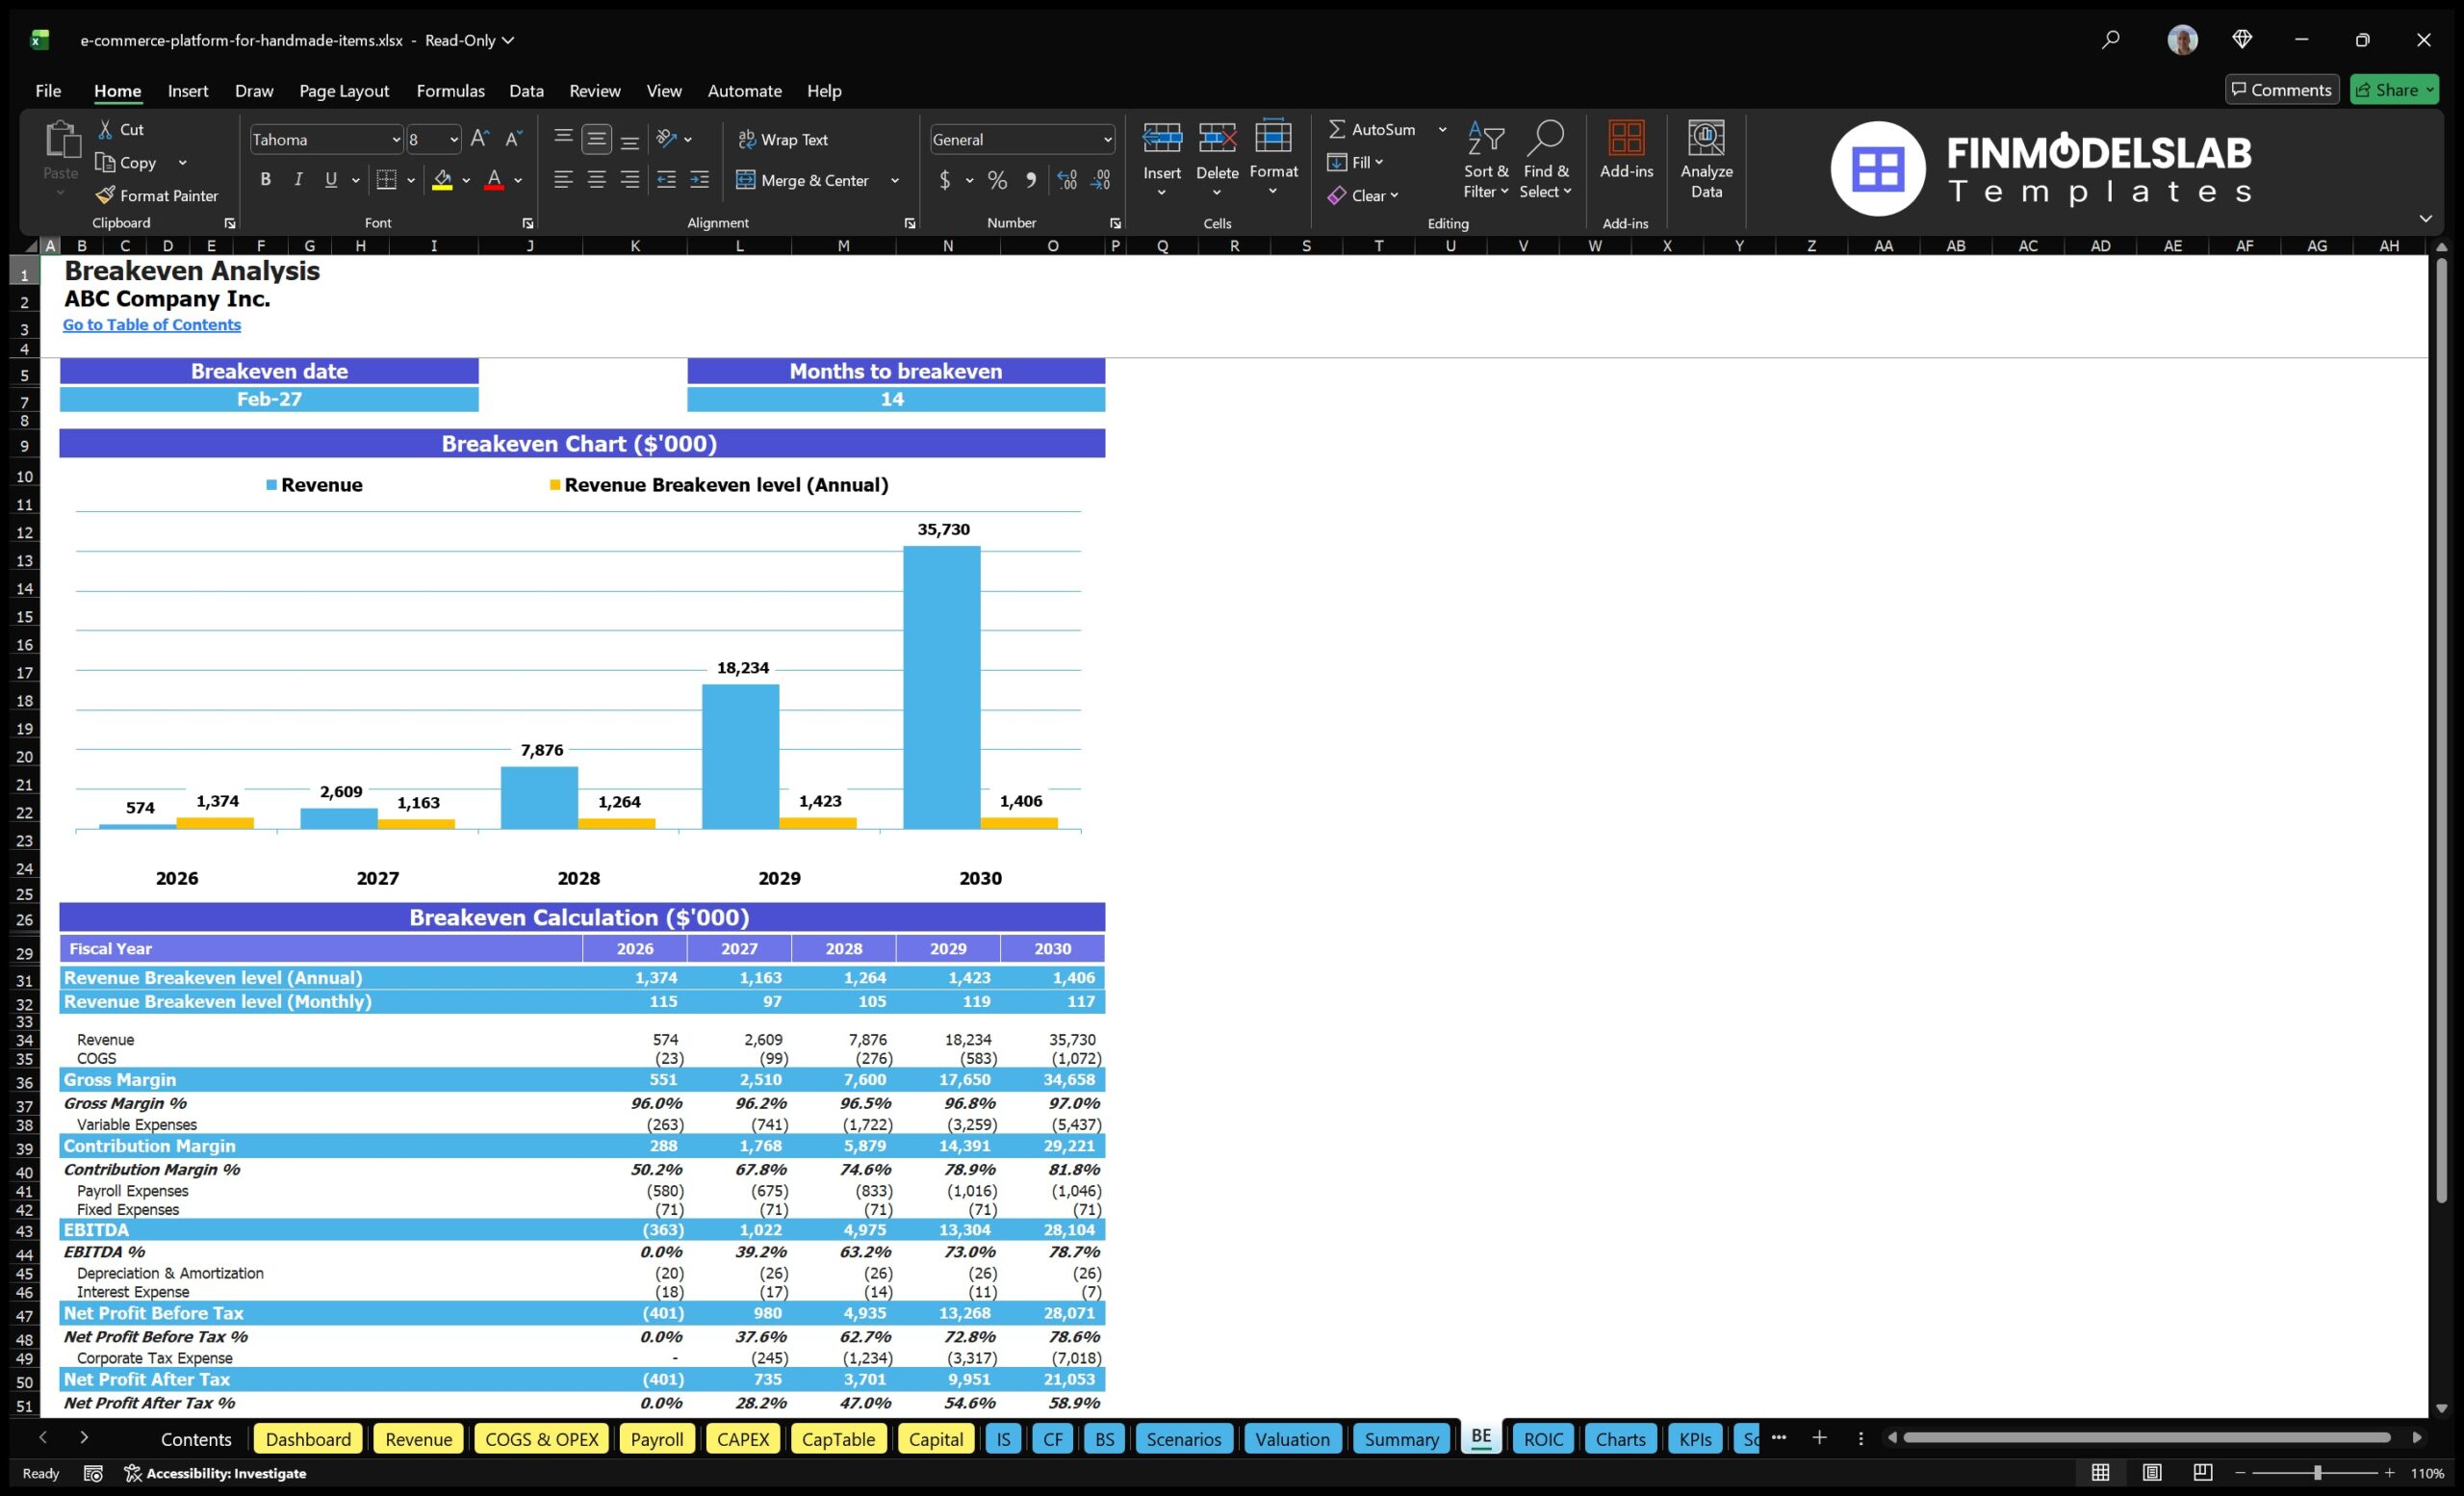
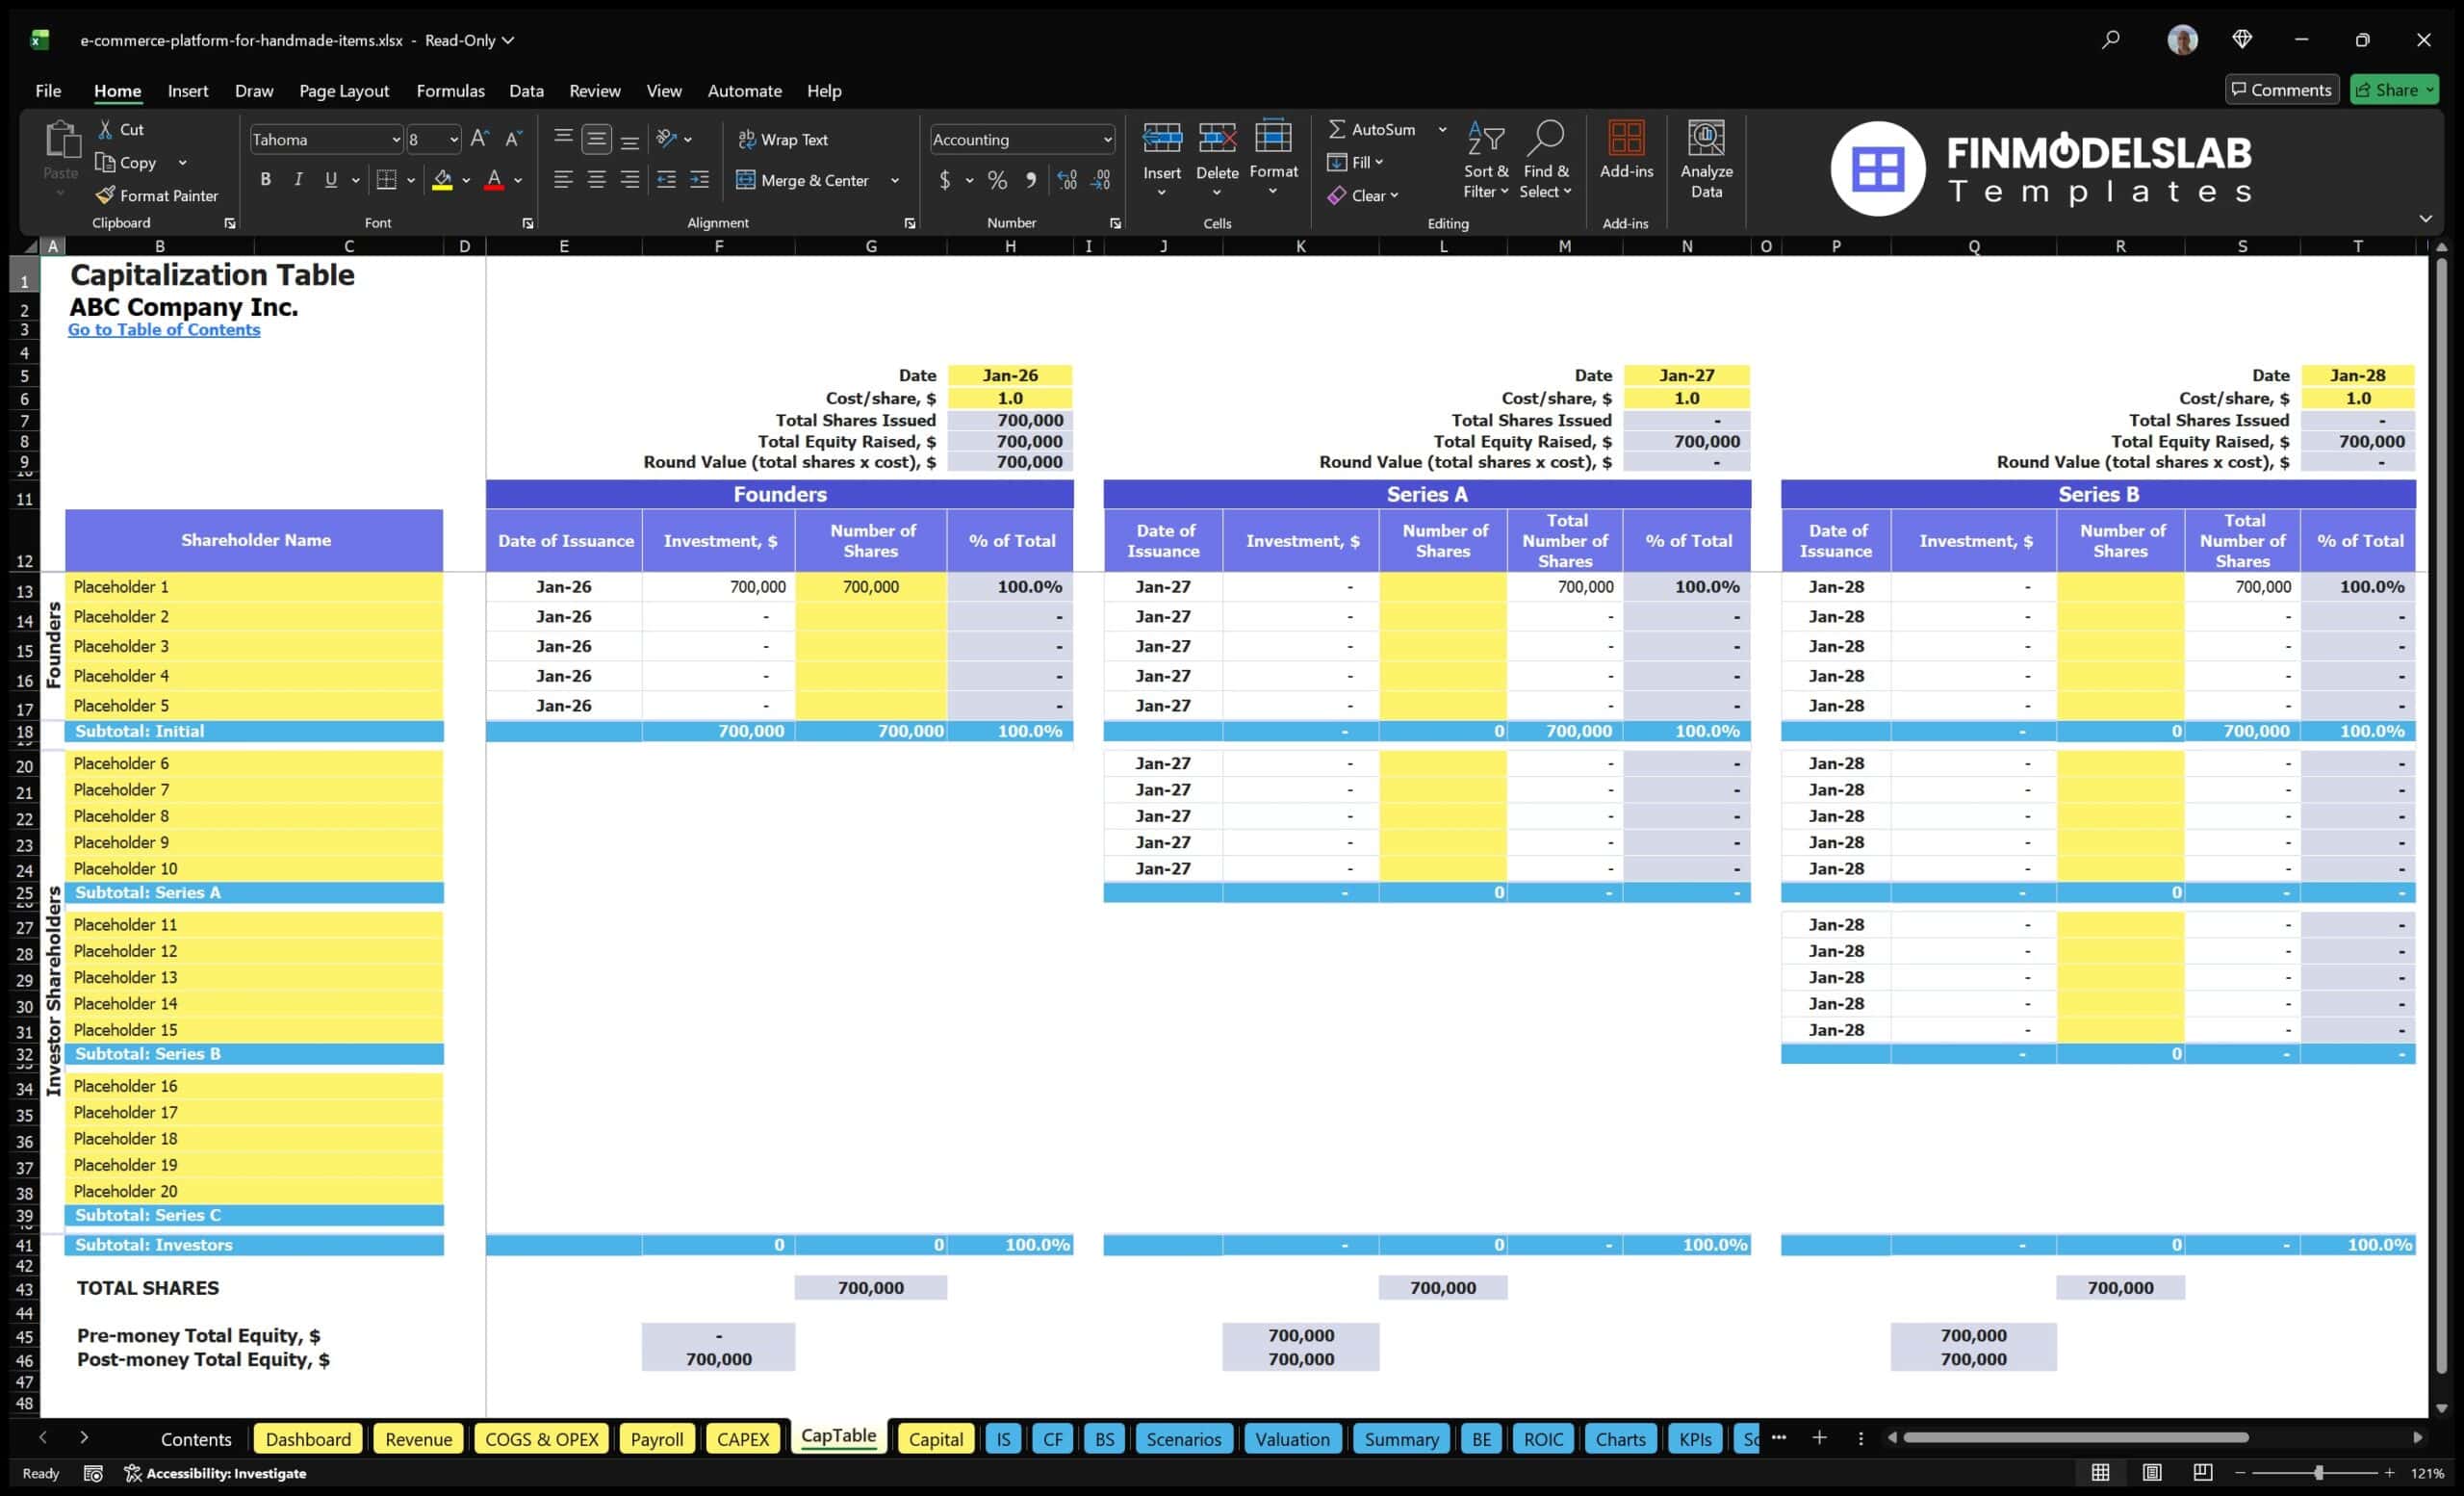
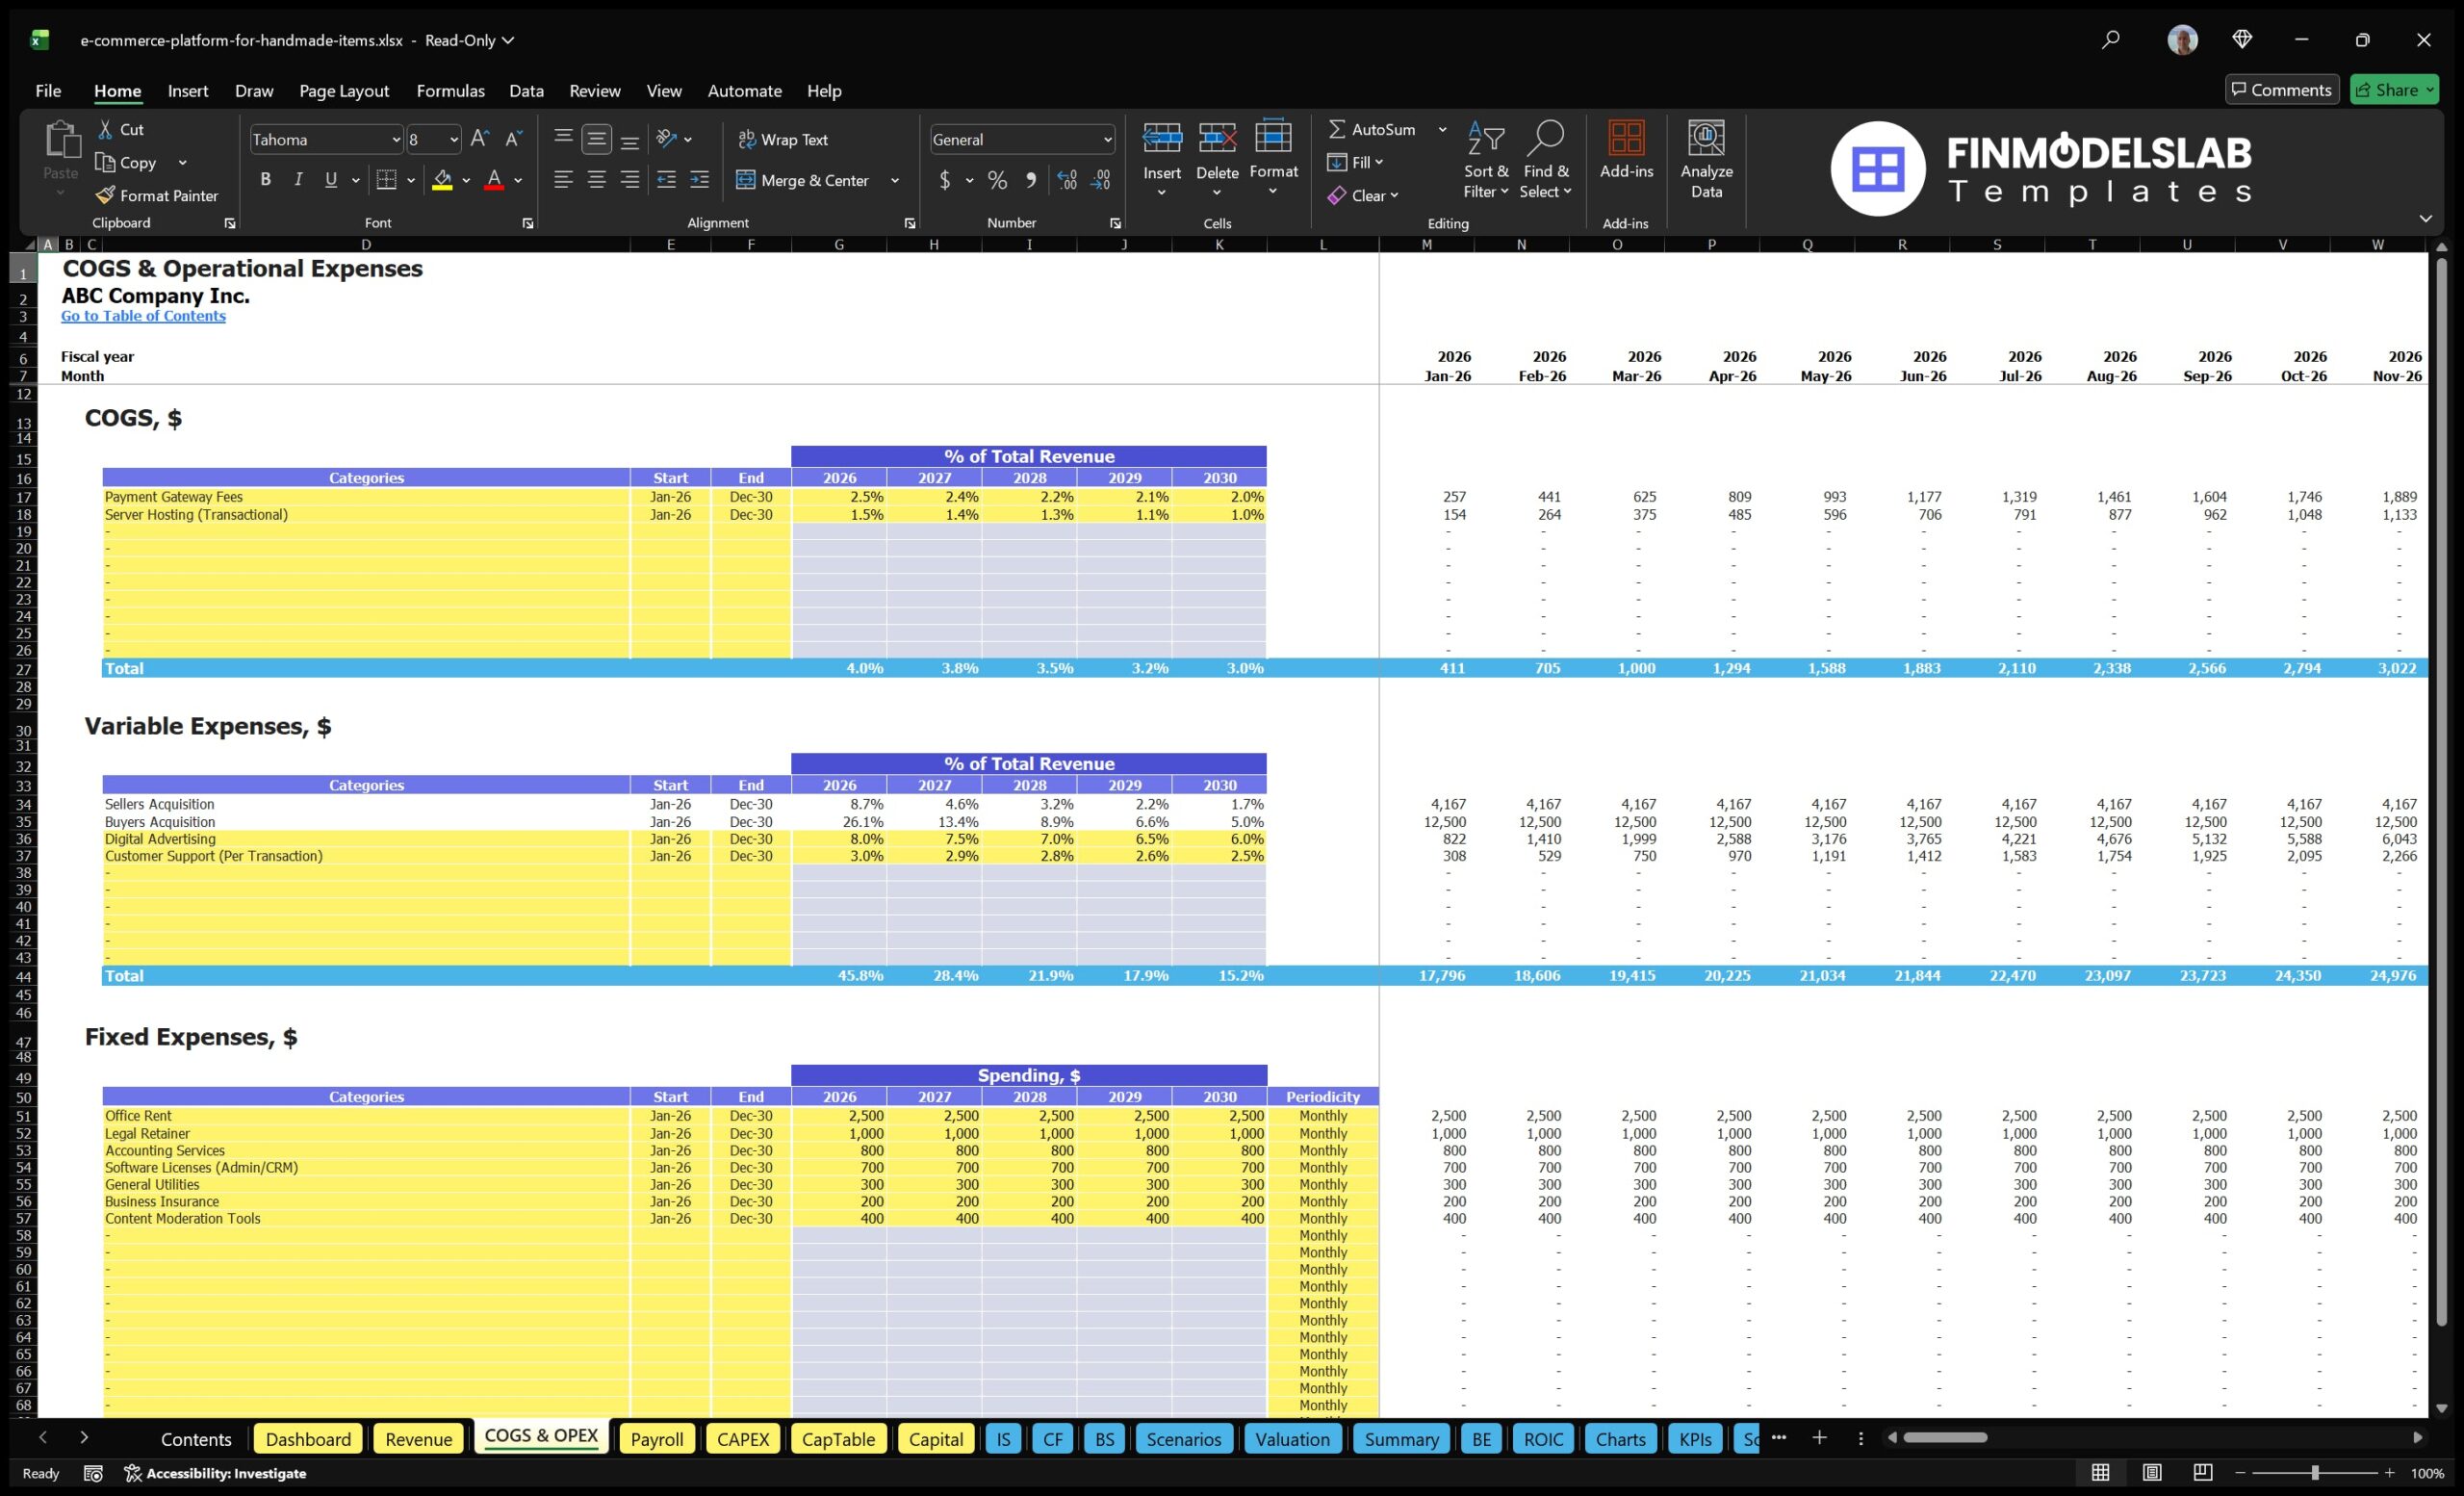
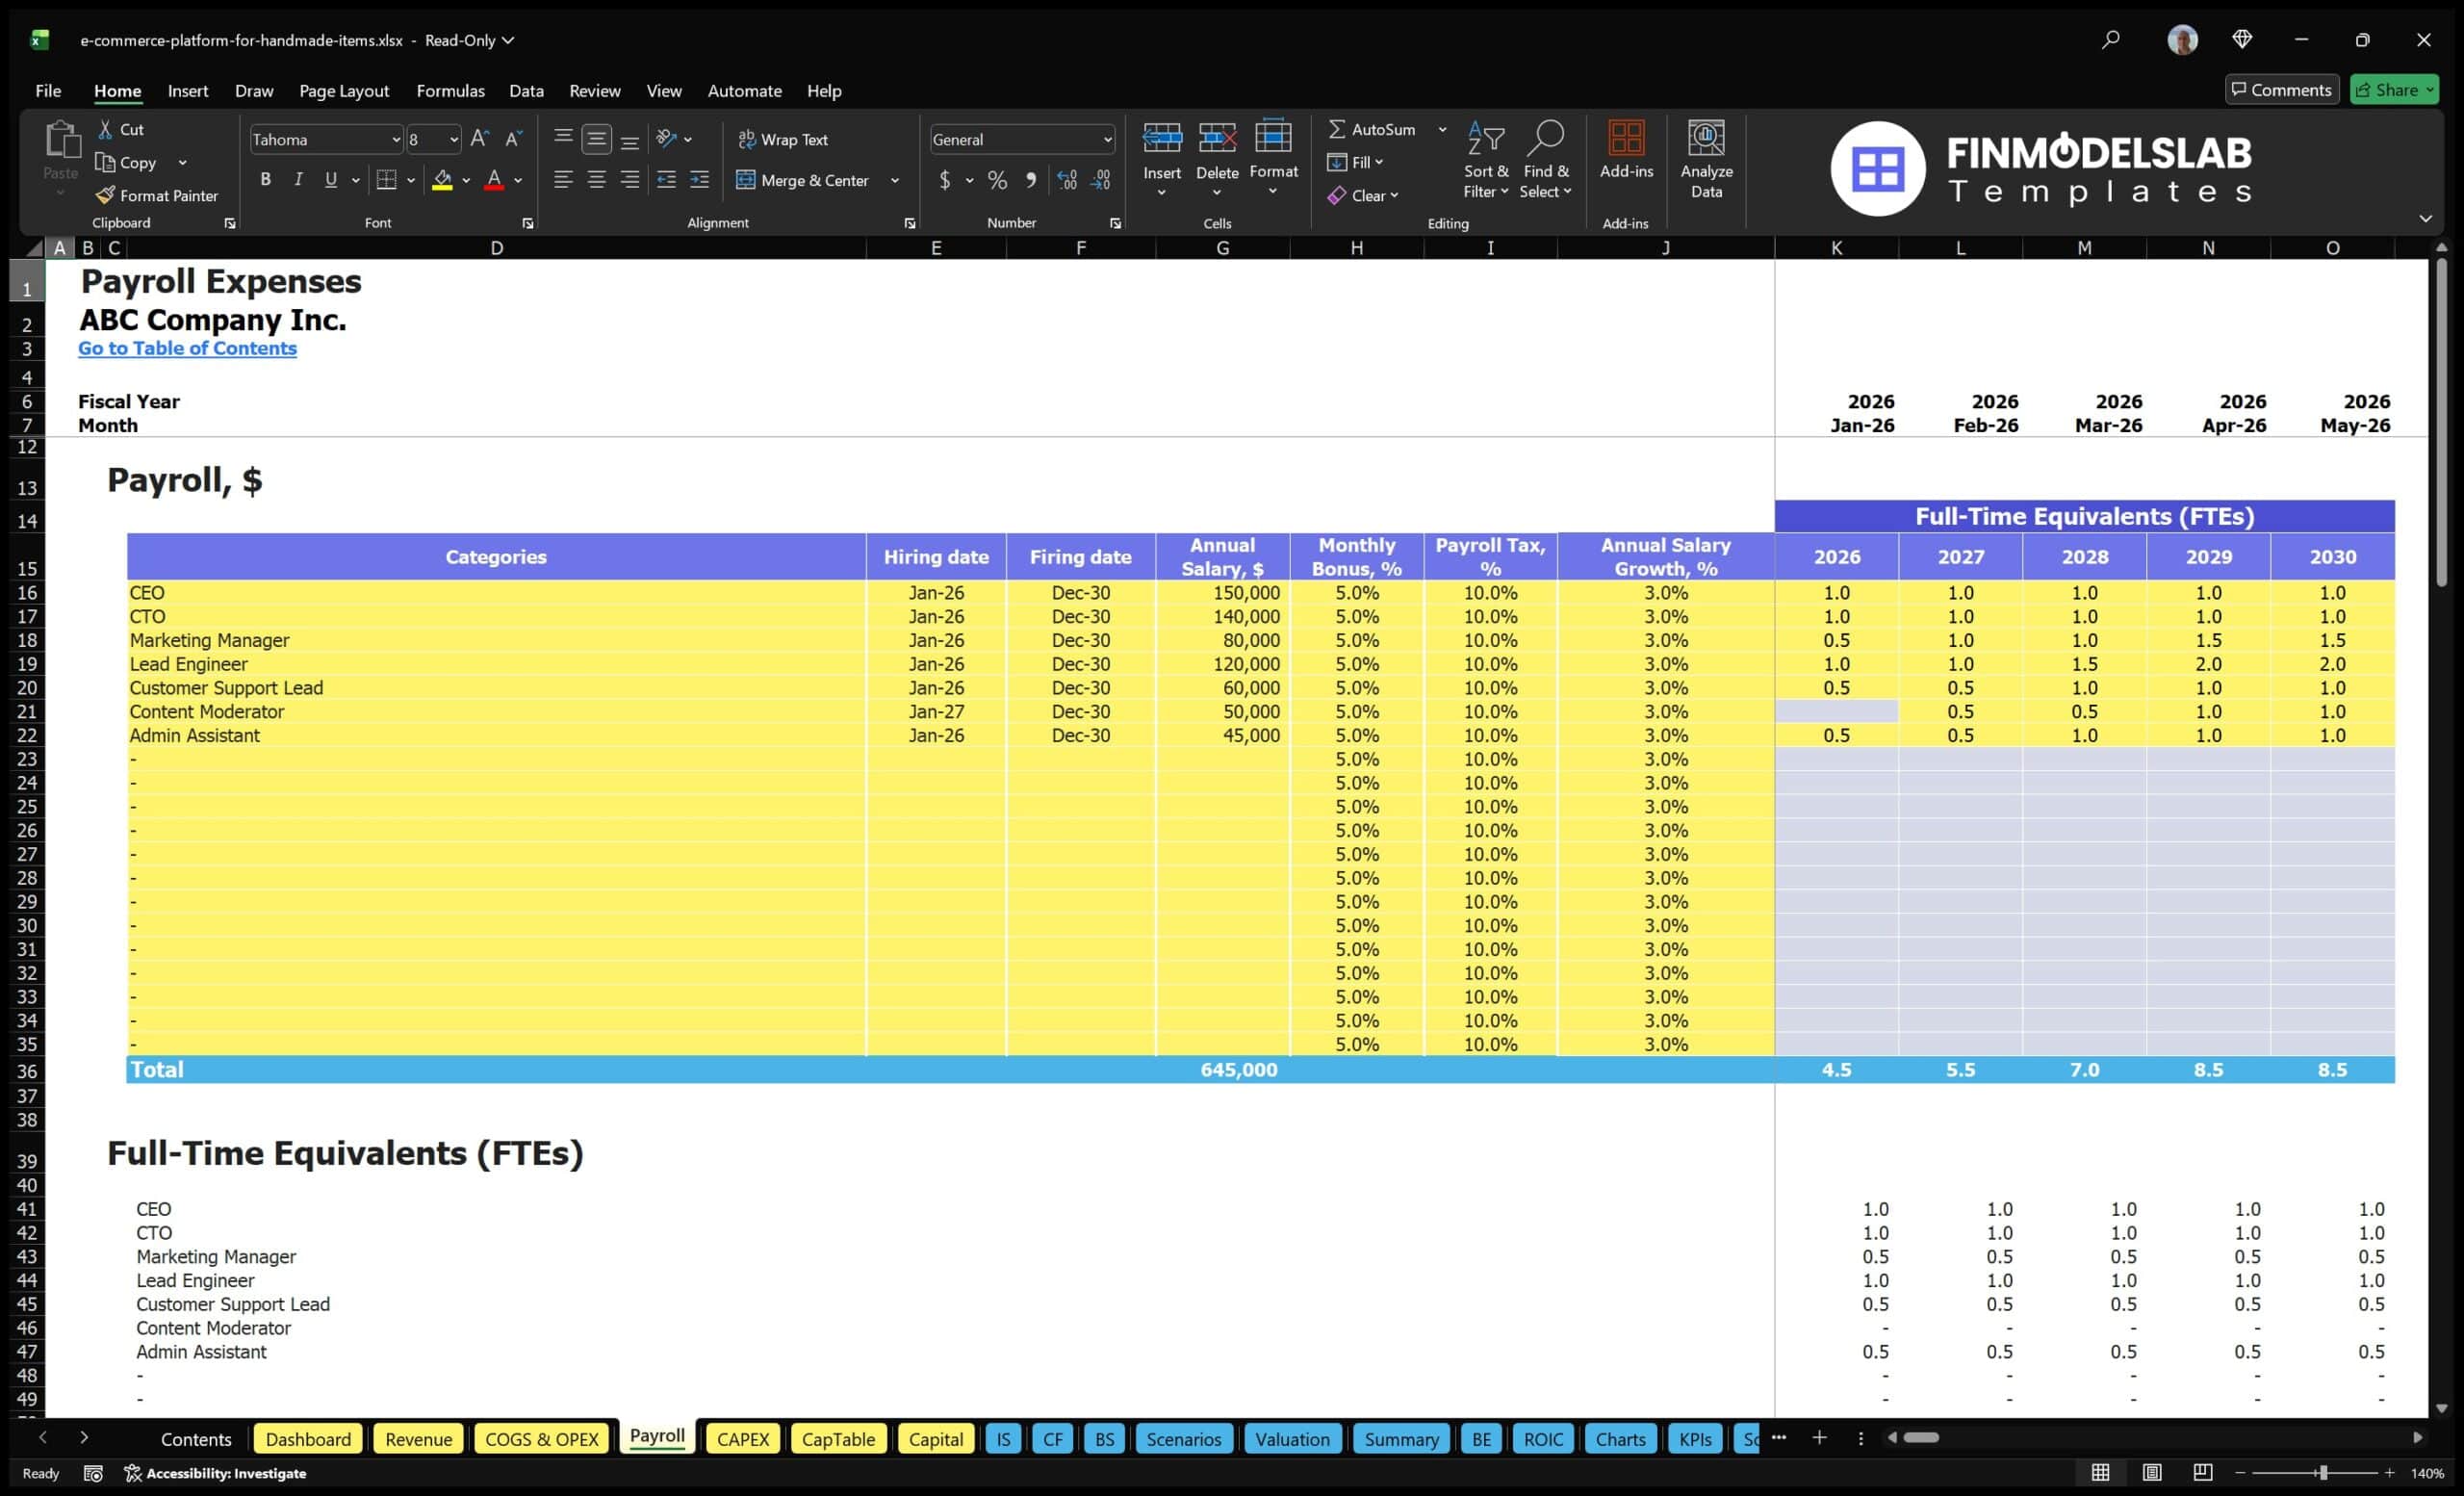
The Handmade Goods Marketplace Financial Model helps founders, entrepreneurs, consultants, and analysts turn an artisan e-commerce concept into a structured financial forecast. Instead of relying on a rough spreadsheet, users can plan how a marketplace for handmade products may perform across buyer growth, seller acquisition, order volume, average order value, transaction commissions, subscriptions, seller services, operating expenses, payroll, cash flow, and profitability. The template is designed to support business planning, funding preparation, internal budgeting, and decision-making for a marketplace that connects makers, artists, crafters, and shoppers. This financial model template gives users a practical way to document assumptions and understand how the business can scale over time. It brings together revenue assumptions, startup costs, staffing plans, operating expenses, cash flow projections, profitability analysis, and investor-ready outputs in one editable model. Users can adjust take rates, subscription pricing, customer acquisition costs, seller service fees, salaries, marketing budgets, technology costs, and other key inputs to reflect their own strategy. The result is a clearer view of how changes in pricing, user growth, and cost structure can affect profit, funding needs, and long-term sustainability. Built for both early-stage planning and stakeholder presentation, the template helps users evaluate whether the marketplace can generate enough Gross Merchandise Value, commission revenue, and recurring fees to support platform development, marketing, support, moderation, and administration. It is useful for preparing business plans, investor discussions, lender submissions, pitch materials, and operational budgets. The model also helps identify the timing of cash flow pressure, the level of startup capital required, and the point where the business may reach break-even. The Handmade Goods Marketplace Financial Model is fully editable and can be used in Microsoft Excel or Google Sheets, making it accessible for non-financial users while still detailed enough for professional review. By working from a ready-made structure, users save time, reduce spreadsheet complexity, and make more confident decisions about launch timing, funding, hiring, marketing investment, and growth strategy. It is a practical planning tool for anyone building, financing, or advising an online handmade goods marketplace.
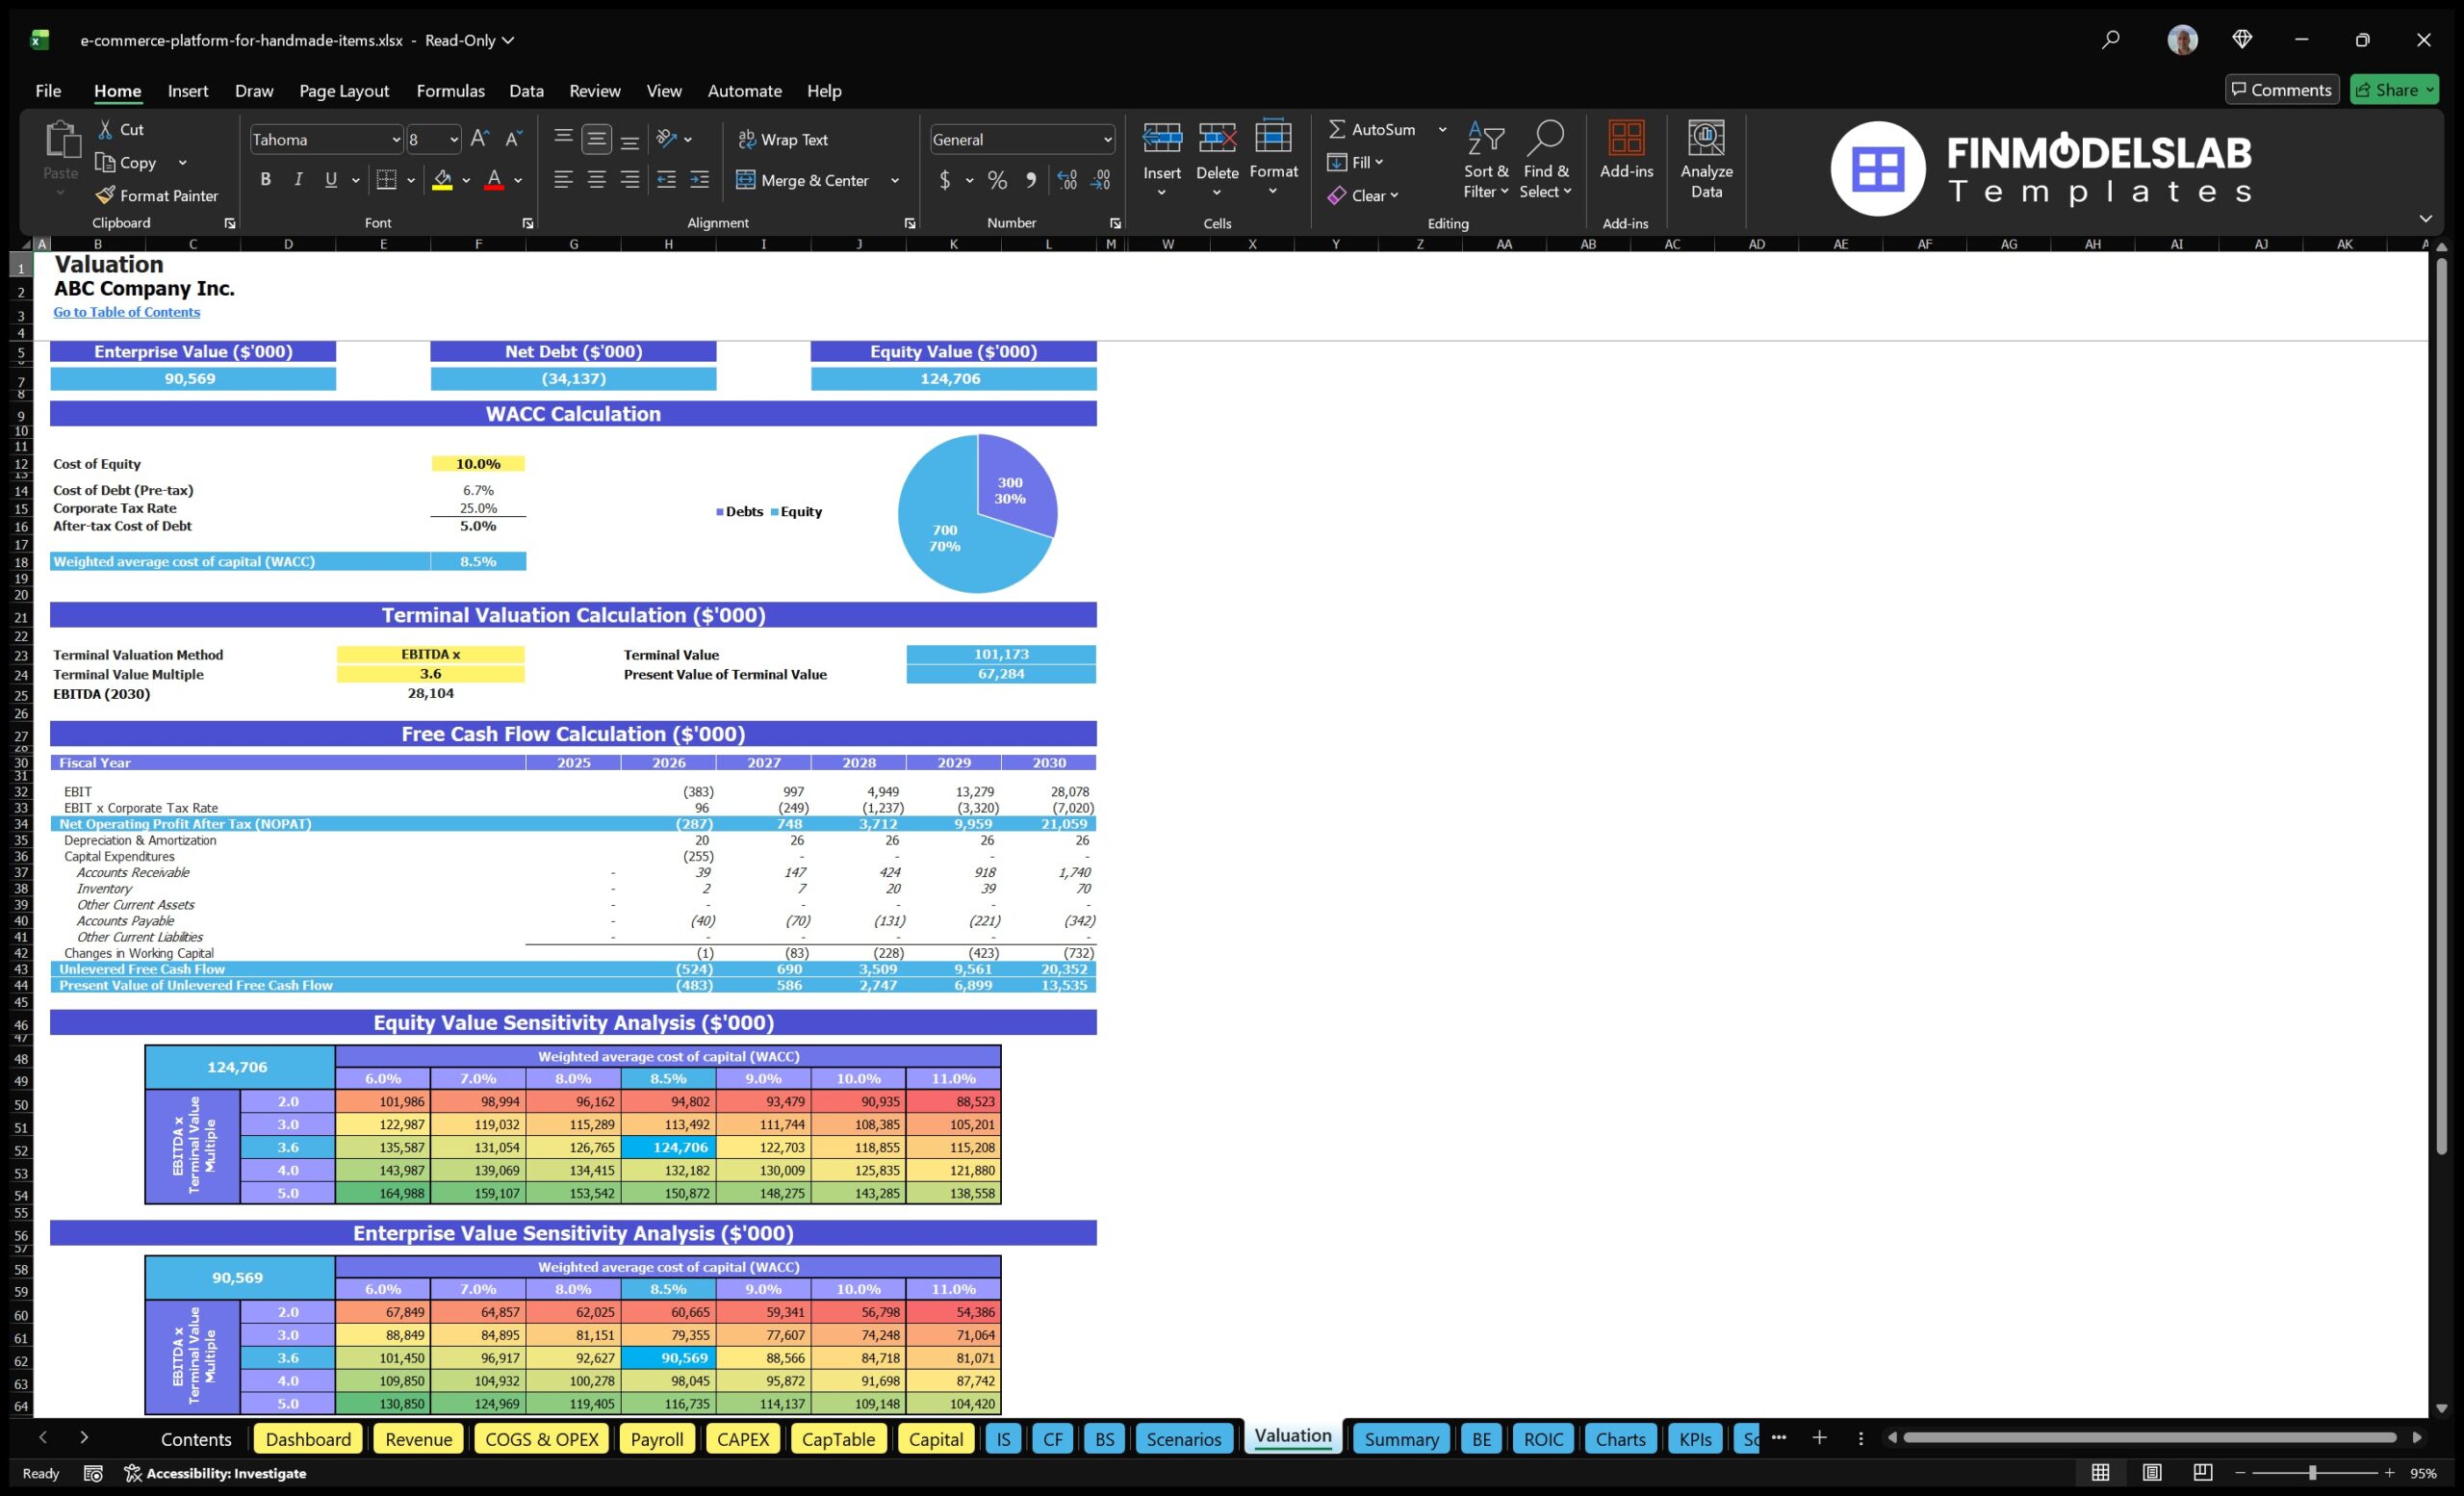
Financial Model Overview
The Handmade Goods Marketplace Financial Model is a ready-to-use financial model template designed for planning, launching, funding, and managing an online marketplace for handmade products, artisan goods, craft items, and independent seller storefronts. It helps users translate marketplace assumptions into a structured five-year forecast covering revenue, costs, cash flow, profitability, investment needs, and performance metrics. For a handmade goods marketplace, the numbers depend on several connected drivers, including active buyers, active sellers, average order value, order frequency, commission rates, subscriptions, promoted listings, platform costs, marketing spend, payroll, and working capital. This template brings those drivers into one editable model so founders, business owners, consultants, analysts, and planning teams can test assumptions, prepare investor-ready financial outputs, and make better decisions before committing capital or scaling operations.
All-in-One Dashboard
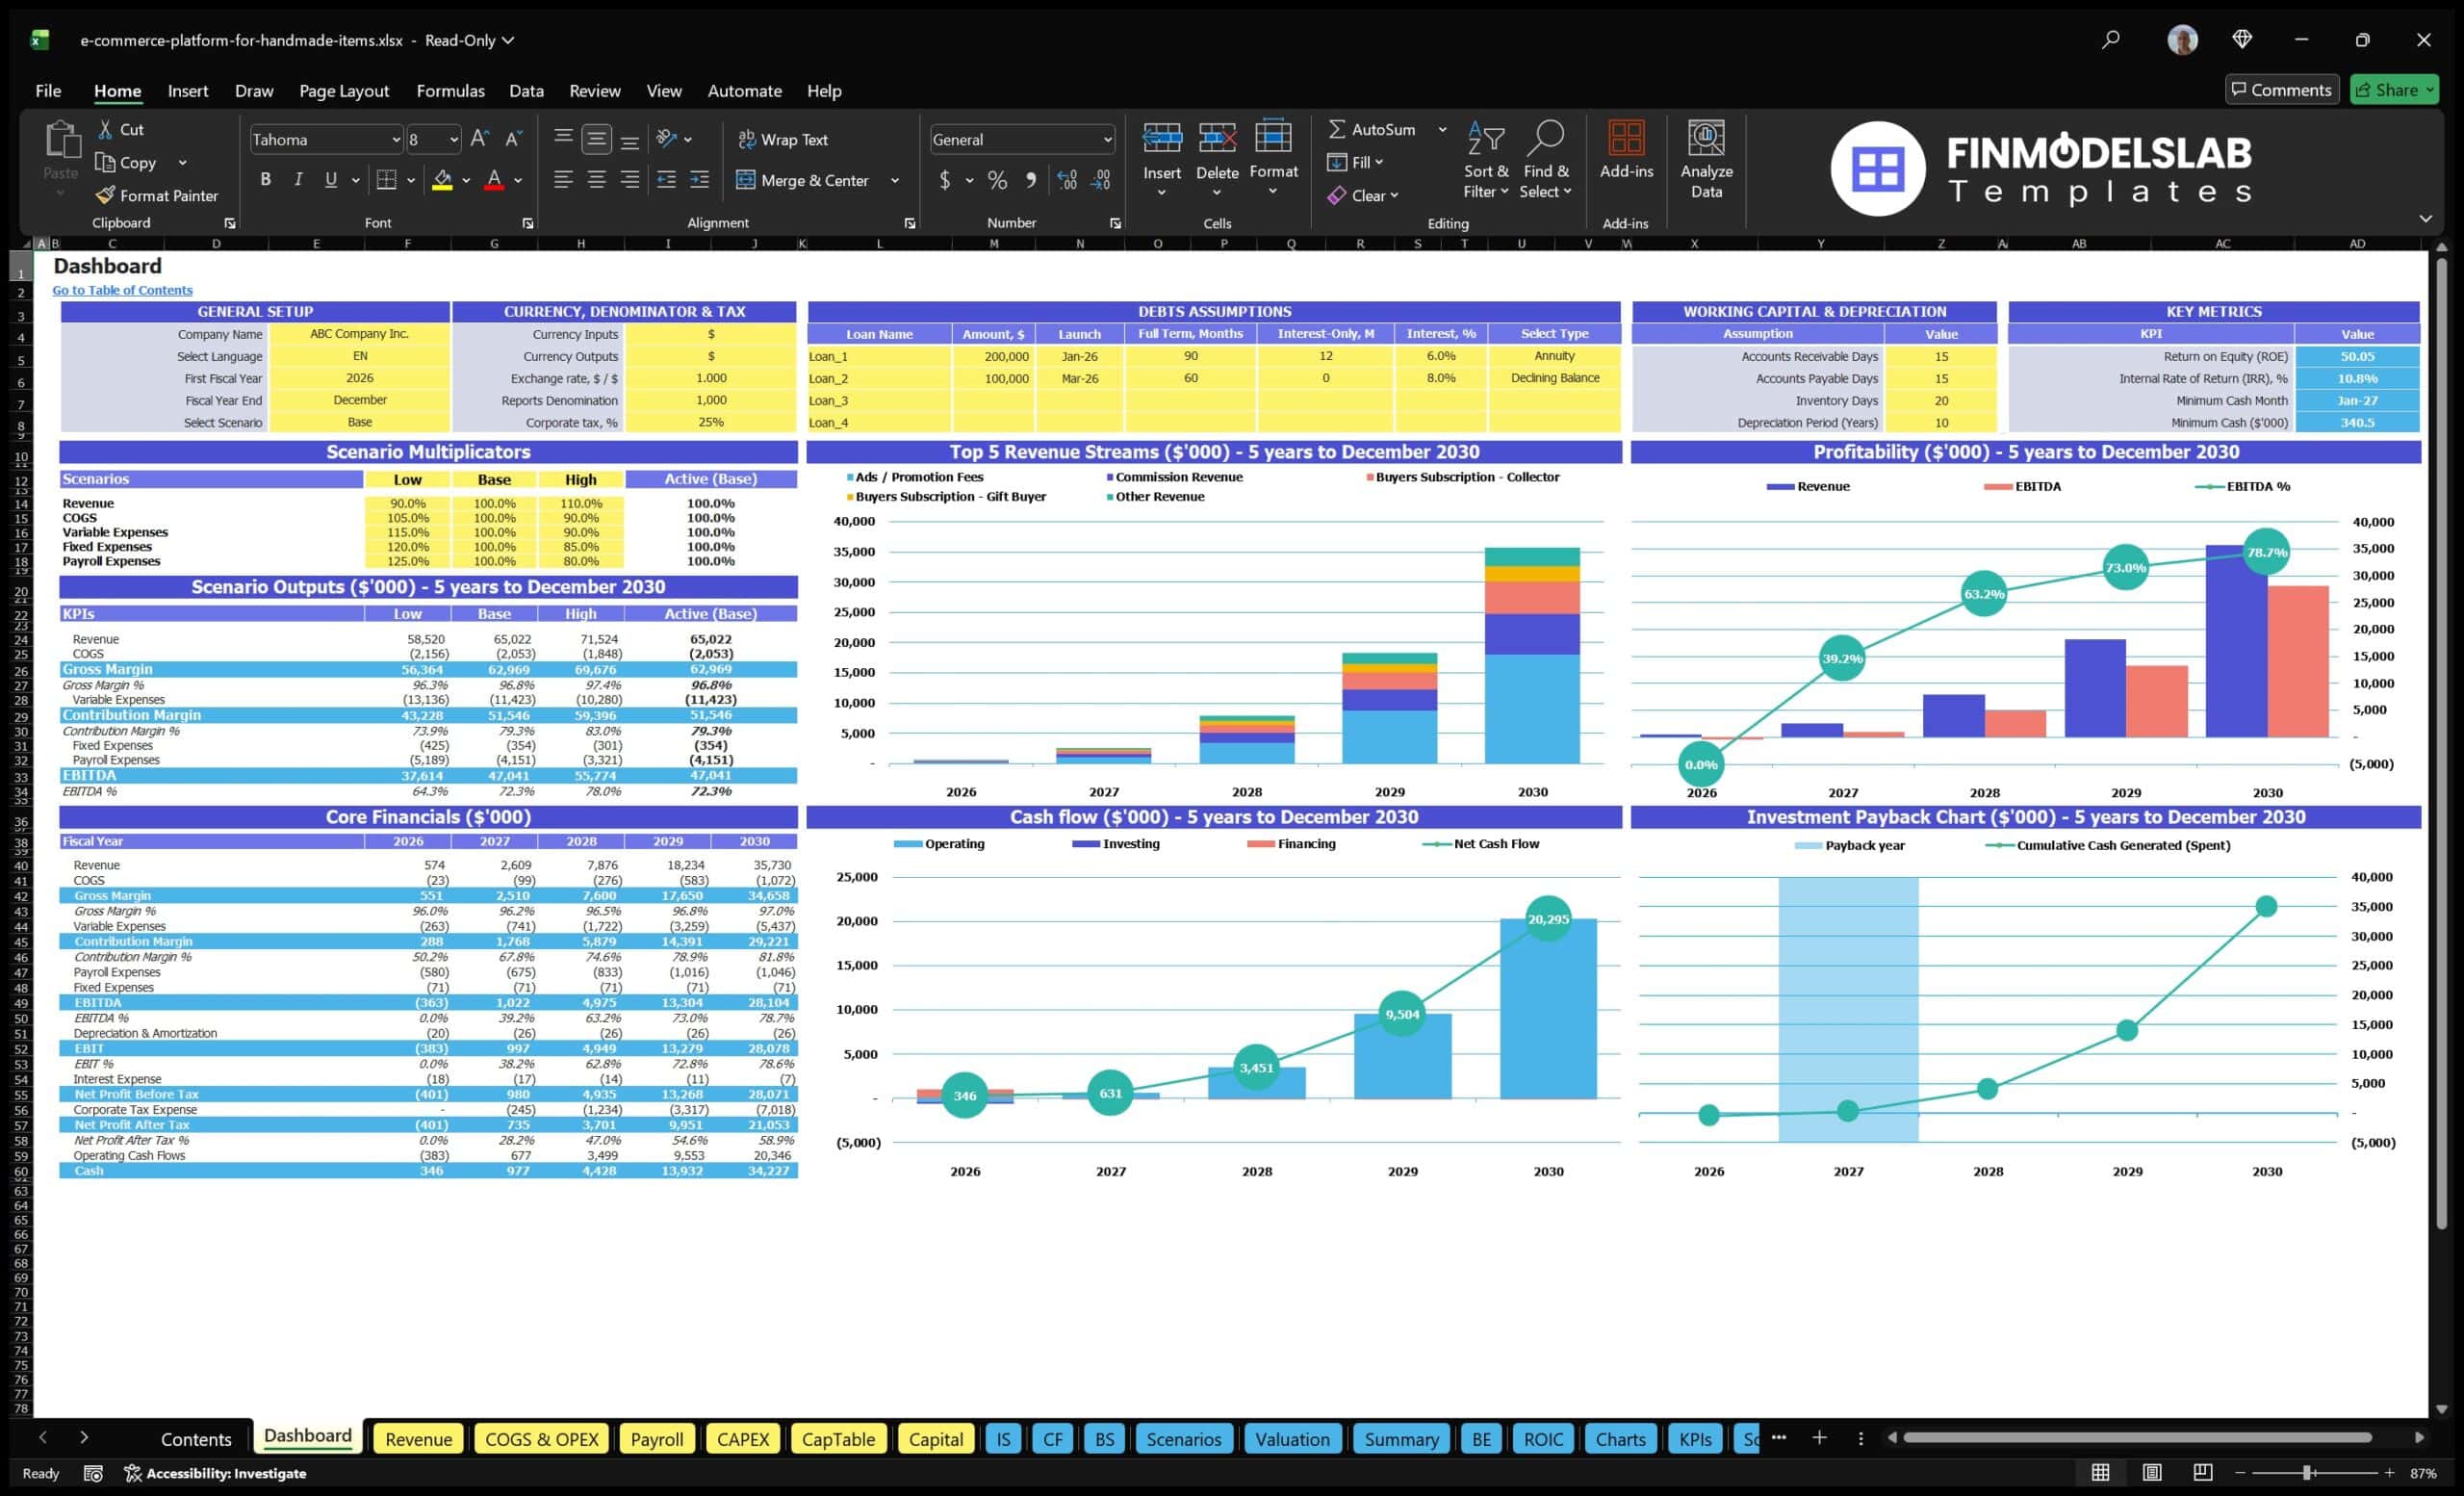
The all-in-one dashboard gives users a central place to view the core inputs and core outputs of the Handmade Goods Marketplace Financial Model. It is designed to summarize the most important assumptions and financial results without requiring users to search through multiple tabs or calculations. Inputs may include marketplace launch timing, commission rates, seller subscription pricing, buyer subscription assumptions, average order value, user growth, customer acquisition costs, payroll timing, operating expense categories, and startup investment amounts. Outputs may include revenue, Gross Merchandise Value, EBITDA, net income, cash balance, funding needs, and profitability trends. This component is useful because marketplace businesses involve many moving parts, and a consolidated dashboard helps users see how the main assumptions connect to the financial forecast. It can support quick reviews, internal planning sessions, investor discussions, and monthly updates by turning a complex financial model into a clear management summary.
Low, Base, and High Scenario Analysis
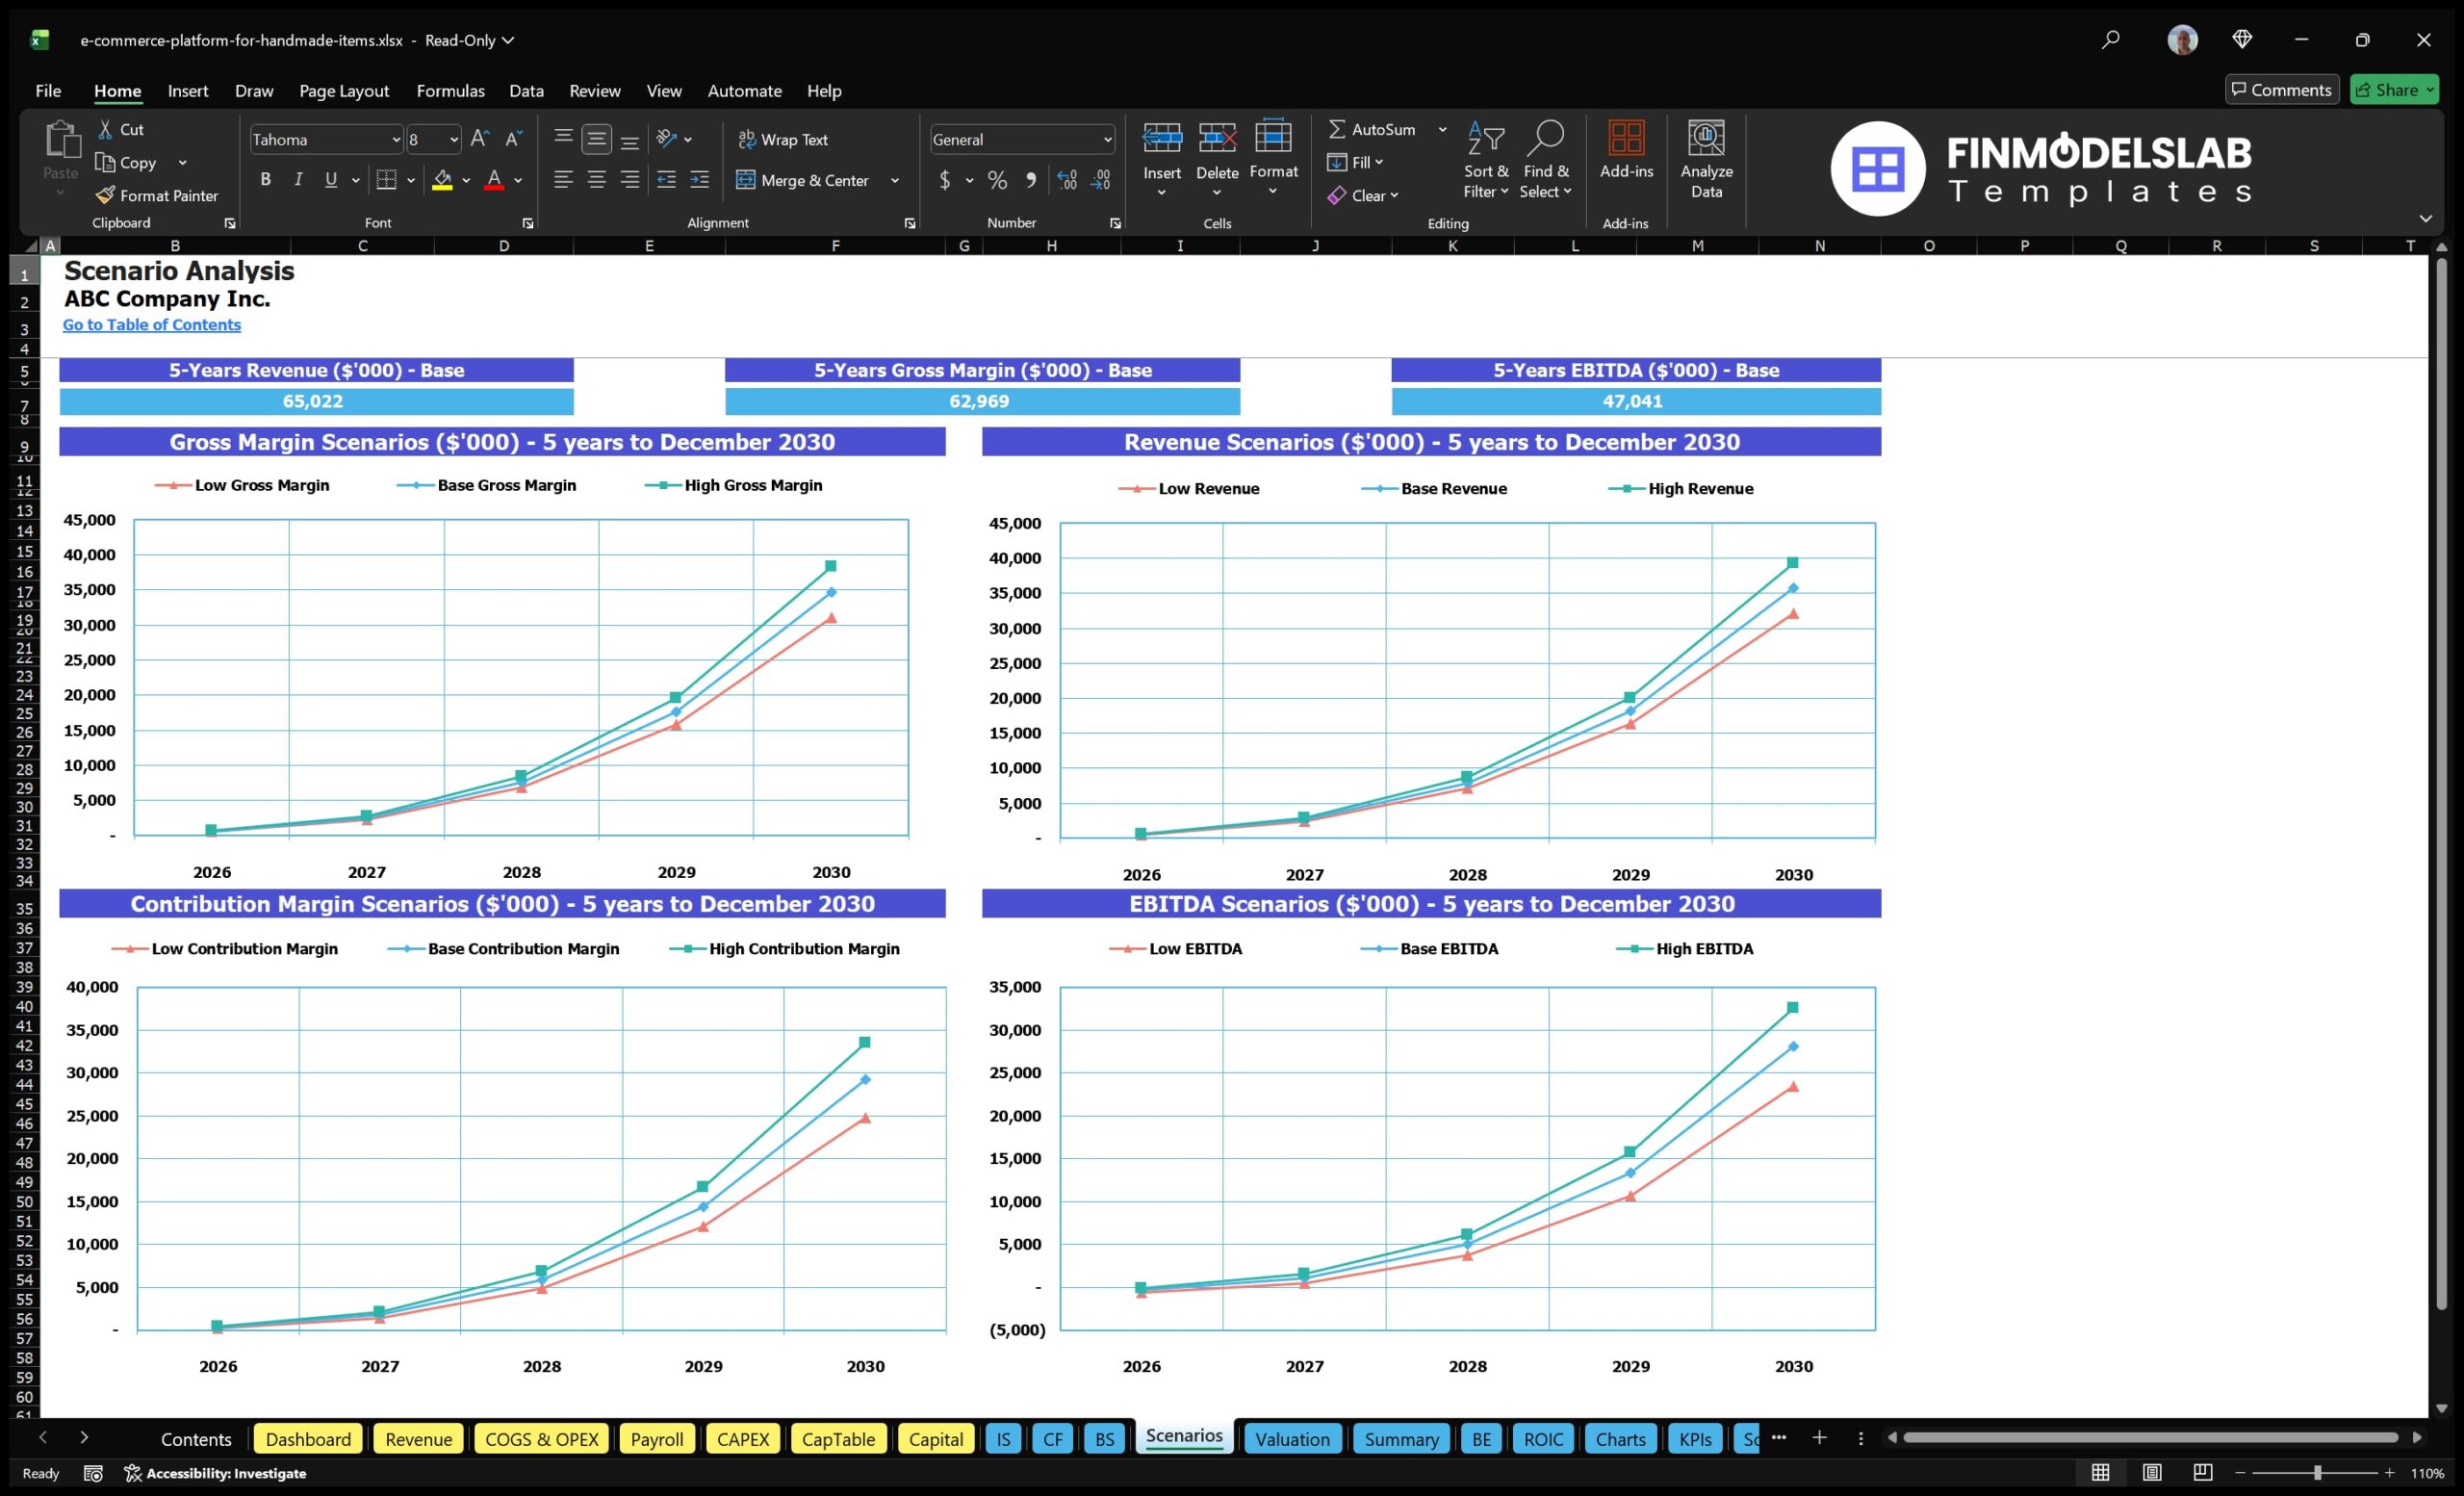
The low, base, and high scenario analysis component allows users to compare three versions of the handmade goods marketplace forecast under different growth, pricing, cost, and profitability assumptions. A low case may reflect slower buyer adoption, higher acquisition costs, lower order frequency, or reduced seller service revenue. A base case may represent the user’s expected plan based on realistic assumptions. A high case may test stronger marketplace traction, higher average order value, better retention, improved take rates, or faster adoption of subscriptions and promoted seller services. This section helps generate side-by-side outputs for revenue, operating profit, cash flow, and funding needs, making it easier to understand upside potential and downside risk. It is especially valuable for decision-making because marketplace founders rarely operate in a single fixed outcome. By seeing how the model behaves in different scenarios, users can prepare more credible funding conversations, set better milestones, and identify which assumptions have the greatest impact on financial performance.
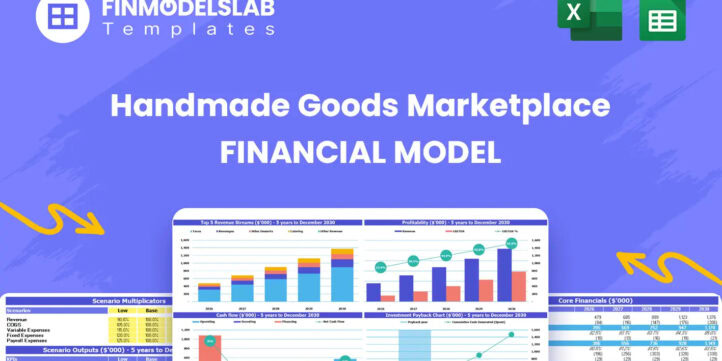
Professional Charts
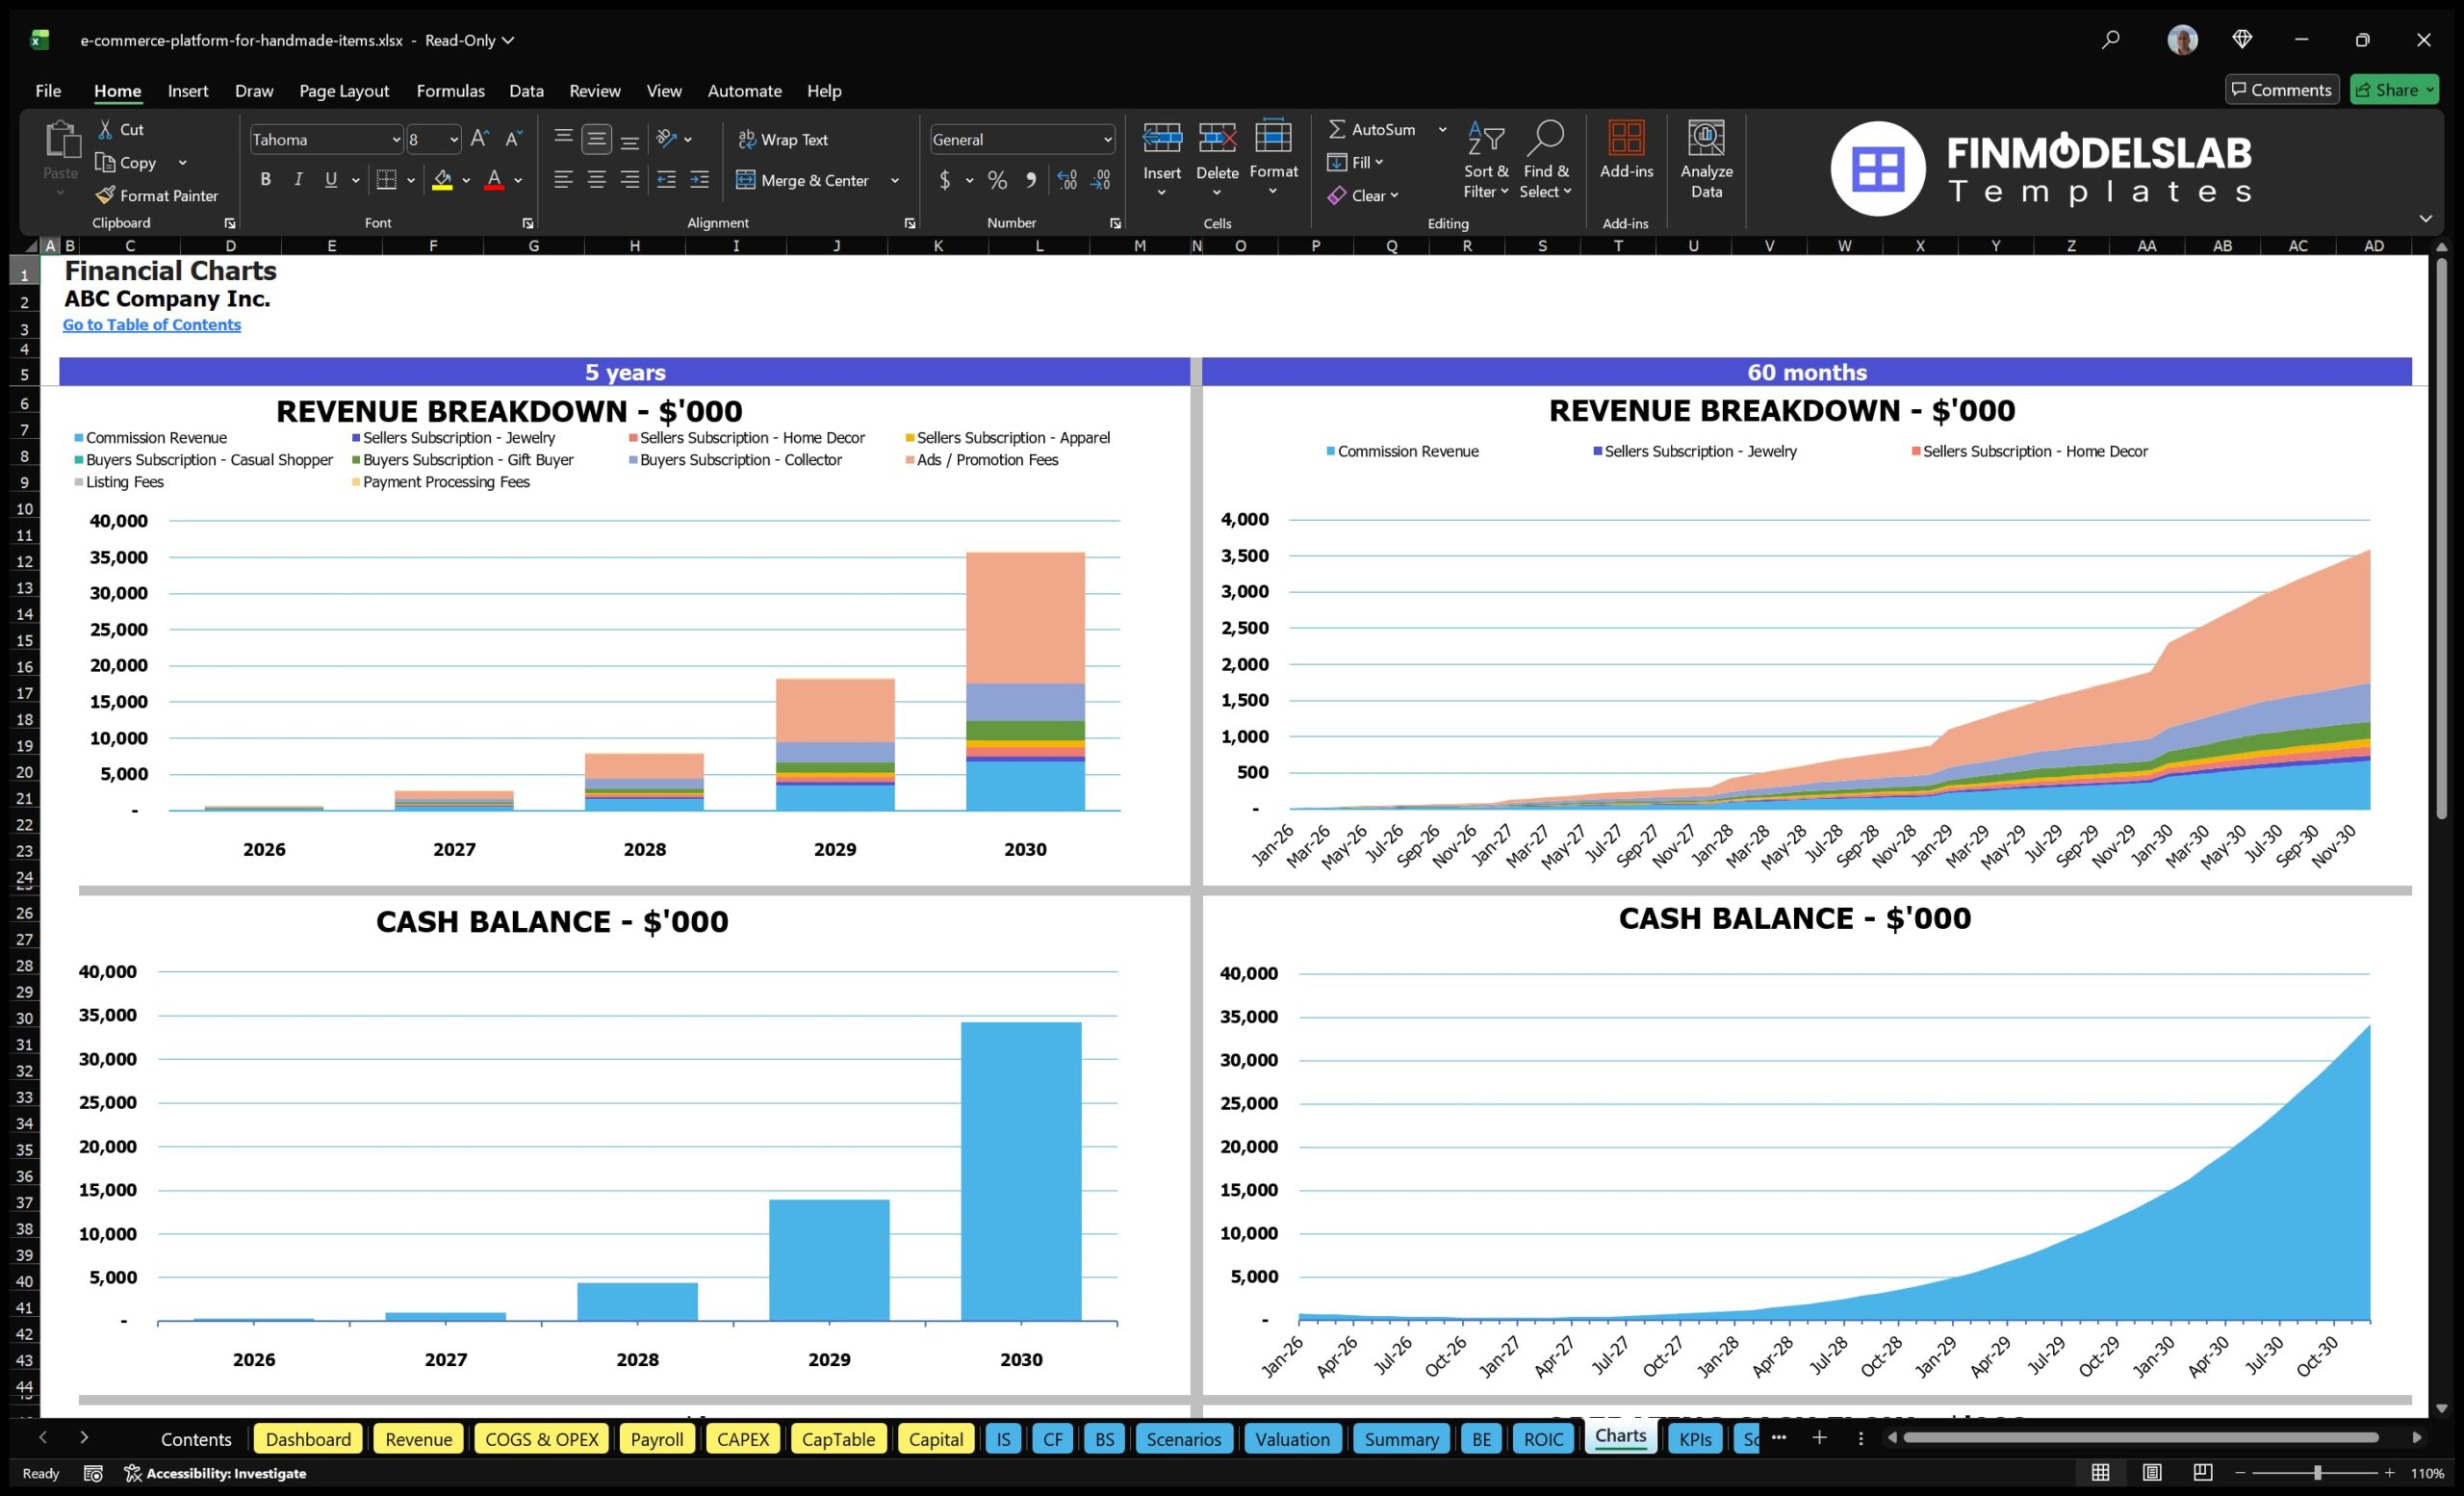
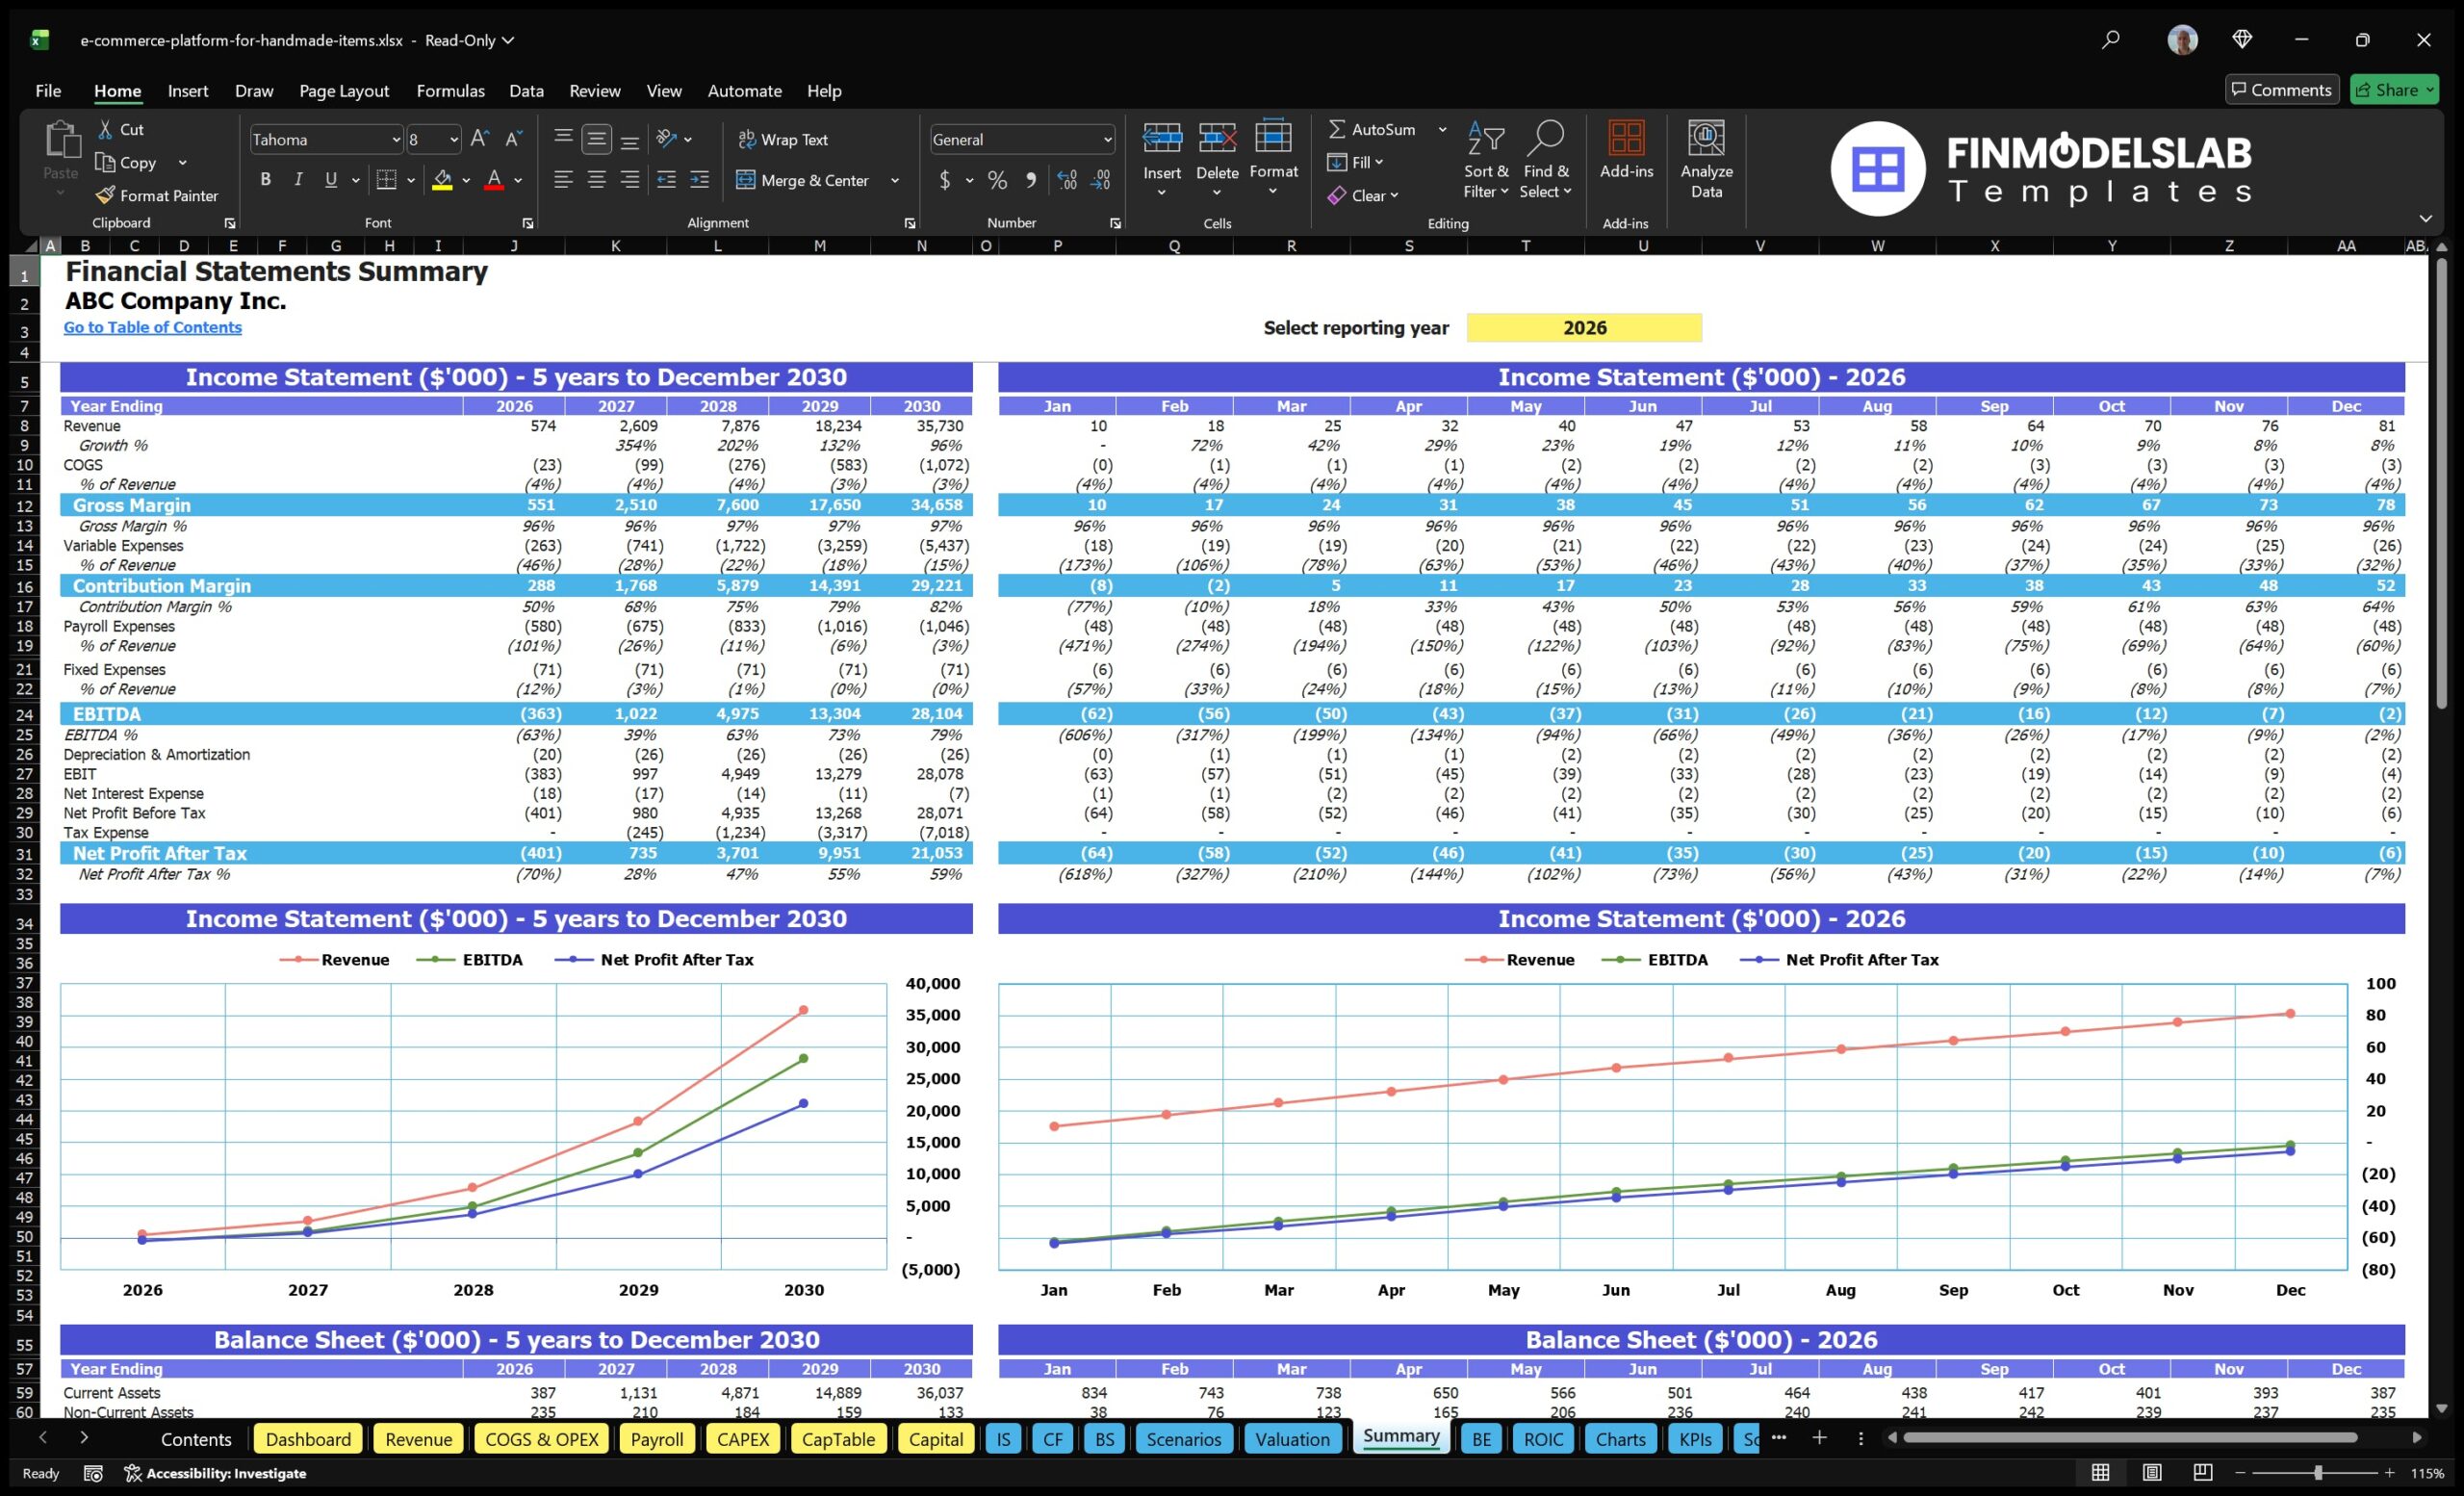
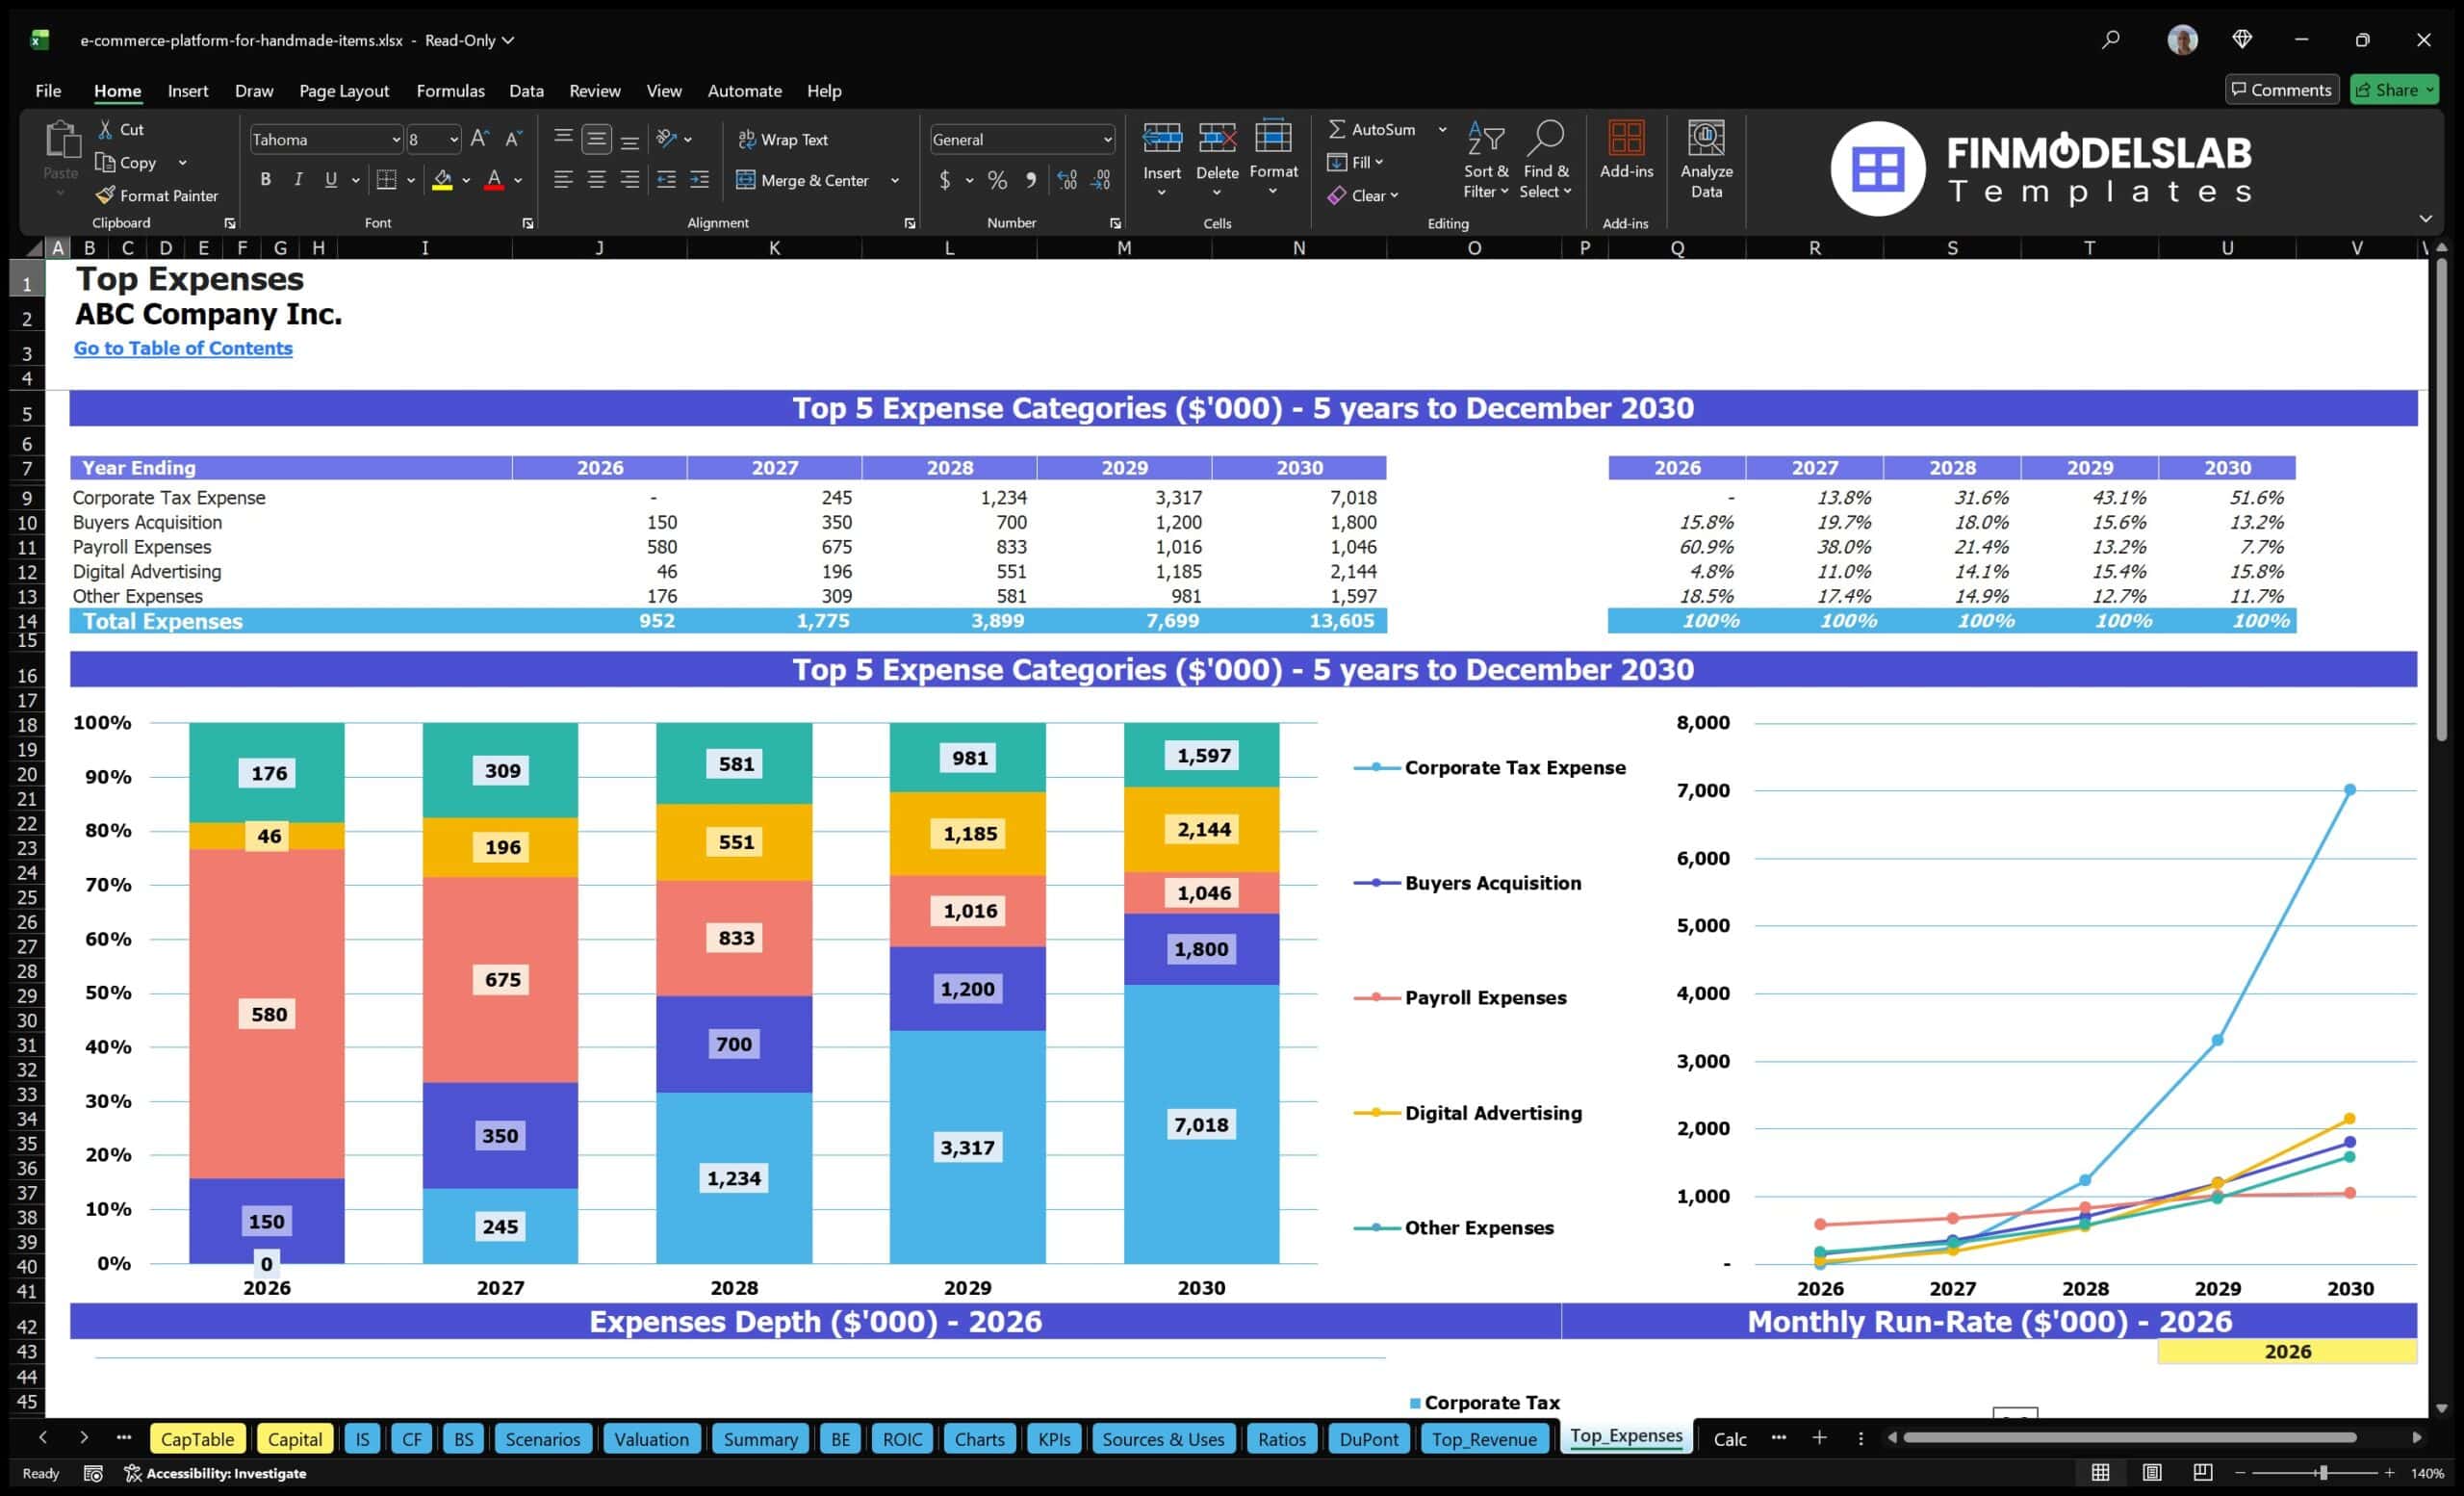
The professional charts component converts the financial forecast into visual reports that are easier to understand, present, and discuss. For a handmade goods marketplace, charts can help show trends in monthly revenue, GMV growth, active buyers, active sellers, order volume, average order value, cash balance, EBITDA, net profit margin, and expense structure. These visuals are useful because stakeholders often need to understand the business story quickly, especially when reviewing a business plan, investor pitch, lender package, or board update. Instead of relying only on detailed spreadsheet rows, users can present clean charts that explain how the marketplace scales from early launch activity to a larger platform with recurring revenue streams and improving margins. This component may also help identify issues that are less obvious in raw numbers, such as rising marketing costs, cash flow troughs, delayed profitability, or a mismatch between seller acquisition and buyer demand. The result is a more polished, presentation-ready financial model that supports clearer communication.
ROE Components and DuPont Analysis
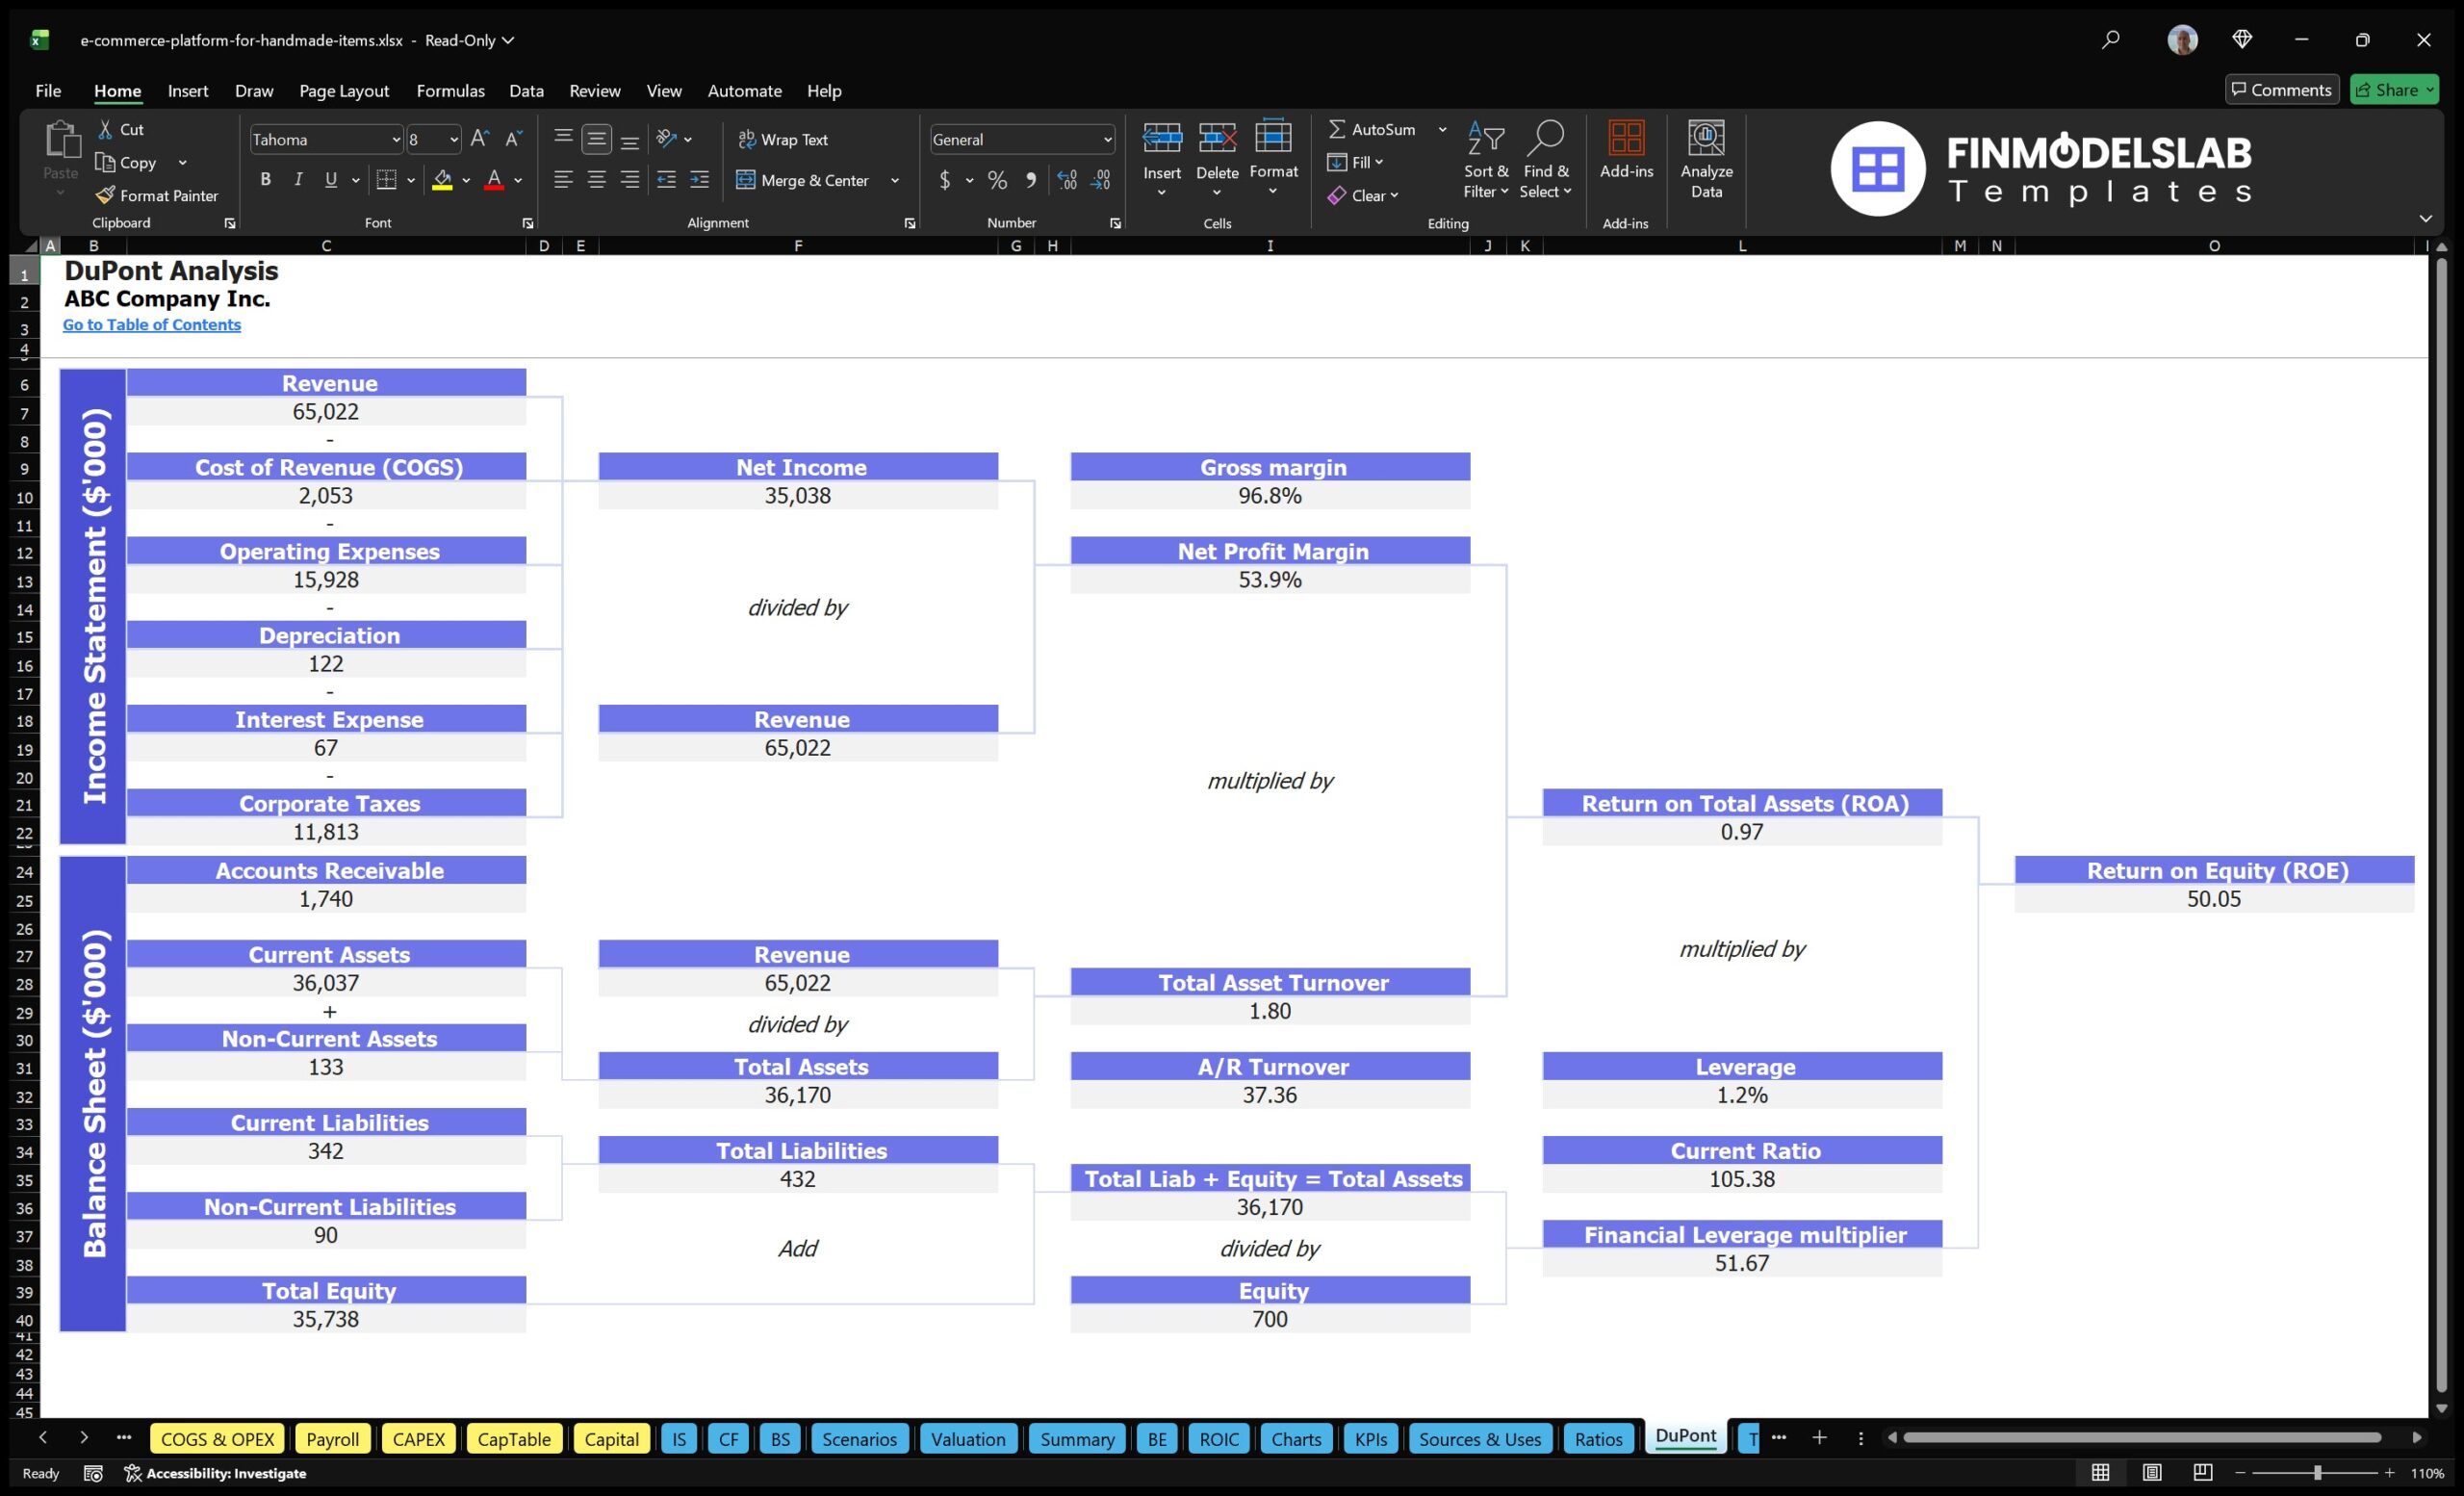
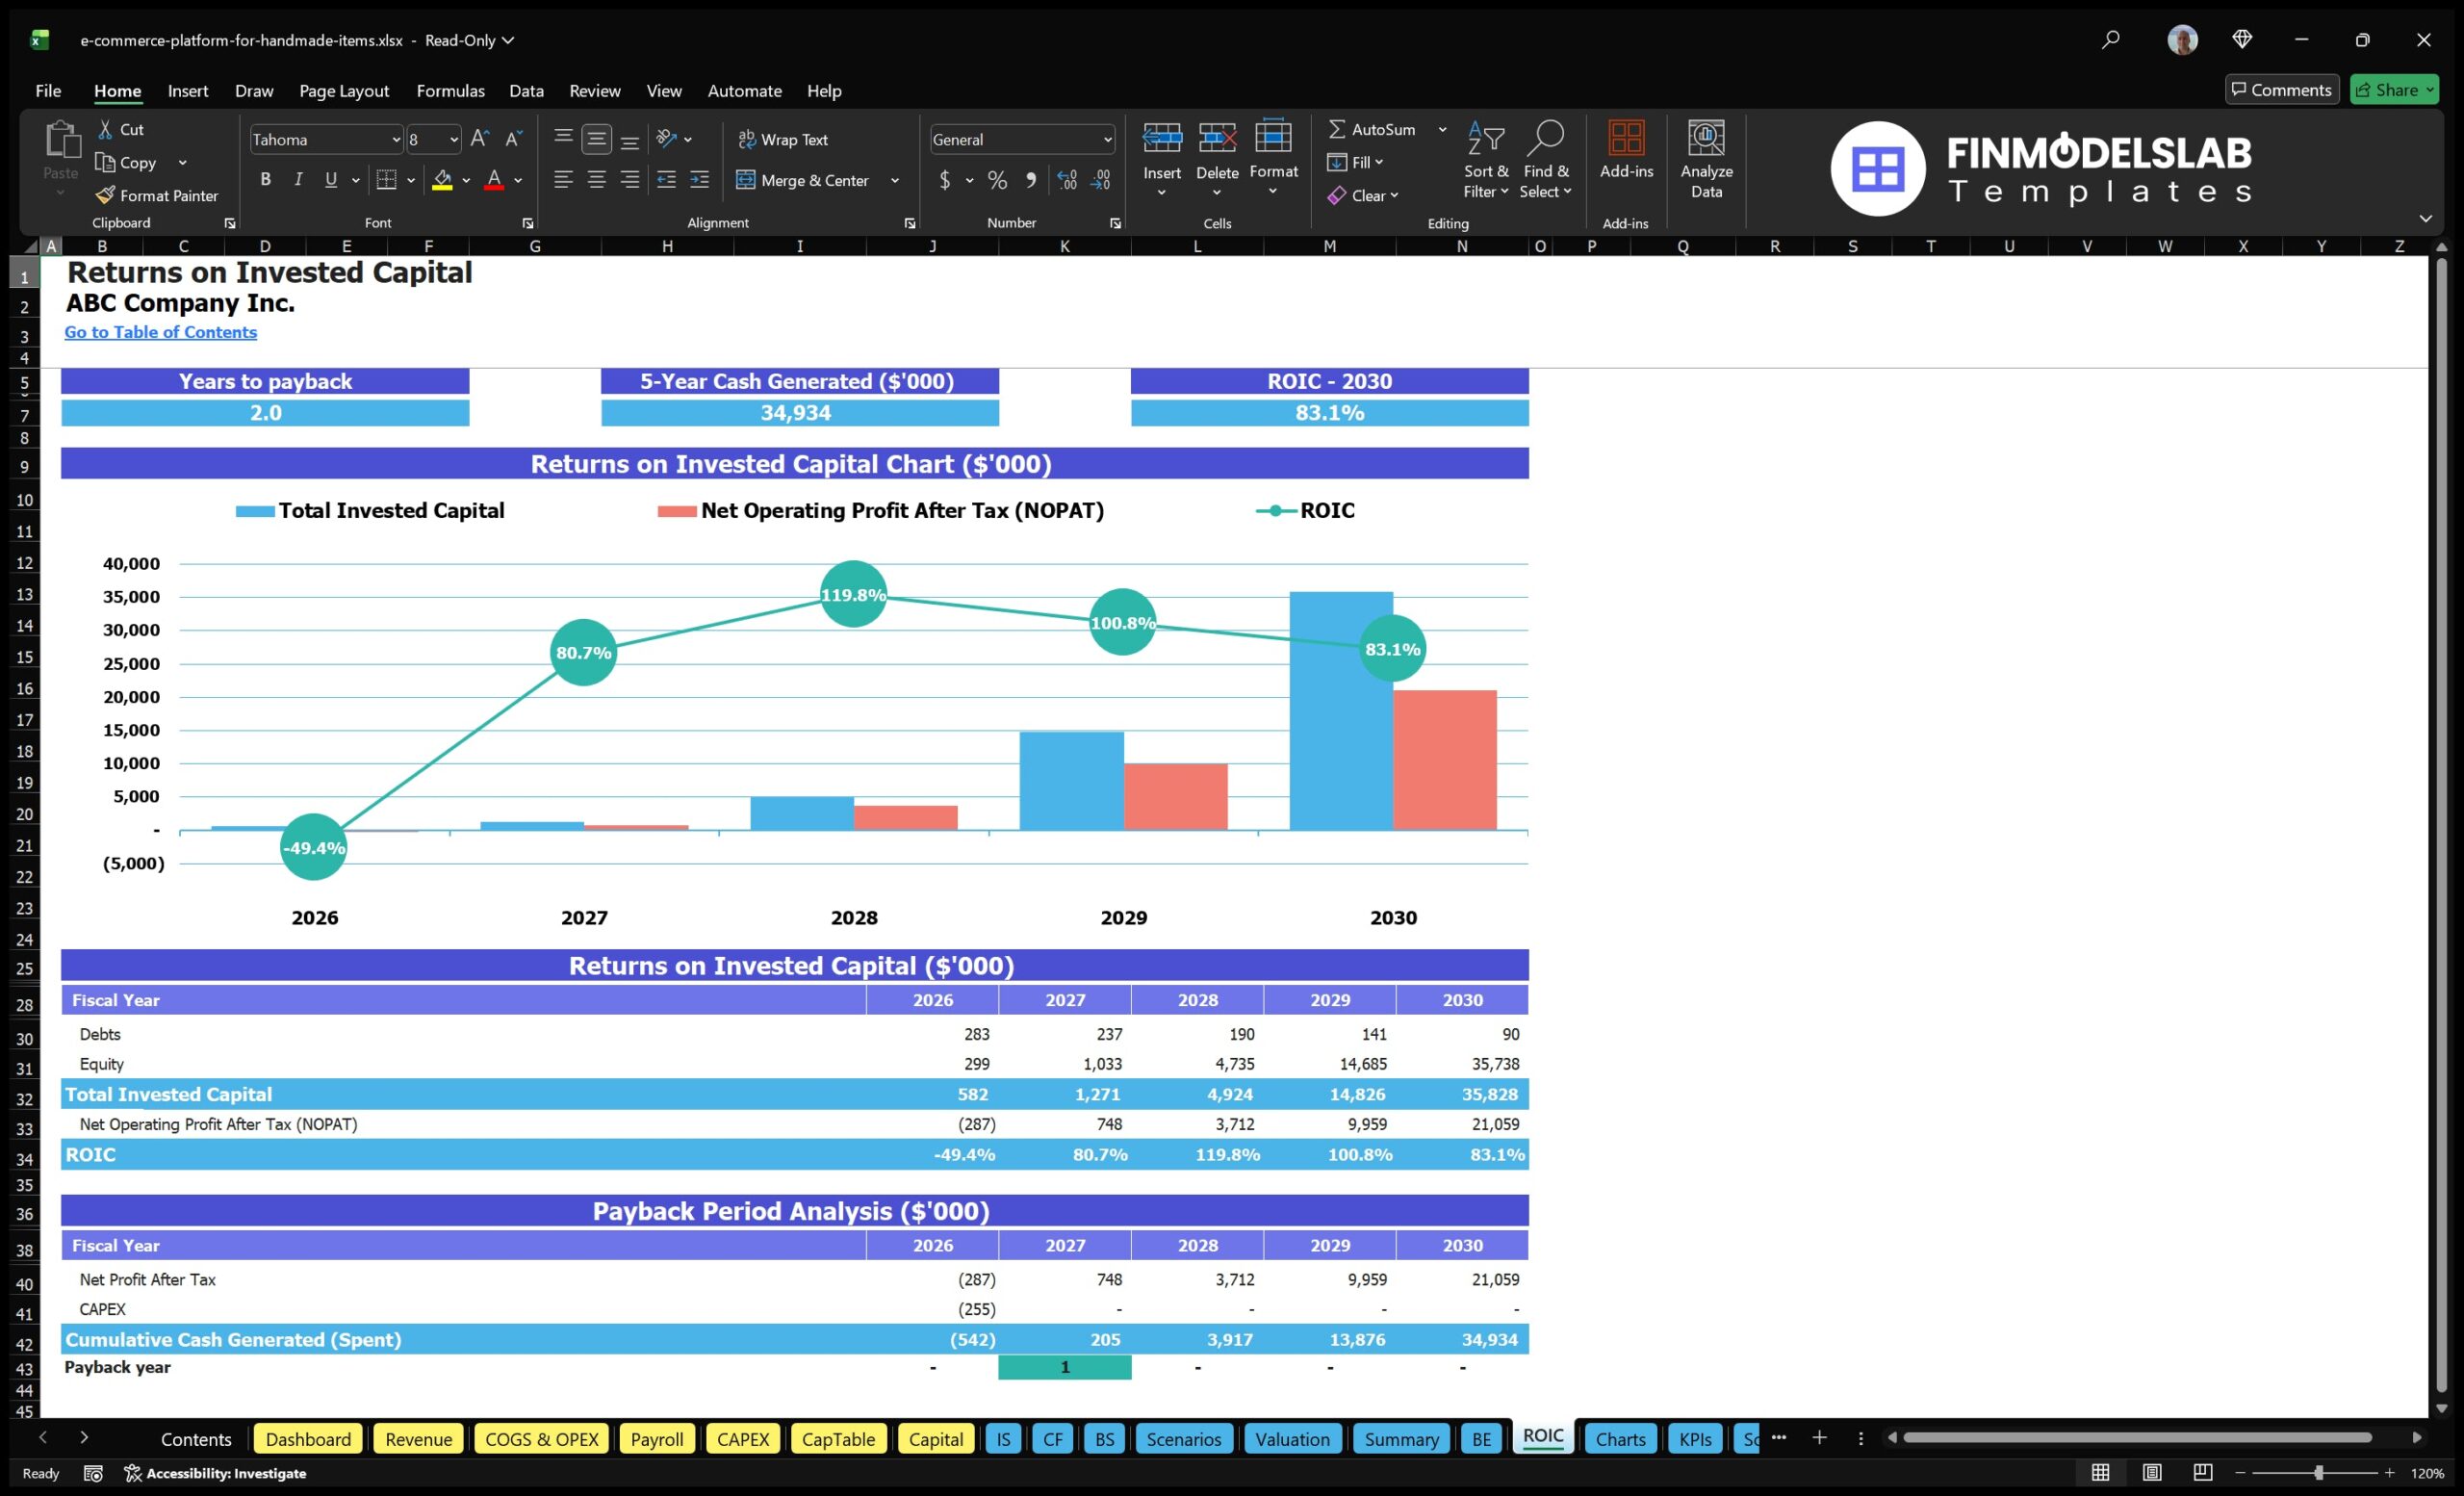
The ROE components and DuPont analysis section helps users evaluate the drivers behind return on equity and overall financial performance. Rather than looking only at final profit figures, this component breaks profitability and returns into underlying factors that may include net profit margin, asset efficiency, and financial leverage. For a handmade goods marketplace, this can be useful because the business model may become more attractive as revenue scales faster than fixed platform costs, customer acquisition efficiency improves, and high-margin services such as subscriptions, promoted listings, or seller tools represent a larger share of income. Inputs may include forecasted net income, equity investment, asset balances, liabilities, and revenue levels. Outputs may include return on equity, margin trends, and component-level insights into what is driving the return profile. This section helps investors, founders, and analysts understand whether projected returns come from real operating performance, aggressive leverage, or assumptions that may need further validation. It adds depth to the financial analysis and supports more informed funding discussions.
Revenue Inputs
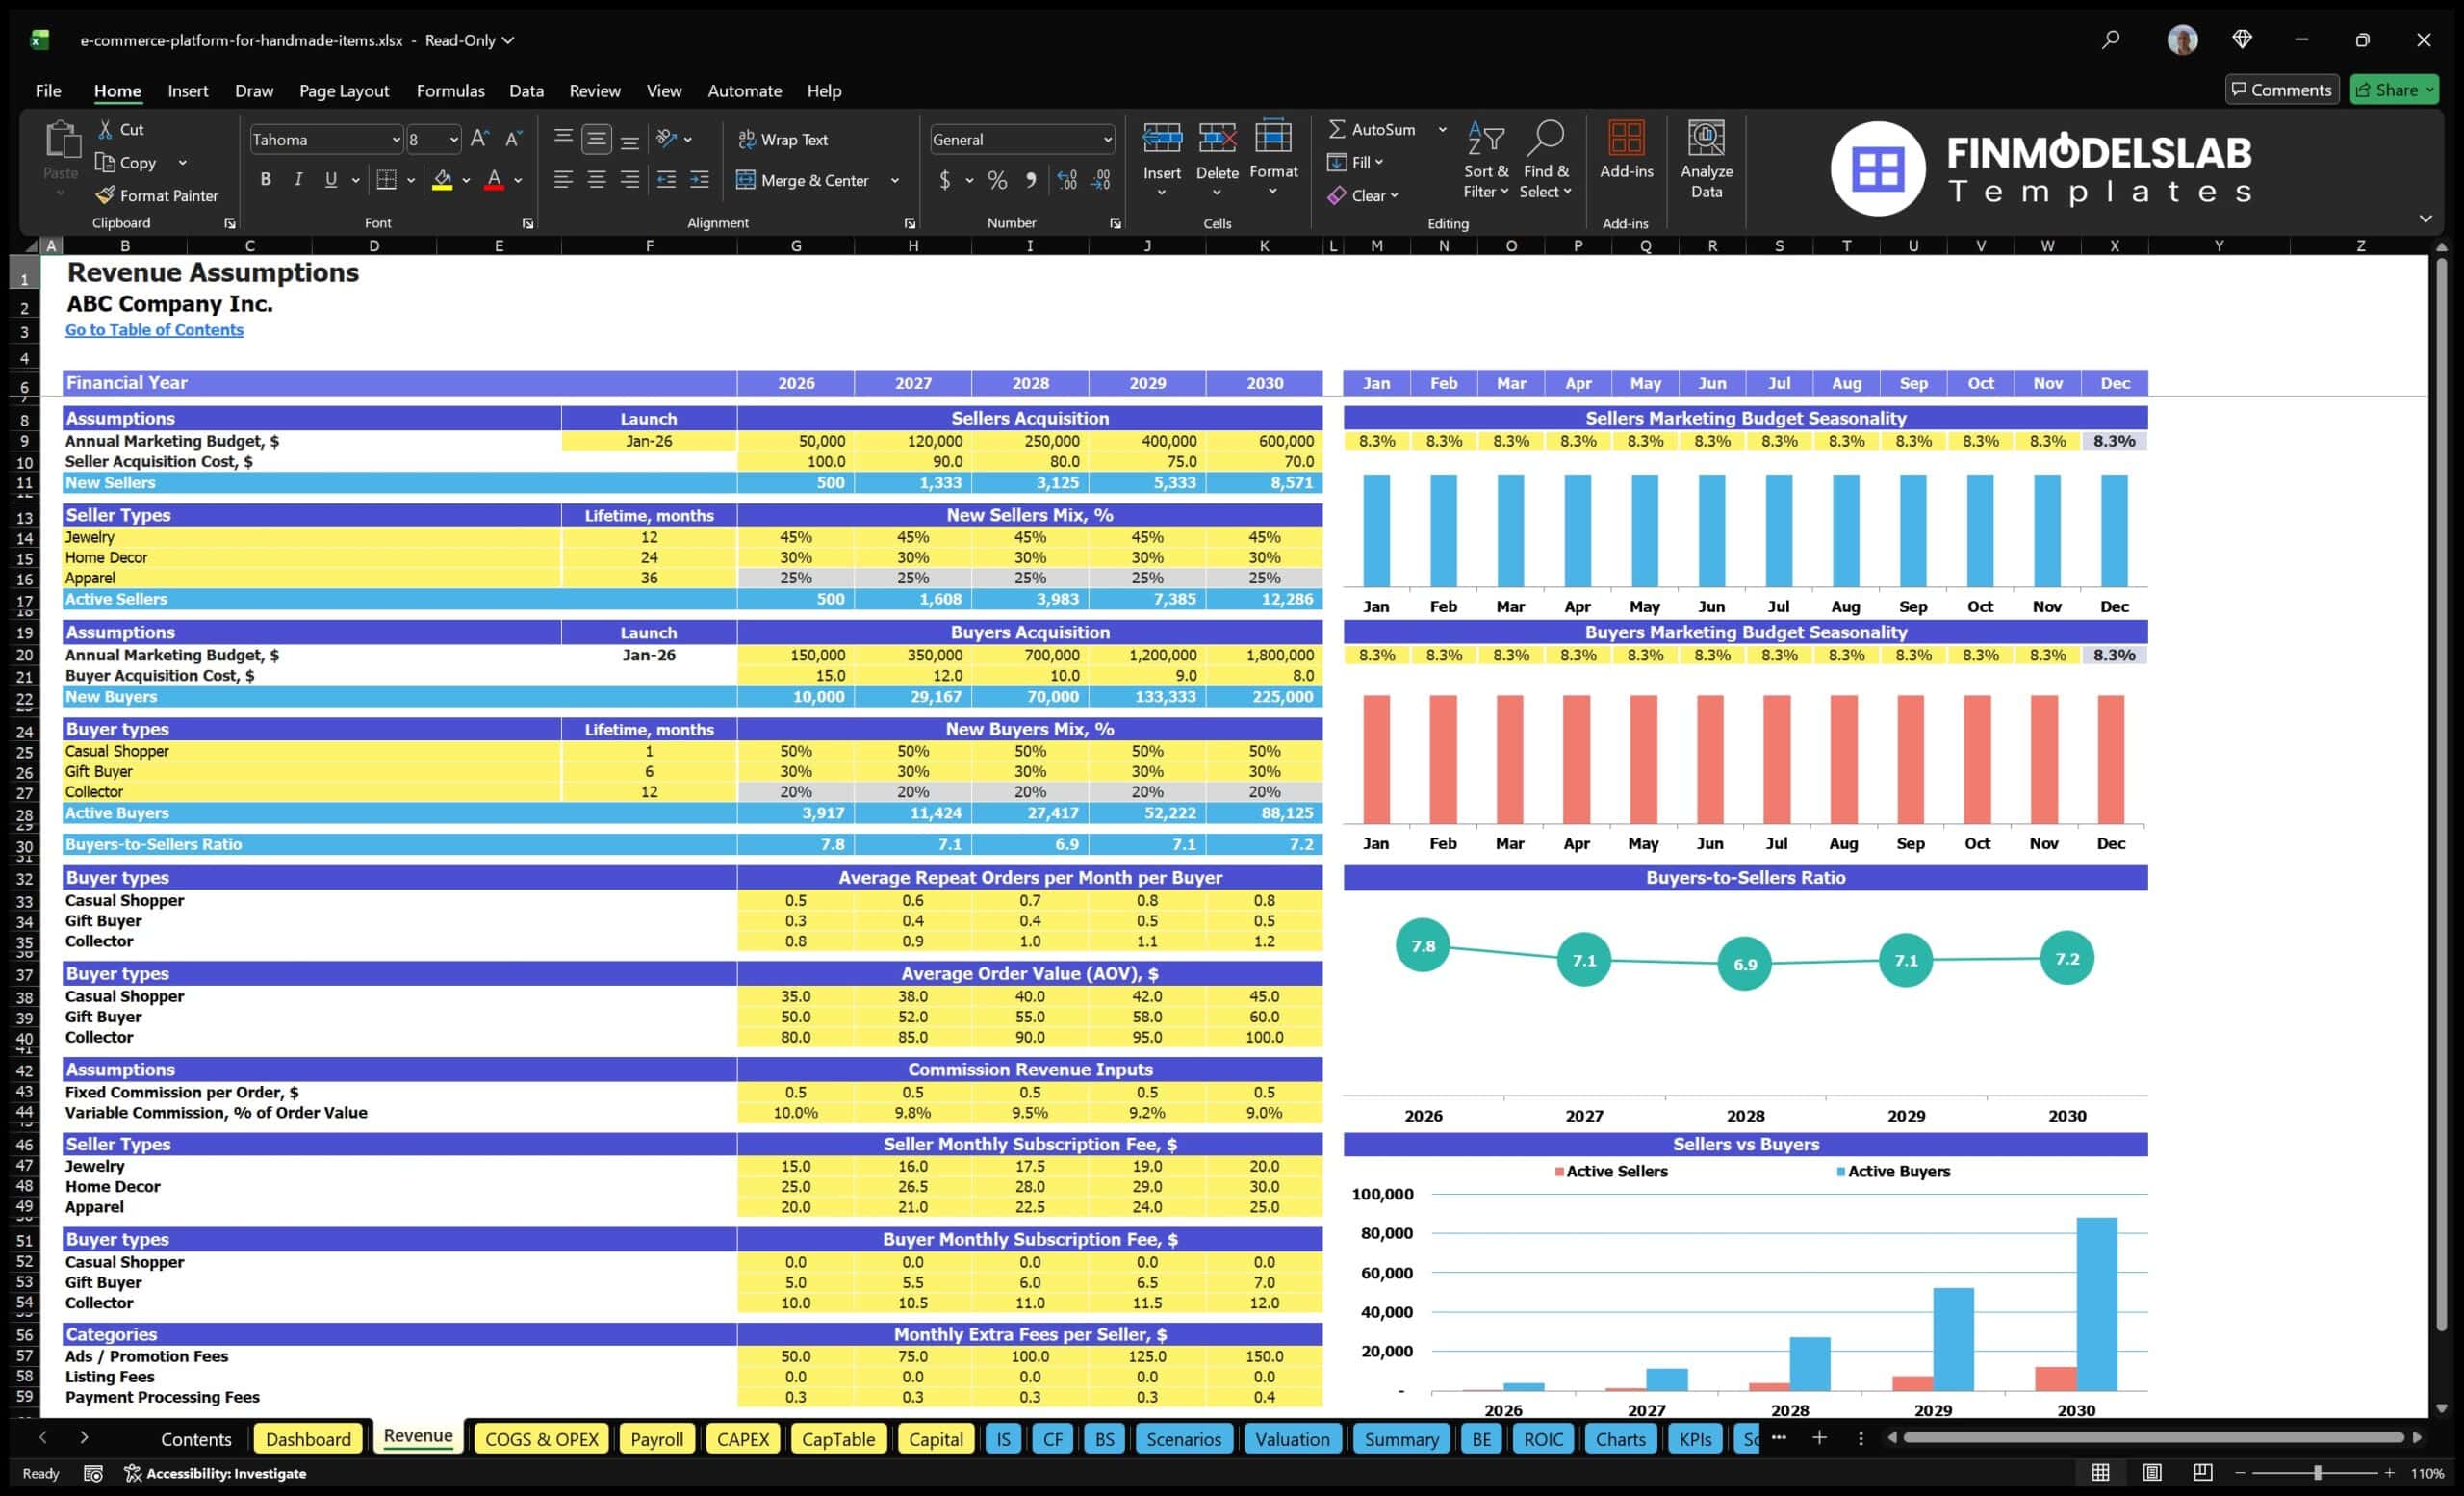
The revenue inputs component is where users define the commercial assumptions that drive the handmade goods marketplace forecast. It may include active buyer growth, active seller growth, order frequency, average order value, commission percentage, fixed transaction fees, seller subscription pricing, buyer premium membership pricing, seller advertising revenue, promoted listing fees, and other value-added services. This section is especially important for an artisan marketplace because revenue is typically generated from multiple streams rather than a single product sale. The model can use these inputs to estimate Gross Merchandise Value and then calculate platform revenue based on take rate, subscription adoption, and seller service participation. Users can adjust assumptions to reflect their positioning, whether the marketplace focuses on premium handmade goods, niche craft categories, local artisans, custom products, or a broader e-commerce platform. By structuring revenue inputs clearly, the template helps users test pricing strategy, evaluate monetization options, and build a forecast that is grounded in specific marketplace activity rather than vague top-line estimates.
Bank-Ready Reports
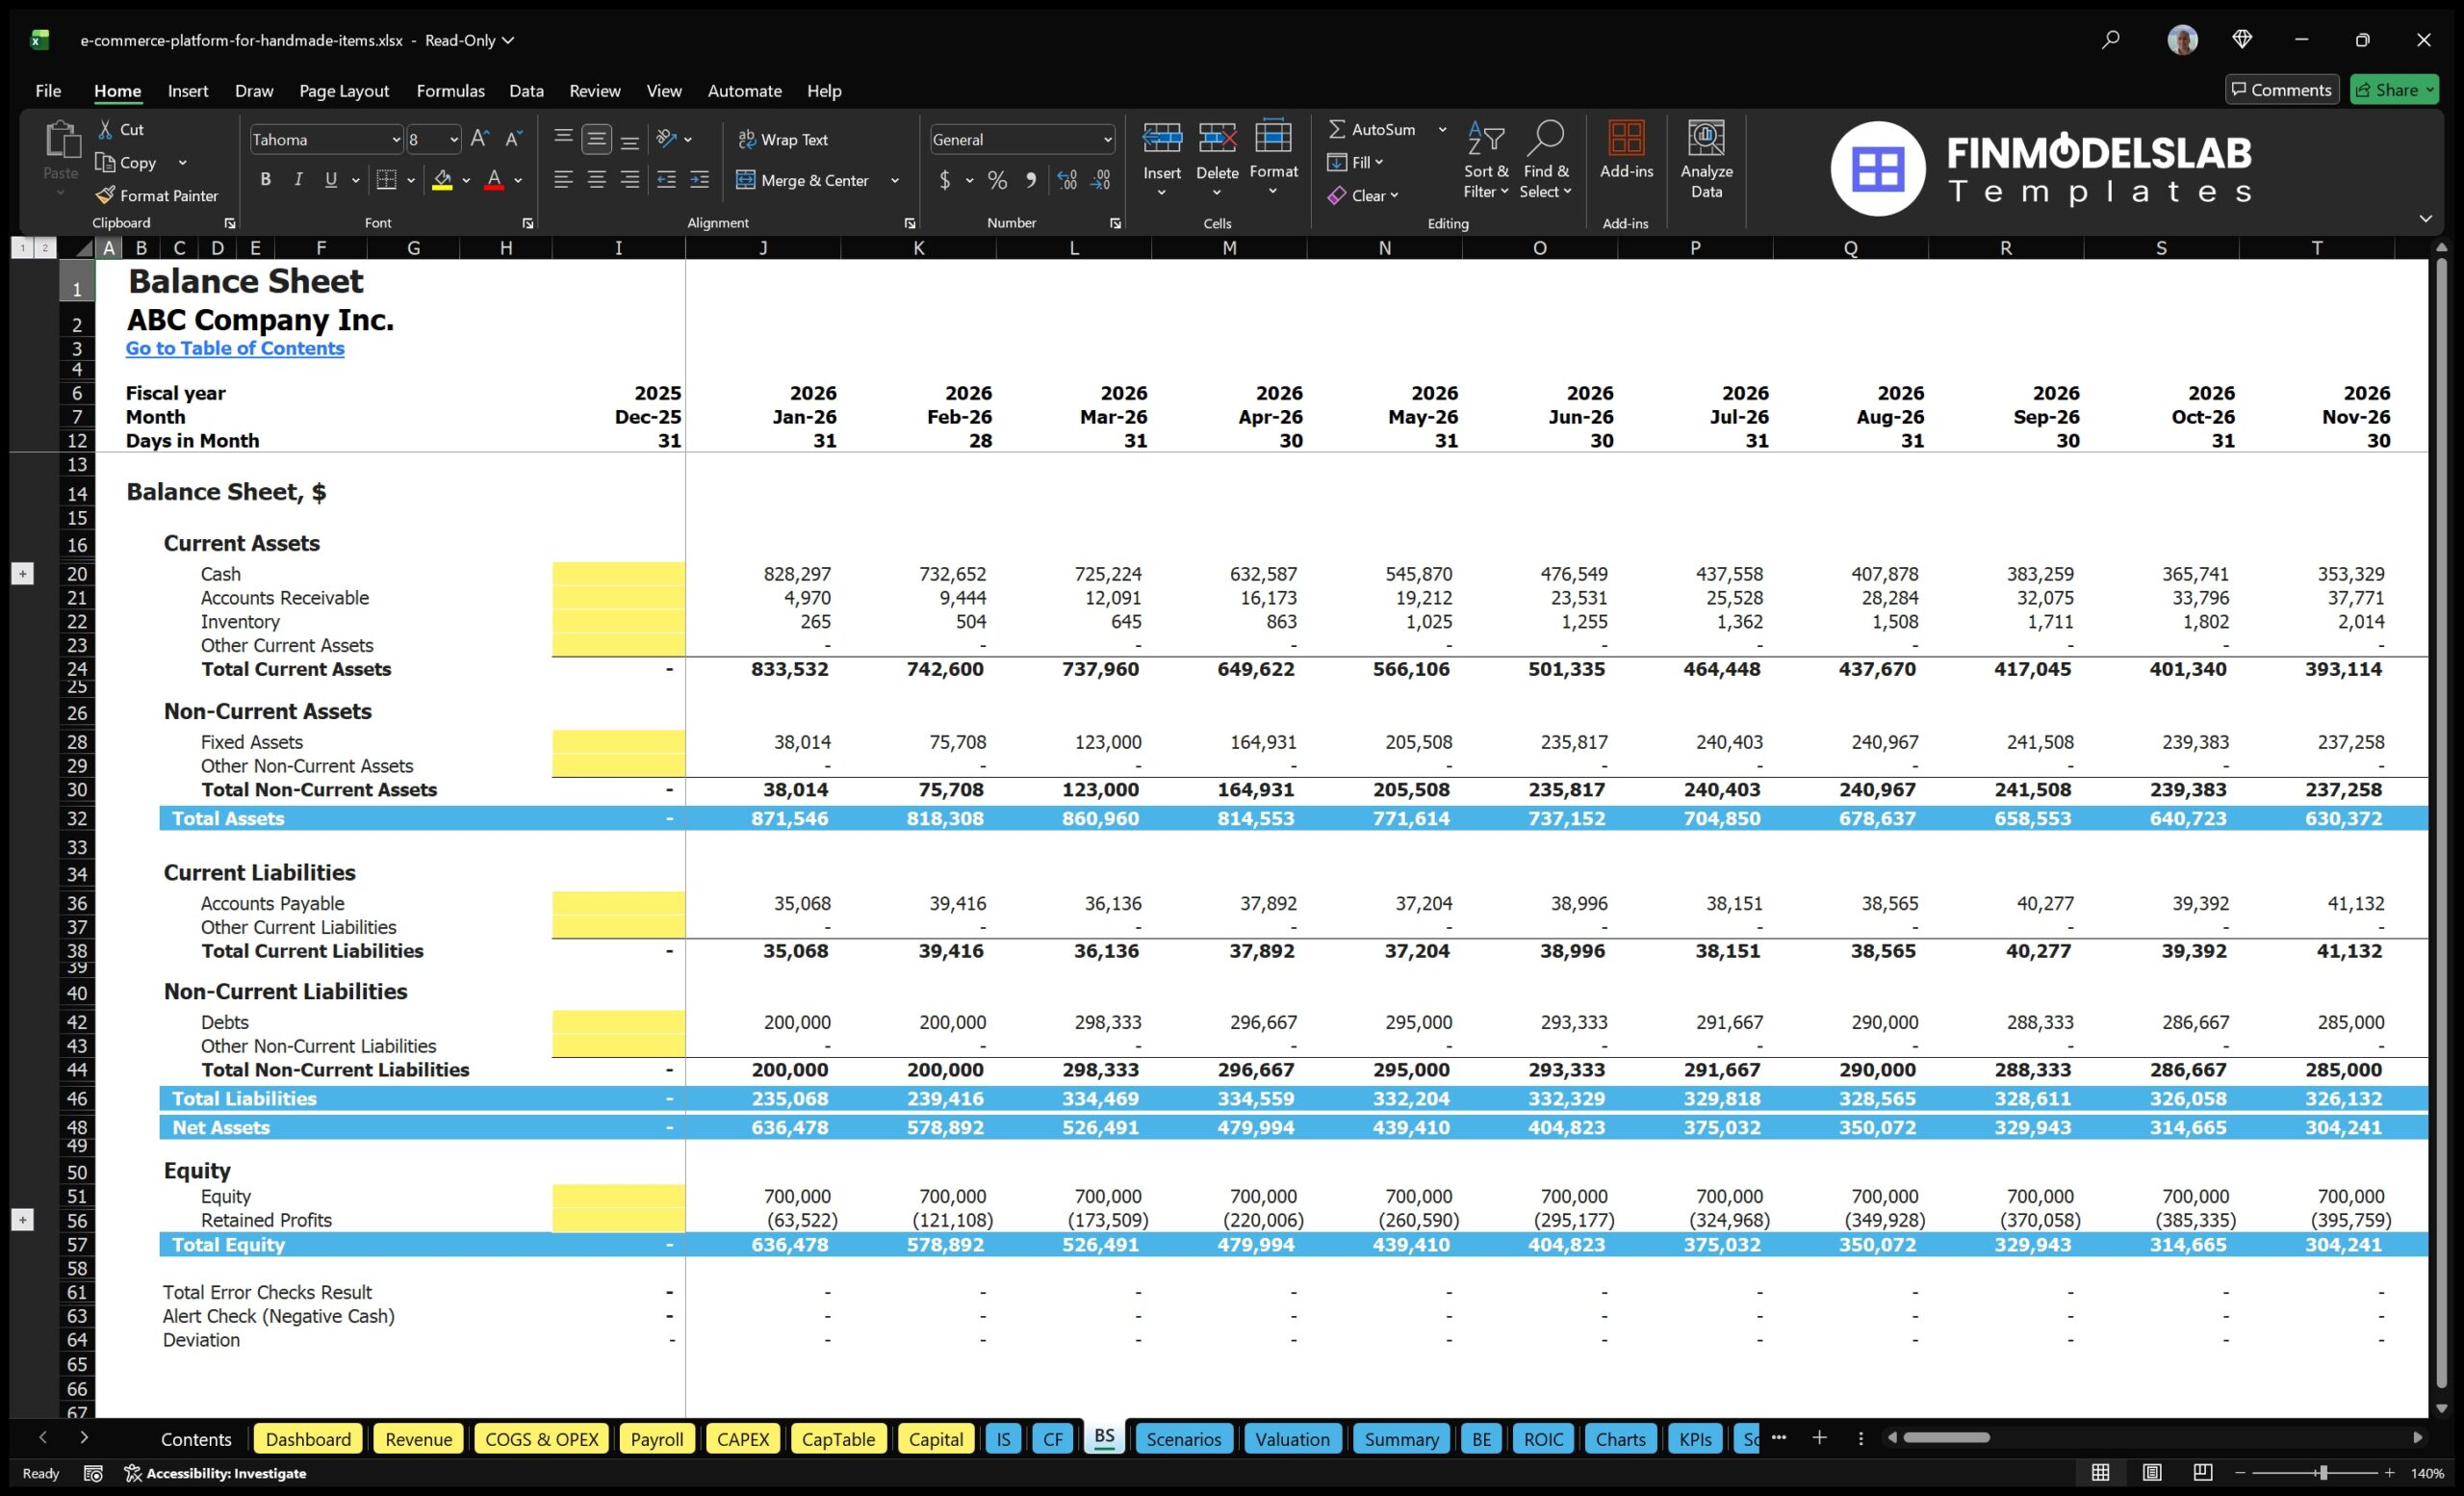
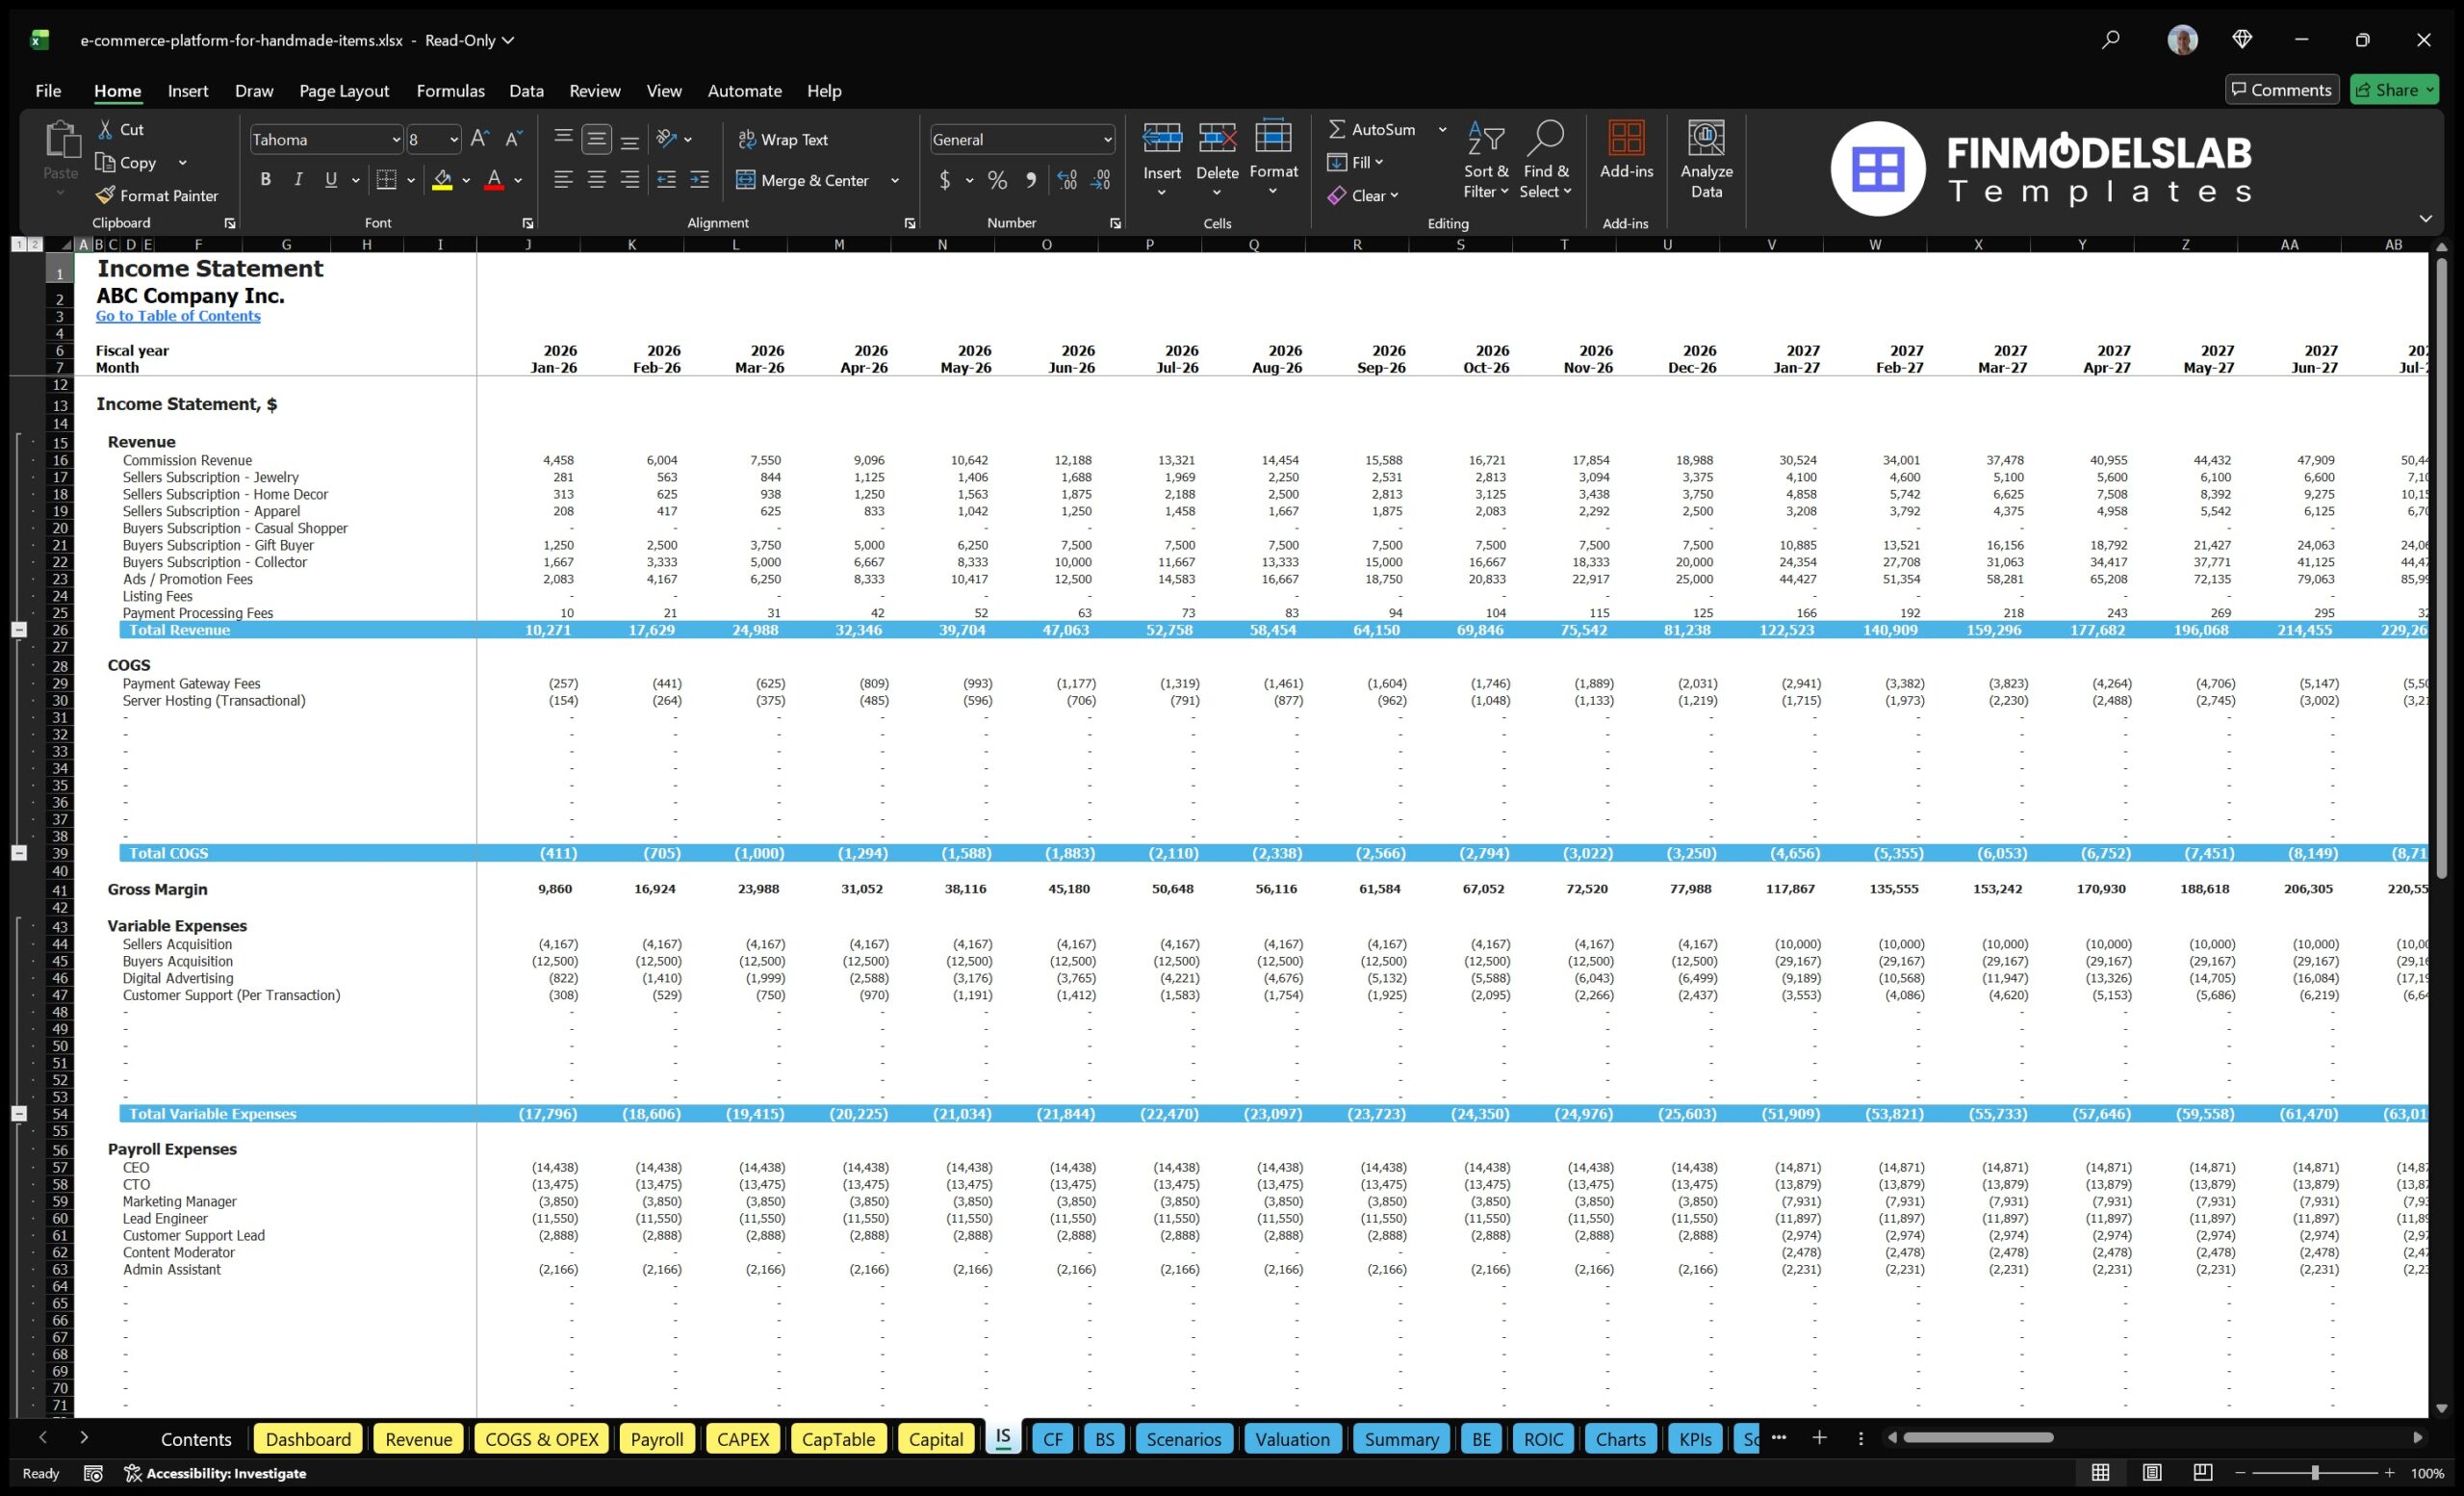
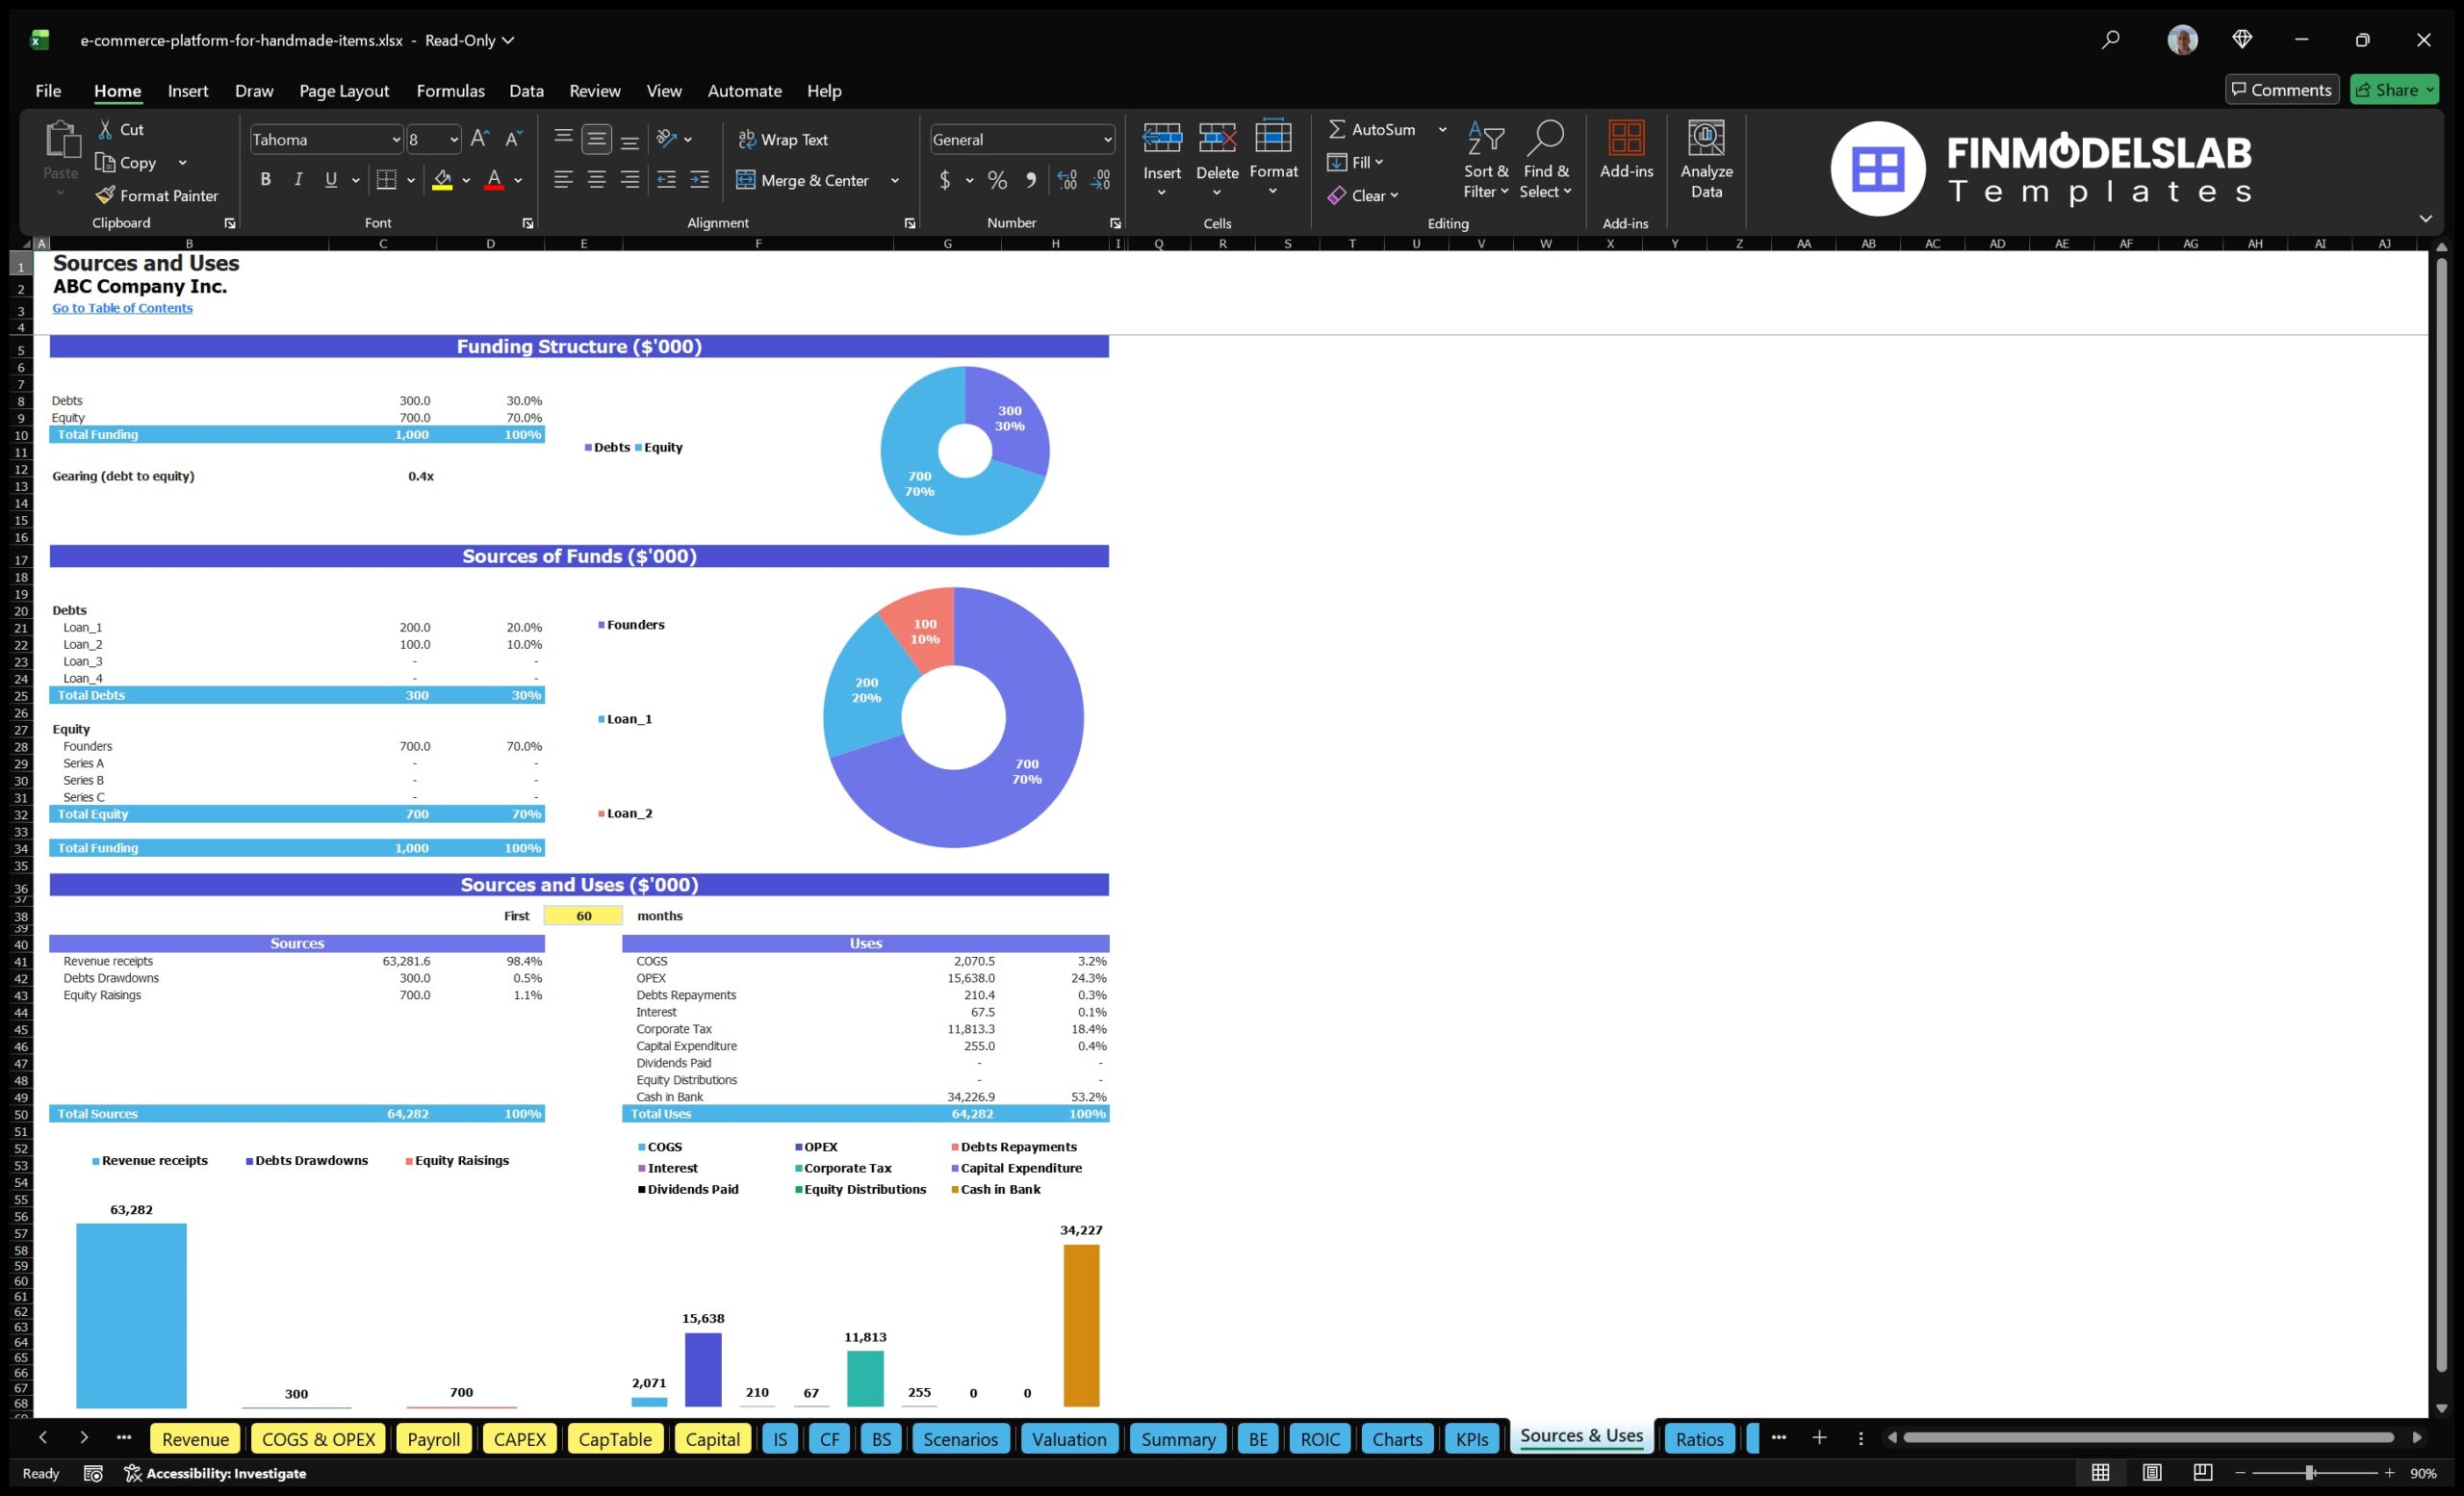
The bank-ready reports component organizes financial outputs in a format suitable for lenders, financing partners, and other stakeholders who need to review the business from a credit and repayment perspective. This section may include income statement summaries, cash flow forecasts, balance sheet projections, debt service assumptions, funding requirements, profitability metrics, and monthly or annual financial statements. For a handmade goods marketplace seeking startup capital, working capital, technology financing, or growth funding, clear reports are essential because lenders want to understand how revenue converts into cash, whether the business can cover fixed obligations, and how much liquidity is available during early-stage losses. Inputs may include loan amounts, repayment schedules, interest rates, startup costs, operating expenses, and forecasted revenue. Outputs can show cash balances, debt repayment capacity, profit and loss performance, and projected financial stability. This component helps users move beyond an informal plan and present financial information in a more structured, professional, and lender-friendly way.
Revenue Breakdown
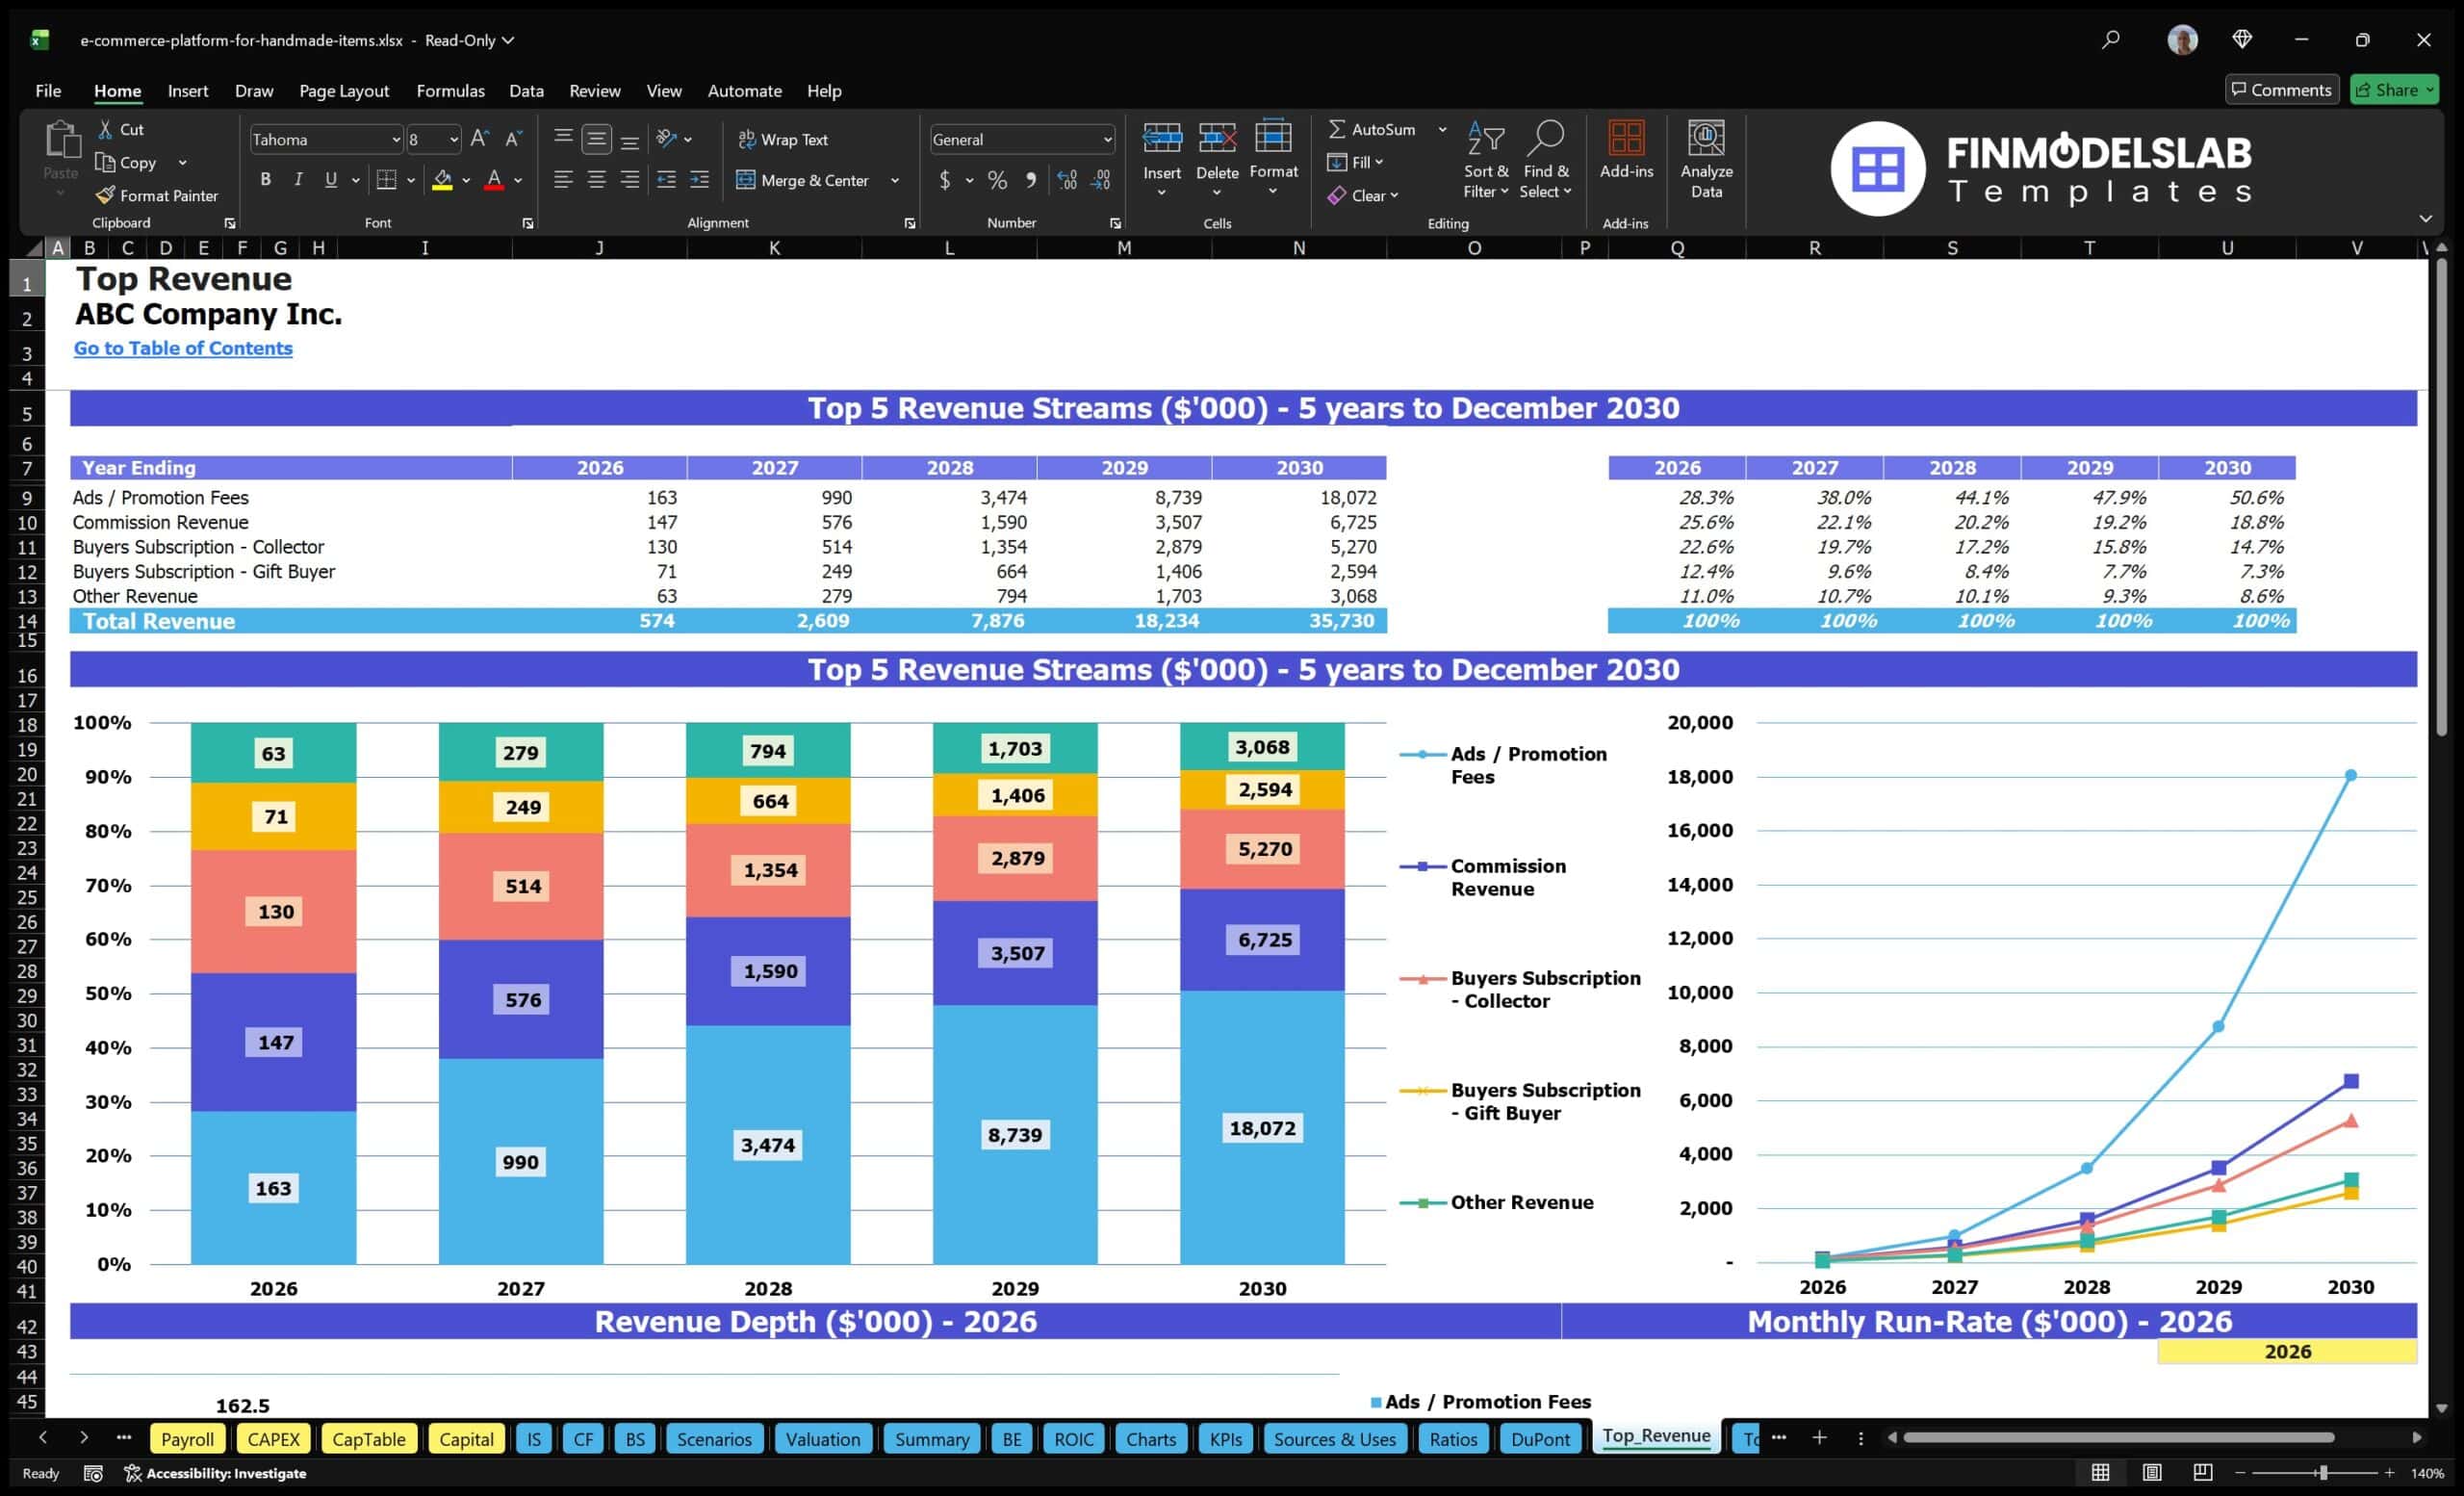
The revenue breakdown component provides a detailed view of each revenue stream within the handmade goods marketplace model. Instead of showing only total revenue, it separates income by source so users can understand what is driving growth and where the business may be most profitable. Revenue streams may include transaction commissions, fixed order fees, seller subscriptions, buyer premium subscriptions, promoted listings, seller advertising, premium storefront tools, fulfillment-related service fees, or other value-added marketplace services. Inputs may include pricing, adoption rates, number of active users, order volume, average order value, and participation rates for optional services. Outputs can show revenue by stream, revenue mix, growth contribution, and the relative importance of recurring versus transaction-based income. This component is useful because marketplaces often become stronger when they diversify monetization beyond commissions alone. By analyzing each stream separately, users can identify which revenue lines deserve more investment, which assumptions are most sensitive, and how changes in pricing or adoption affect total profitability.
KPI Dashboard and Performance Benchmarks
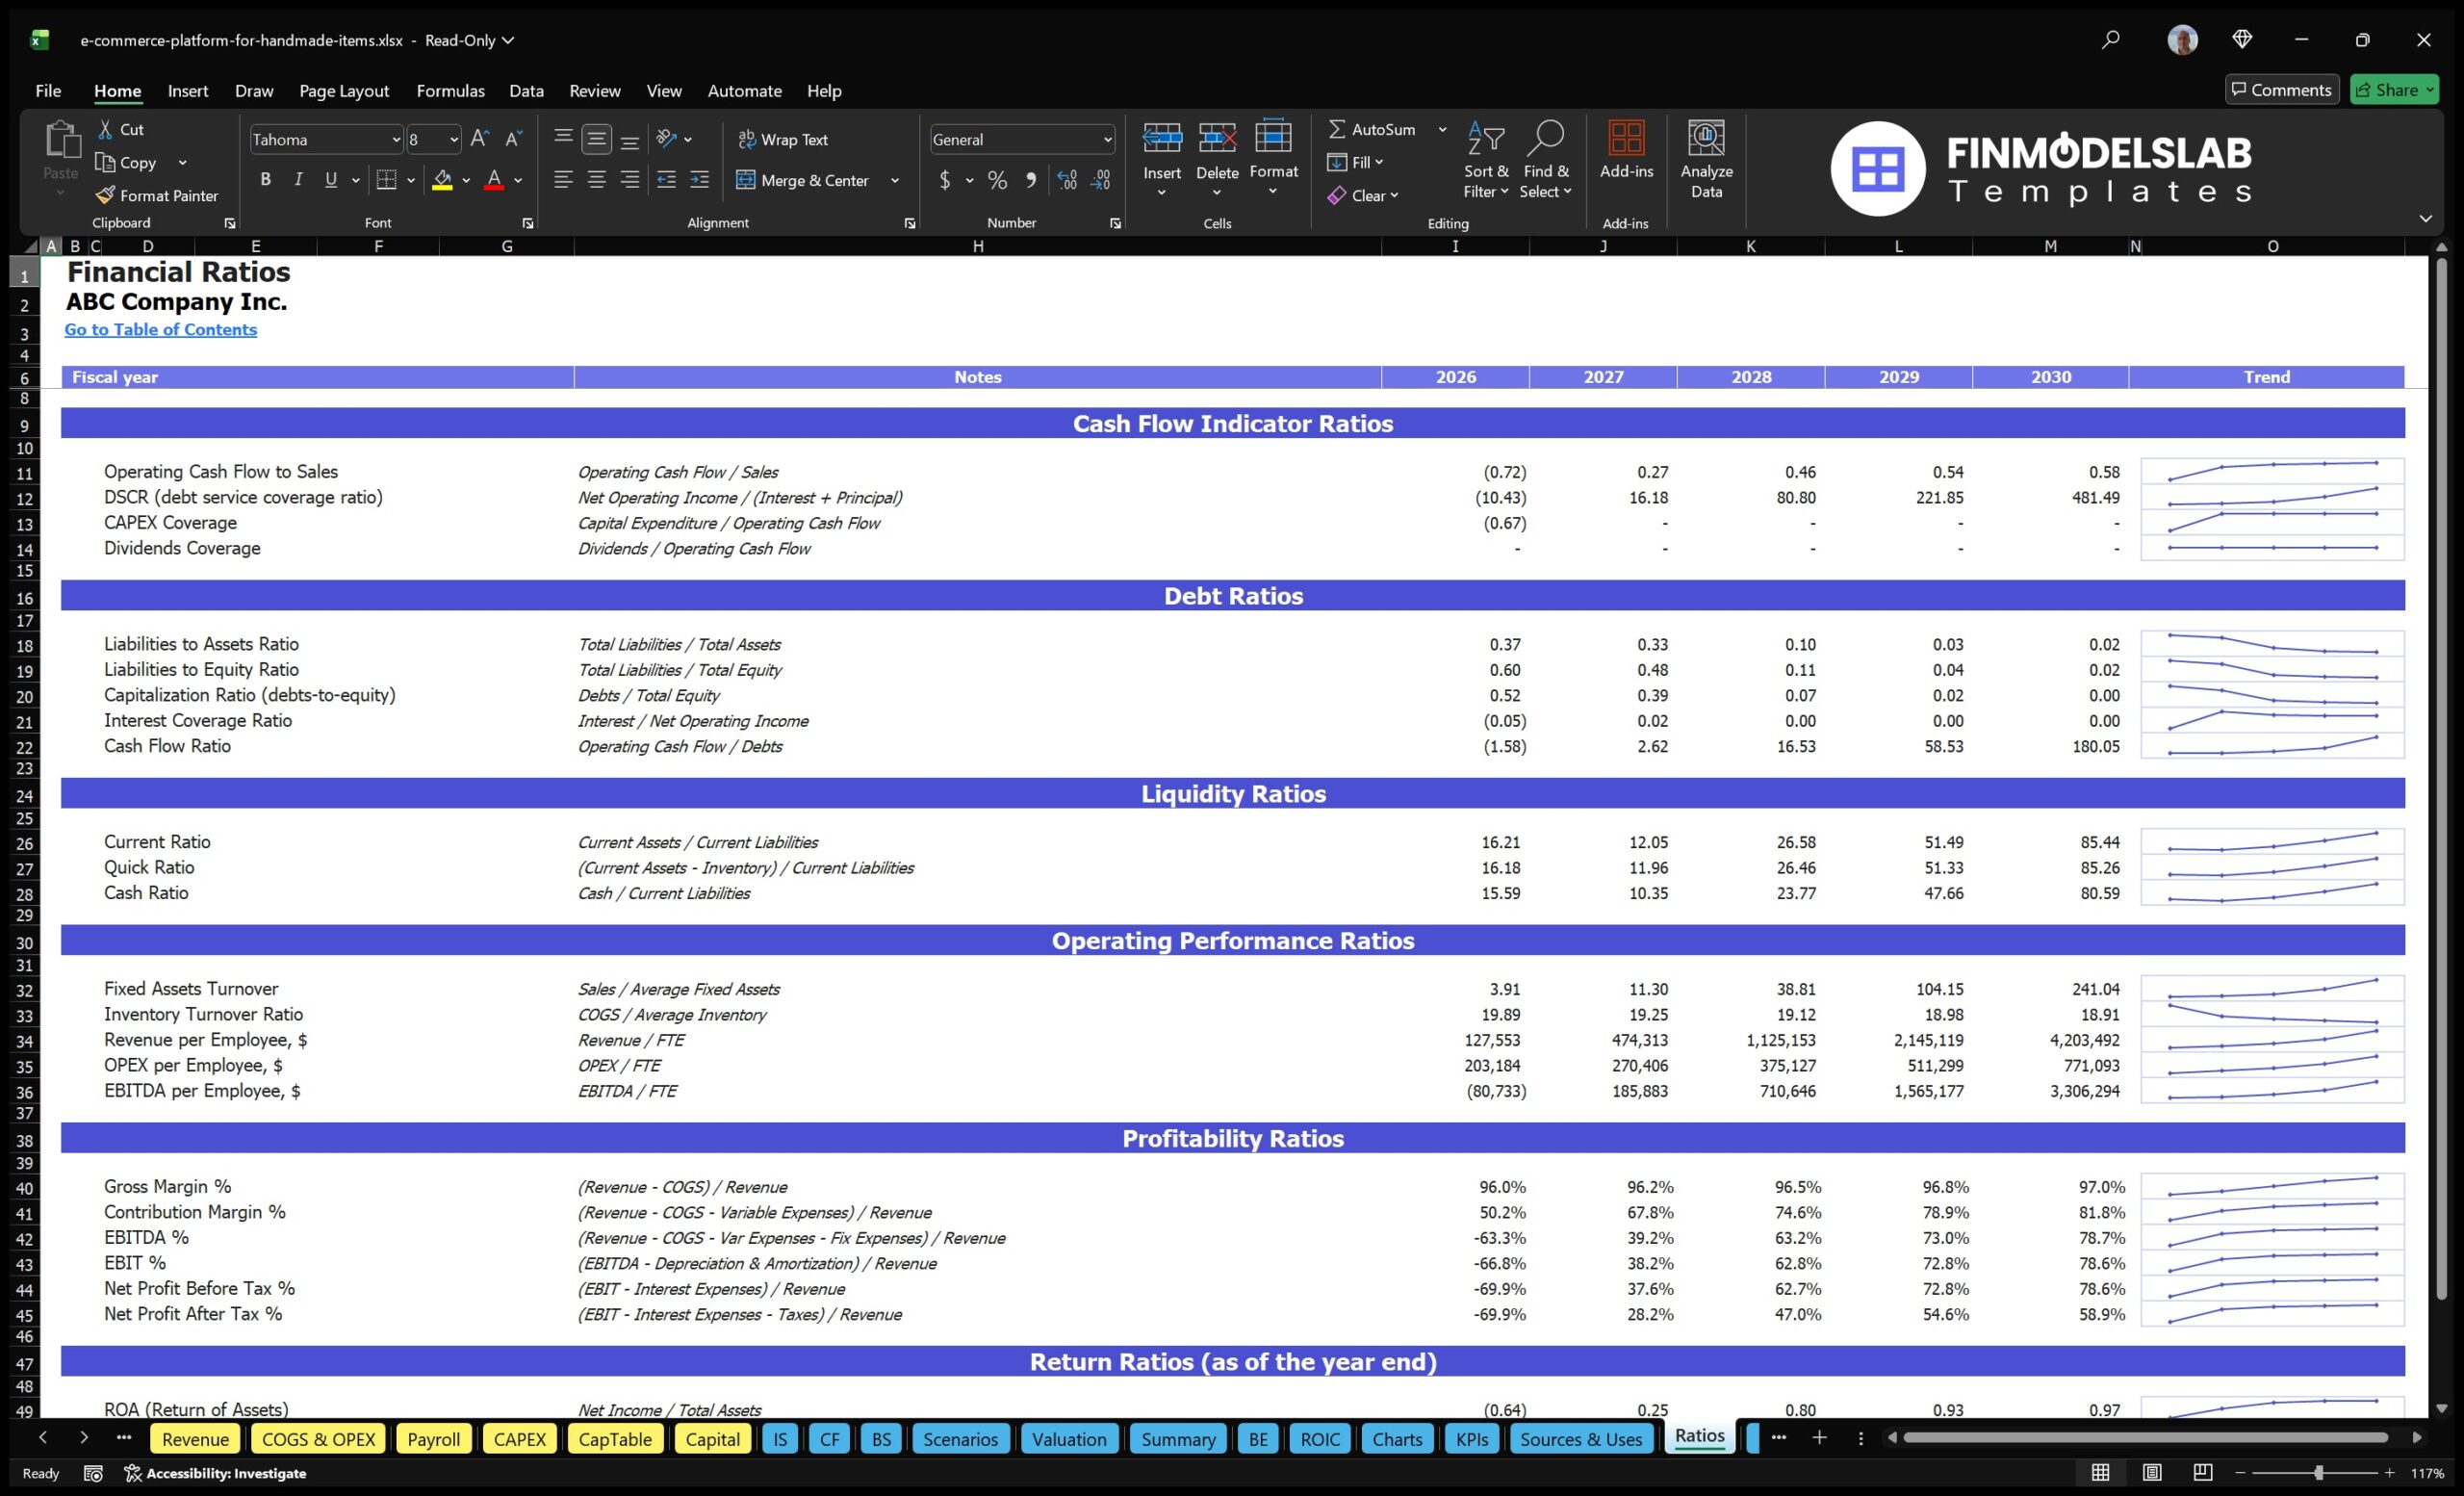
The KPI dashboard and performance benchmarks component helps users track the operating and financial metrics that matter most for a handmade goods marketplace. Key metrics may include Gross Merchandise Value, active sellers, active buyers, order frequency, average order value, take rate, customer acquisition cost, lifetime value, contribution margin, seller retention, buyer repeat purchase behavior, EBITDA margin, net profit margin, burn rate, and cash runway. The dashboard may also help users compare assumptions against relevant marketplace or e-commerce benchmarks, making it easier to validate whether growth, margins, and acquisition costs are realistic. This component is useful for both planning and ongoing management because it links financial outcomes to operational performance. If revenue grows but acquisition costs rise too quickly, the KPI dashboard can make the issue visible. If seller services become a strong source of high-margin income, the dashboard can highlight that opportunity. For investors and management teams, KPI tracking provides a more complete view of business quality than revenue alone.
Startup Cost Breakdown
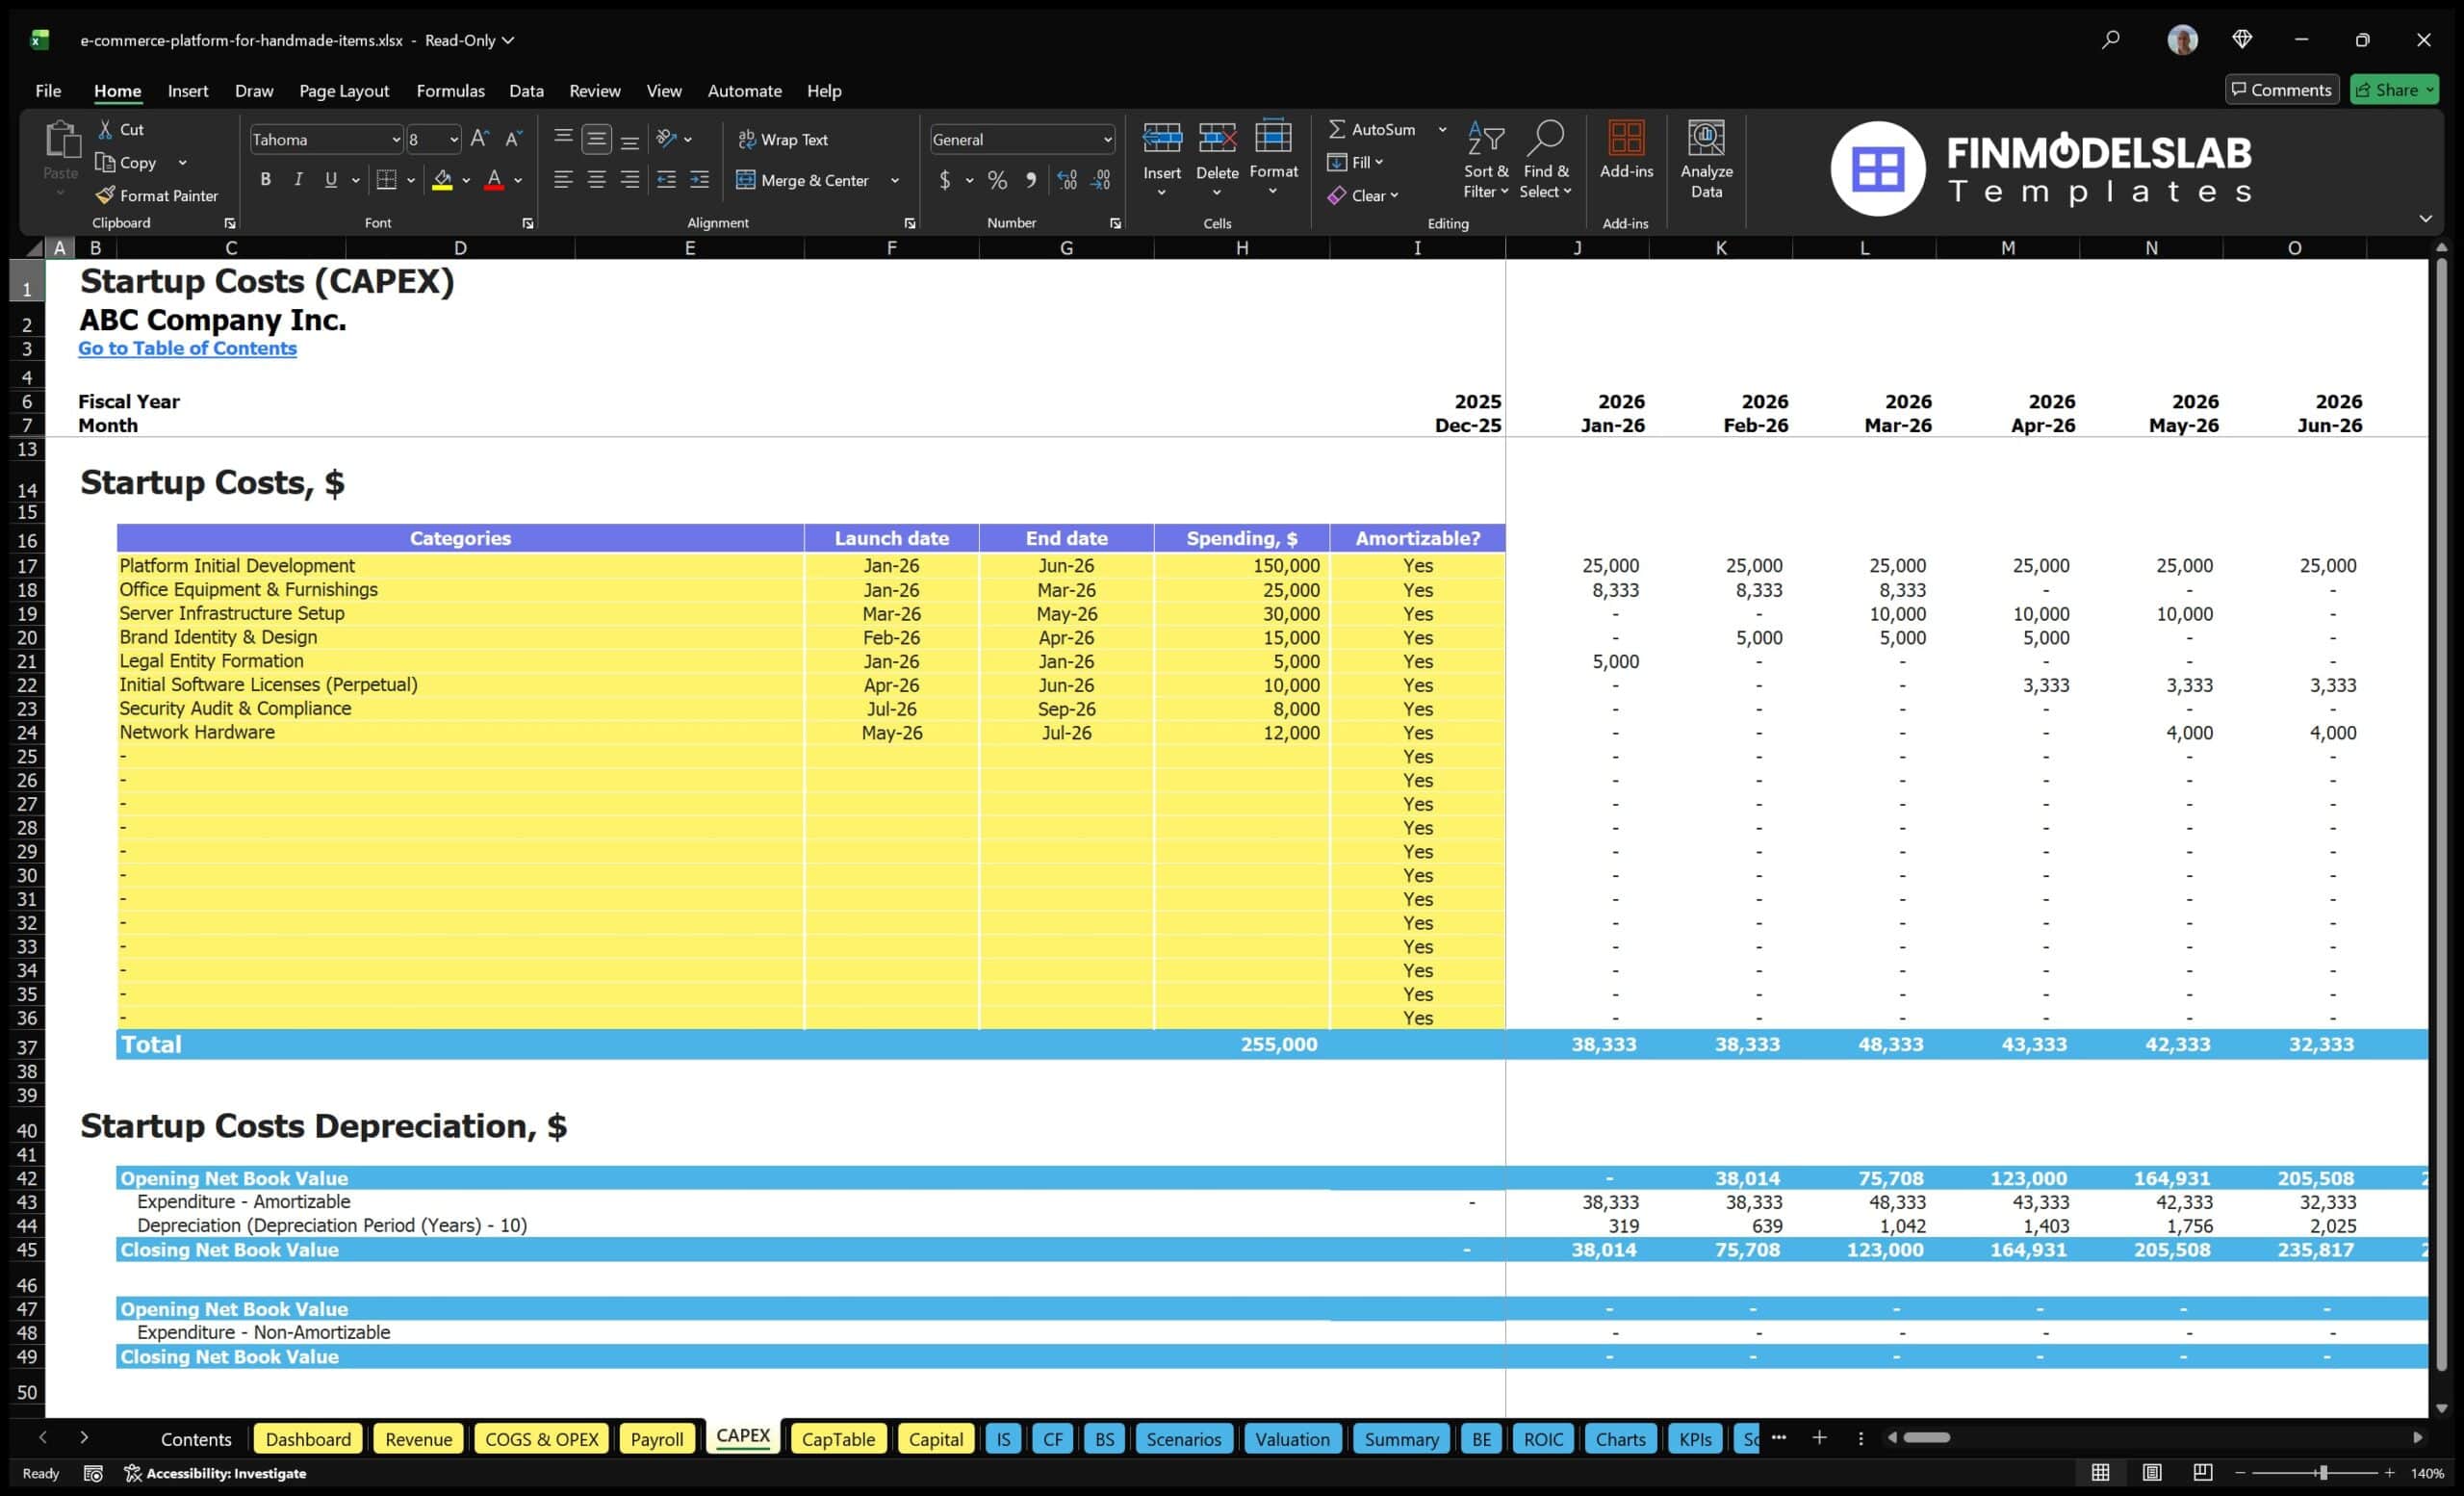
The startup cost breakdown component helps users estimate the initial investment required to prepare the handmade goods marketplace for launch. Startup costs may include platform development, marketplace software, payment integration, hosting setup, server infrastructure, user experience design, brand identity, legal formation, initial accounting support, business licenses, office equipment, pre-launch marketing, photography or content assets, seller onboarding materials, and initial working capital. Inputs can be customized to match the user’s launch strategy, whether the marketplace begins with a minimum viable platform, a custom-built technology stack, or a more developed launch with paid acquisition and a larger seller base. Outputs may include total startup capital required, timing of pre-opening expenses, funding gaps, and the amount of cash needed before meaningful revenue begins. This component is useful because many marketplace plans underestimate the cash required before launch and during the first months of growth. A clear startup cost breakdown supports investor requests, lender discussions, budget control, and more realistic planning around when the business can begin generating sustainable revenue.
Cash Flow Forecasting
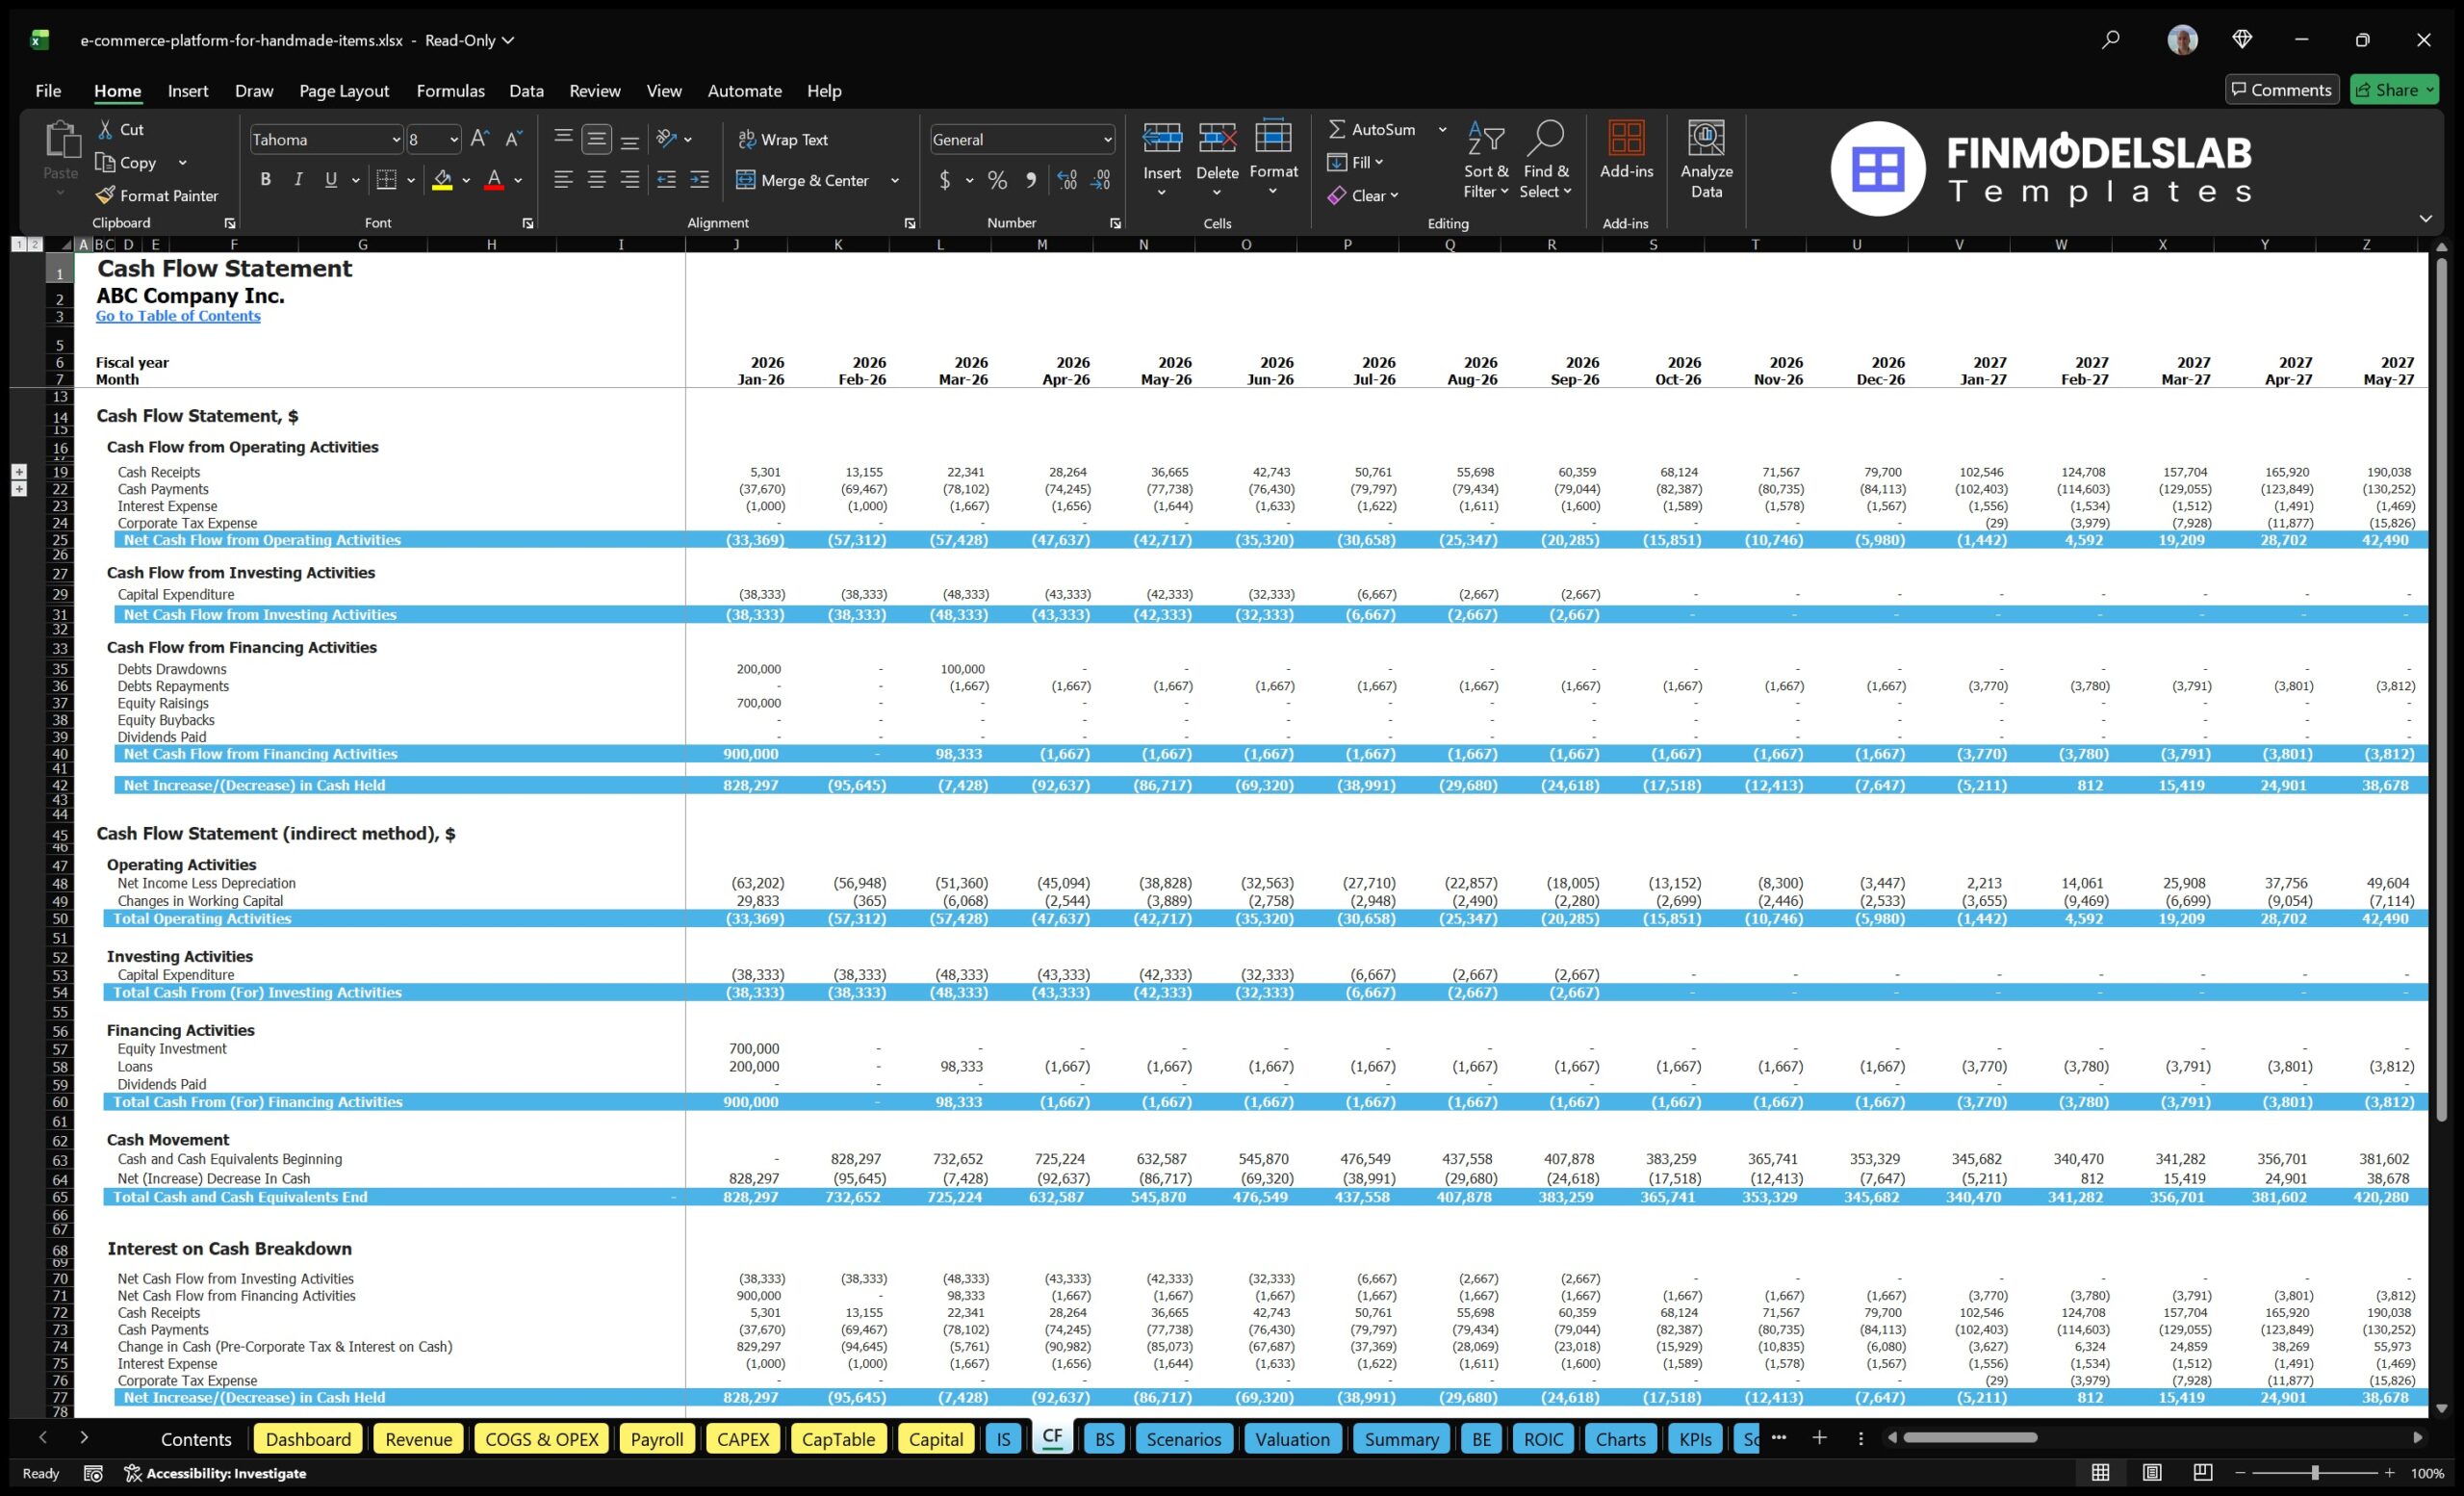
The cash flow forecasting component shows how money moves in and out of the handmade goods marketplace over time, helping users evaluate liquidity, working capital, funding needs, and cash runway. It may include cash inflows from commissions, subscriptions, seller services, financing proceeds, or other revenue streams, along with outflows for payroll, marketing, platform development, hosting, software subscriptions, professional fees, payment processing, office expenses, taxes, debt service, and capital expenditures. Outputs can include monthly cash balance, minimum cash point, operating cash flow, investing cash flow, financing cash flow, burn rate, and the timing of cash shortfalls or surpluses. This section is particularly important for marketplace businesses because profitability and cash flow do not always improve at the same pace, especially when early marketing spend, technology investment, and team hiring occur before revenue scales. By forecasting cash flow in detail, users can plan funding rounds, control spending, avoid liquidity surprises, and make better decisions about hiring, marketing budgets, development priorities, and growth timing.
File types:
Excel – Single-User: .xlsx
Excel – Multi-User: .xlsx
Similar ProductsOther customers were also interested in...


 HenrySheykin
Fashion Marketplace Financial Model Excel Template
The Fashion Retail Financial Model helps entrepreneurs, founders, business owners, consultants, and ... Read more
Etsy & Ebay Store Financial Model Excel Templa...
The Etsy and eBay Store Financial Model helps marketplace sellers, founders, consultants, and busine... Read more

Toys Marketplace Financial Model Excel Template
The Toy Marketplace Financial Model Template helps founders, entrepreneurs, consultants, analysts, a... Read more

Electronics Marketplace Financial Model Excel Temp...
The Online Marketplace Financial Model Template helps entrepreneurs, founders, consultants, analysts... Read more

Collectibles And Antiques Marketplace Financial Mo...
The Antique Store Financial Model helps entrepreneurs, business owners, consultants, founders, and a... Read more

 Pushkar
Online Car Rental – 3 Statement Financial Mo...
Online Car Rental Platform Business Plan Model is a perfect tool for a feasibility study on launchin... Read more

 Yash
Yash
Beauty on Demand Marketplace Financial Model
This Financial Model is related to Startup marketplace model operating in the space of Beauty on Dem... Read more
Online Clothing Store Financial Model Excel Templa...
The Online Clothing Store Financial Model helps founders, entrepreneurs, business owners, consultant... Read more

Online Services Marketplace Financial Model Excel ...
The Online Services Marketplace Financial Model helps founders, entrepreneurs, consultants, analysts... Read more

General Marketplace Financial Model Excel Template
The General Marketplace Financial Model Financial Model Template helps users plan, evaluate, and pre... Read more
You must log in to submit a review.