
0 ITEMS

Accessories Boutique Financial Model Excel Template
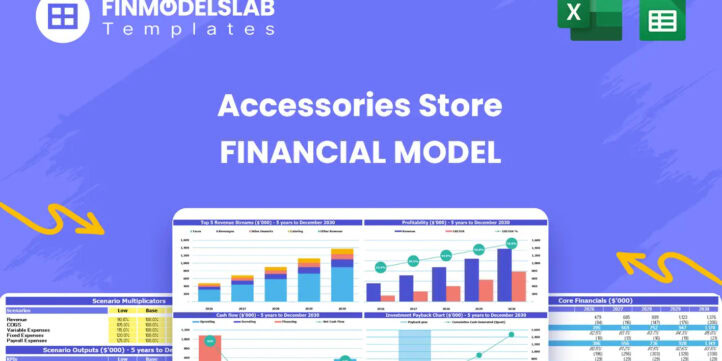
The Accessories Store Financial Model helps users turn a retail accessories concept into a structured five-year financial forecast. Built for boutiques selling items such as jewelry, handbags, scarves, hair accessories, and related fashion products, the template gives entrepreneurs and planners a practical way to estimate revenue potential, startup costs, operating expenses, payroll needs, inventory costs, cash flow, profitability, and funding requirements before launching or expanding the business. This financial model template is designed for founders, store owners, consultants, analysts, and anyone preparing a business plan, loan package, investor presentation, or internal budget. Instead of building a complex retail forecast from scratch, users can start with an organized model that connects customer traffic, conversion rates, repeat purchases, average units per order, product mix, cost of goods sold, staffing, rent, marketing, and other operating expenses. The result is a more complete view of how an accessories store may perform under realistic assumptions. The template supports financial planning and decision-making by helping users test revenue assumptions, understand monthly cash flow, evaluate profitability, and identify the point at which the business may break even. It also helps users compare different outcomes, prepare more professional financial reports, and communicate the store’s financial logic to lenders, investors, partners, or internal stakeholders. Fully editable inputs make it easy to tailor the model to a small boutique, mall kiosk, online-supported retail store, or growing accessories brand. With pre-built formulas, organized assumptions, visual summaries, and investor-ready outputs, the Accessories Store Financial Model gives users a time-saving framework for planning with more confidence. It is useful for estimating initial capital needs, reviewing operating budgets, modeling payroll, assessing margins, and deciding whether the business can support its cost structure over time. Whether used before launch or during expansion, it provides a practical financial foundation for evaluating opportunities, managing risk, and making better retail business decisions.


Financial Model Overview
The Accessories Store Financial Model is a ready-to-use financial model template designed to help entrepreneurs, retail founders, business owners, consultants, and analysts plan the financial performance of an accessories store. It is built around the practical drivers of a fashion accessories business, including store traffic, buyer conversion, repeat purchases, product mix, inventory costs, rent, payroll, marketing, and working capital. Instead of relying on rough estimates, users can organize their assumptions in one connected model and see how those assumptions flow into revenue, expenses, cash flow, profitability, investment needs, and investor-facing outputs. The template is especially useful for preparing a business plan, evaluating a new store launch, comparing growth strategies, applying for financing, or presenting a polished financial forecast to stakeholders. Because the model is editable, it can be adapted for a boutique accessories store, handbag shop, jewelry and scarf retailer, fashion kiosk, or a retail concept with both in-store and online sales channels.
All-in-One Dashboard
The all-in-one dashboard gives users a central view of the most important inputs and outputs in the Accessories Store Financial Model. This component is designed to bring together the core assumptions that drive the business, such as customer traffic, conversion rates, average units per transaction, pricing, revenue mix, cost structure, payroll, and key operating expenses. It also summarizes the outputs that matter most for planning and decision-making, including projected revenue, gross profit, EBITDA, cash flow, funding needs, and overall business performance. For an accessories store, this is useful because many small changes in traffic, product margins, or rent can materially affect profitability. The dashboard helps users quickly understand whether the store concept is financially viable, whether the assumptions are realistic, and where the business may need adjustment before launch or expansion. It also provides a practical summary for discussions with partners, advisors, lenders, and investors who need a clear snapshot without reviewing every detailed worksheet.
Low, Base, and High Scenario Analysis
The low, base, and high scenario analysis component allows users to test the Accessories Store Financial Model under different market and operating conditions. The base case may reflect the expected plan, while the low case can model slower customer traffic, weaker conversion, higher costs, or delayed growth, and the high case can reflect stronger demand, better margins, or more efficient operations. Inputs may include daily store visitors, visitor-to-buyer conversion rates, repeat customer percentages, units per order, product pricing, inventory costs, staffing levels, and operating expenses. The output helps users compare how revenue, profit, cash flow, and funding requirements change across scenarios. This is especially valuable for a retail accessories business because performance can be affected by seasonality, local foot traffic, fashion trends, supplier pricing, and marketing effectiveness. By reviewing multiple outcomes, users can build a more resilient business plan, prepare contingency strategies, set realistic targets, and understand which assumptions have the greatest impact on financial results.
Professional Charts
The professional charts component turns the financial forecast into presentation-ready visuals that make complex numbers easier to understand. The model can display trends such as revenue growth, expense movement, profitability improvement, cash balance changes, gross margin progression, and other financial metrics over the forecast period. For an accessories store, these charts help users communicate the story behind the numbers, such as how the business moves from early-stage investment and operating losses toward stronger sales, improved margins, and positive cash flow. Inputs come from the connected forecast worksheets, so updates to assumptions automatically flow through to the visual reports. This component is useful when preparing pitch decks, lender packages, board updates, internal planning materials, or management reviews. Instead of presenting only rows of numbers, users can show a clear visual path from launch costs and early customer acquisition to break-even, profitability, and longer-term growth. The charts also help identify trends that may require action, such as rising expenses, cash pressure, or slower-than-expected revenue growth.
ROE Components and DuPont Analysis
The ROE components and DuPont analysis section helps users examine return on equity by breaking it into the underlying drivers of performance. Rather than looking at a single return metric in isolation, this component can connect profitability, asset efficiency, and leverage to show how the accessories store generates returns for owners or investors. Inputs may include net income, equity investment, assets, liabilities, revenue, margins, and balance sheet assumptions. The outputs help users evaluate whether returns are being driven by healthy operating profitability, efficient use of assets, or financing structure. For a retail accessories store, this analysis is useful because inventory, build-out investment, working capital, and owner funding can all affect how efficiently capital is used. It can also help users explain the financial quality of the business to investors by showing whether future returns depend mainly on higher sales, better margins, improved cost control, or more efficient capital deployment. This makes the model more valuable for funding discussions and long-term performance planning.
Revenue Inputs
The revenue inputs component is where users define the assumptions that drive sales in the Accessories Store Financial Model. For a retail accessories business, revenue may be built from daily store visitors, conversion rates, new customer orders, repeat customer behavior, average units per transaction, product pricing, and the sales mix across categories such as statement jewelry, handbags, scarves, hair accessories, and similar items. Users can edit these assumptions to match the location, store format, customer profile, marketing strategy, and expected demand. The model then translates these inputs into projected revenue across the forecast period. This section is important because revenue is not treated as a single guess; it is connected to the operational logic of how shoppers enter the store, decide to buy, and return for additional purchases. By adjusting traffic, conversion, repeat purchase rates, and average order behavior, users can test what level of sales is required to support rent, payroll, inventory, marketing, and other expenses. This creates a more realistic foundation for planning and decision-making.
Bank-Ready Reports
The bank-ready reports component provides lender-friendly financial outputs that can support loan applications, funding conversations, and formal business planning. These reports may include projected profit and loss statements, cash flow forecasts, balance sheet summaries, capital requirements, debt service considerations, and key financial metrics that banks and financing partners often review. For an accessories store, lenders typically want to understand how much capital is needed, what the funds will be used for, whether the business can cover operating costs, and whether projected cash flow is sufficient to support repayment obligations. This component helps organize that information in a professional format so users can present a clearer financial case. Inputs from revenue, startup costs, expenses, payroll, and financing assumptions flow into the reports automatically, reducing the need to manually rebuild lender materials. The result is a more structured, credible financial package that can help users explain their business model, justify funding needs, and demonstrate how the store plans to move toward sustainable profitability.
Revenue Breakdown
The revenue breakdown component provides a detailed view of how different product streams contribute to total sales. In an accessories store, revenue may come from multiple categories such as handbags, jewelry, scarves, hair accessories, seasonal collections, gift items, and other fashion accessories. This section can help users define category-level pricing, sales mix, unit volume, and growth assumptions, then see how each stream contributes to overall revenue. It is useful because not all product categories have the same margins, demand patterns, inventory turnover, or marketing potential. A handbag category may generate higher average transaction value, while smaller accessories may create more frequent purchases or impulse buys. By separating revenue streams, users can identify which categories are most important to growth and profitability, evaluate how changes in product mix affect margins, and make better decisions about inventory purchasing, merchandising, supplier negotiations, and promotional strategy. This level of detail also strengthens business planning because it shows how the store expects to generate sales rather than relying on one broad revenue assumption.
KPI Dashboard
The KPI dashboard component tracks the key performance indicators that help users evaluate whether the accessories store is performing according to plan. Relevant metrics may include revenue growth, gross margin, EBITDA margin, cash balance, customer conversion rate, repeat purchase rate, average order size, units per transaction, inventory-related metrics, customer acquisition cost, and return metrics. This component is useful because financial statements show the outcome, while KPIs help explain what is causing that outcome. For example, if revenue falls below plan, the dashboard can help users determine whether the issue is lower traffic, weaker conversion, reduced order size, or product mix. If profitability is under pressure, users can review margin, payroll, rent, marketing, and inventory cost assumptions. The KPI dashboard also supports ongoing management after launch by giving owners and managers a clear set of metrics to compare against actual results. For planning, budgeting, funding, and investor updates, it provides a concise way to communicate progress, identify risks, and focus decisions on the drivers that matter most.
Startup Cost Breakdown
The startup cost breakdown component organizes the initial investment required to launch or expand an accessories store. This may include store build-out and renovation, display fixtures, furniture, point-of-sale equipment, initial inventory, website development, signage, licenses, deposits, insurance, professional fees, pre-opening marketing, packaging, technology tools, and opening working capital. Users can edit each cost line to match their specific store concept, location, size, and launch strategy. The output helps estimate the total capital required before the business begins generating meaningful revenue. This is critical for financial planning because underestimating startup costs can create cash shortages early in the business, while overestimating without detail can make funding requests less credible. A detailed startup budget also helps users decide which expenses are essential at launch, which can be delayed, and how much owner investment, bank financing, or investor funding may be needed. For lenders and investors, this section supports a clearer use-of-funds explanation and shows that the business has considered the real costs of opening a retail accessories operation.
Break-Even Analysis
The break-even analysis component helps users identify when the accessories store is expected to cover its costs and begin generating sustainable profit. This section may use revenue forecasts, gross margins, cost of goods sold, payroll, rent, marketing, utilities, payment processing fees, and other fixed and variable expenses to calculate the sales level or time period required to break even. For a retail accessories business, this is one of the most important planning outputs because early months often involve high setup costs, inventory purchases, customer acquisition spending, and gradual traffic growth. The model can help users understand how changes in conversion rates, average order value, product margins, or operating expenses affect the break-even timeline. This makes the section useful for pricing decisions, marketing planning, lease evaluation, inventory strategy, and funding preparation. It also provides a practical milestone for investors, lenders, and owners who want to know how long the business may require support before it becomes self-sustaining. By showing the path to break-even, the model helps users make more informed decisions about launch timing, capital reserves, and growth strategy.
File types:
Excel – Single-User: .xlsx
Excel – Multi-User: .xlsx
Similar ProductsOther customers were also interested in...

 HenrySheykin
Grocery Store Financial Model Excel Template
The Grocery Store Financial Model helps entrepreneurs, founders, consultants, analysts, and retail b... Read more
Coffee Shop Financial Model Excel Template
The Coffee Shop Financial Model helps entrepreneurs, founders, business owners, consultants, and ana... Read more
Online Clothing Store Financial Model Excel Templa...
The Online Clothing Store Financial Model helps founders, entrepreneurs, business owners, consultant... Read more
Spa Financial Model Excel Template
The Spa Financial Model helps entrepreneurs, spa owners, consultants, analysts, and business planner... Read more
Bar Financial Model Excel Template
The Bar Financial Model Financial Model Template helps entrepreneurs, bar owners, consultants, analy... Read more
Bakery Financial Model Excel Template
The Bakery Financial Model helps entrepreneurs, bakery owners, consultants, analysts, and business p... Read more
Pizzeria Financial Model Excel Template
The Pizza Restaurant Financial Model Template helps entrepreneurs, restaurant owners, consultants, a... Read more
Clothing Store Financial Model Excel Template
The Clothing Store Financial Model helps turn a retail apparel concept into a structured financial f... Read more
Bike Shop Financial Model Excel Template
The Bicycle Shop Financial Model helps entrepreneurs, business owners, consultants, analysts, and fo... Read more

Car Wash Service Financial Model Excel Template
The Car Wash Financial Model is a ready-to-use financial model template designed to help entrepreneu... Read more
You must log in to submit a review.