
0 ITEMS

Car Wash Service Financial Model Excel Template
The Car Wash Financial Model is a ready-to-use financial model template designed to help entrepreneurs, operators, consultants, analysts, and business plan writers evaluate the financial potential of a car wash venture without building a spreadsheet from scratch. It gives users a structured way to plan revenue assumptions, startup costs, operating expenses, payroll, cash flow, profitability, and funding needs for an automatic, express, or full-service car wash concept. Instead of relying on rough estimates, users can organize the main drivers of the business, such as daily vehicle visits, service pricing, membership volume, detailing revenue, retail add-ons, chemical costs, staffing, utilities, maintenance, and capital investment. This template is especially useful for founders preparing a car wash business plan, owners considering a new location, consultants developing financial projections for clients, and analysts evaluating investment feasibility. The model is built around editable inputs and pre-built formulas, allowing users to adjust assumptions based on their own market, site, pricing strategy, and operating plan. It helps translate operational decisions into financial outcomes, showing how changes in traffic volume, service mix, pricing, expenses, and staffing can affect revenue growth, margins, cash flow, and long-term profitability. The Car Wash Financial Model supports practical decision-making by connecting the key pieces of the forecast in one organized workbook. Users can review projected profit and loss, cash flow, balance sheet outputs, investor metrics, scenarios, visual charts, and KPI summaries. This makes it easier to understand whether the business can cover fixed and variable costs, when it may reach break-even analysis milestones, how much startup capital may be required, and what level of return may be possible over time. It also helps identify cash flow gaps before they become operational problems, which is important for funding discussions and lender preparation. Because the template is fully editable and compatible with Excel and Google Sheets, it can be customized for a startup car wash, an expansion project, a lender package, or an investor presentation. It gives users a professional financial planning framework that saves time, improves clarity, and supports more confident business decisions. Whether you are validating a new concept, preparing funding documents, comparing scenarios, or refining your operational budget, this model provides a clear structure for turning car wash assumptions into a complete financial forecast.
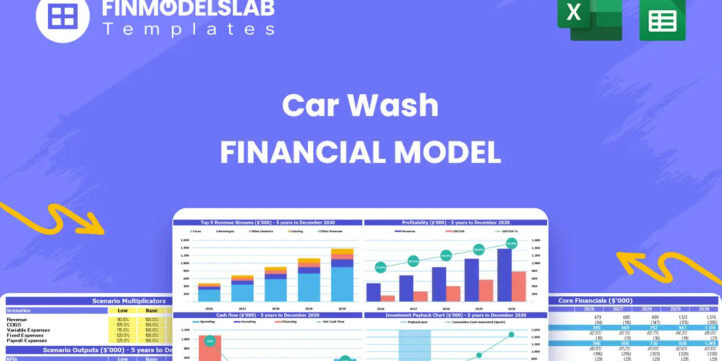


Financial Model Overview
The Car Wash Financial Model is a ready-to-use financial model template built to help entrepreneurs, car wash owners, consultants, analysts, and business plan writers evaluate the financial performance of a car wash business. It brings the main planning areas into one structured workbook, including revenue assumptions, operating costs, payroll, cash flow, investor metrics, financial statements, and scenario planning. For a car wash venture, financial planning depends heavily on daily vehicle traffic, service mix, recurring membership volume, pricing, detailing services, retail add-ons, chemical costs, labor efficiency, utilities, maintenance, and the capital required for land, construction, and equipment. This template gives users a practical way to connect those assumptions and see how the business may perform over time. Instead of starting from a blank spreadsheet, users can work from a model with editable inputs, automated calculations, organized outputs, and presentation-ready summaries. It is useful for startup planning, expansion analysis, lender discussions, investor presentations, internal budgeting, and ongoing decision-making.
All-in-One Dashboard
The all-in-one dashboard gives users a central view of the most important inputs and outputs in the Car Wash Financial Model. It is designed to make the financial plan easier to understand by bringing key assumptions and headline results into a single organized area. Users can enter or review major assumptions such as car wash traffic volume, service pricing, operating days, revenue mix, expense drivers, staffing levels, and investment requirements, then see how those assumptions flow into major financial outputs. The dashboard may summarize revenue, gross profit, EBITDA, net income, cash balance, payback period, and other important metrics that help assess whether the car wash business is financially viable. For a car wash, this is especially useful because small changes in daily visits, membership conversion, or average revenue per vehicle can have a major impact on profitability. The dashboard helps users quickly identify the relationship between operational activity and financial performance, making it easier to refine the business plan, communicate the opportunity to stakeholders, and support practical decisions before launch or expansion.
Low Base High Scenario Analysis
The low, base, and high scenario analysis section helps users compare different possible outcomes for the car wash business. Instead of relying on only one forecast, the model allows users to test how the projections change under conservative, expected, and optimistic assumptions. A low scenario may reflect weaker traffic, slower membership adoption, lower detailing sales, higher payroll costs, or increased utility expenses. A base scenario may reflect the most realistic operating plan, while a high scenario may reflect stronger customer volume, higher pricing, better service mix, or improved margins. This is valuable for planning because a car wash can be sensitive to location performance, seasonality, marketing success, weather, local competition, and customer retention. Scenario analysis helps users understand downside risk, upside potential, and the assumptions that have the greatest effect on revenue, margin, cash flow, and funding needs. It also gives lenders, investors, and business partners a clearer picture of how the business may perform under changing market conditions. By reviewing multiple cases, users can prepare more realistic funding requests, set stronger performance targets, and make better decisions about pricing, staffing, and growth strategy.
Professional Charts
The professional charts section turns key financial results into visual reports that are easier to interpret and present. The Car Wash Financial Model may include charts for revenue growth, profitability, cash flow, EBITDA, margins, expense categories, customer volume, and key performance trends over the forecast period. These charts help users move beyond rows of numbers and quickly identify patterns, risks, and opportunities. For example, a revenue chart can show how growth is affected by daily visits, membership plans, detailing services, and retail income, while a cash flow chart can highlight periods when the business may need additional funding. Visual reporting is especially useful when presenting to investors, lenders, partners, or internal teams because it makes the forecast easier to understand at a glance. The charts also help users validate whether the projections make sense over time, showing whether growth is realistic, whether expenses are scaling properly, and whether profitability improves as the business reaches higher operating volume. For business planning and funding documents, professional charts add clarity and polish while supporting a more confident financial story.
ROE Components and DuPont Analysis
The ROE components and DuPont analysis section helps users understand the drivers behind return on equity rather than only seeing the final return figure. In a capital-intensive car wash business, return on equity can be affected by profit margin, asset efficiency, and financial leverage. The DuPont framework breaks these elements apart so users can evaluate how operational performance and financing structure contribute to overall investor returns. Inputs may include net income, revenue, assets, equity, and debt-related assumptions, while outputs may show how margins, asset turnover, and leverage combine to produce ROE. This section is useful because a car wash often requires significant upfront capital for land, construction, tunnel equipment, vacuums, payment systems, signage, and site improvements. Investors and owners need to know whether that capital is being used efficiently and whether the business can generate an attractive return over time. By reviewing the components of ROE, users can identify whether returns are being driven by strong operating margins, efficient asset use, or financing choices. This helps support more informed investment analysis, capital planning, and stakeholder discussions.
Revenue Inputs
The revenue inputs section is where users define the commercial assumptions that drive the top line of the car wash forecast. This may include daily vehicle visits, operating days, pricing for basic washes, pricing for deluxe or premium washes, recurring membership plans, effective member pricing, detailing services, retail sales, and supplementary income per visit. These inputs are important because car wash revenue depends on both volume and mix. A location with strong traffic may still underperform if too many customers choose low-priced services, while a business with a strong membership program and profitable add-ons can improve average revenue per vehicle. The model allows users to adjust pricing, customer counts, sales mix, and service categories so they can see how changes affect monthly and annual revenue. It also helps users test strategies such as increasing membership penetration, promoting higher-margin services, adding detailing packages, or introducing retail products. For a business plan or investor presentation, this section provides a clear basis for revenue assumptions and helps users explain how the car wash intends to generate sales, grow customer activity, and improve revenue quality over time.
Bank-Ready Reports
The bank-ready reports section provides structured financial outputs that can support lender conversations, funding requests, and professional business planning. These reports may include profit and loss projections, cash flow forecasts, balance sheet forecasts, financing assumptions, profitability summaries, debt service considerations, and key investment metrics. Lenders typically want to understand whether the business can generate enough operating cash flow to cover expenses, repay debt, maintain liquidity, and withstand periods of lower performance. For a car wash, this is particularly important because the upfront investment can be large, and the business may require financing for land acquisition, construction, equipment, working capital, and launch costs. Bank-ready reports help users present the financial story in a format that is easier for stakeholders to review. They also help identify whether the requested funding amount is aligned with the projected cash flow needs of the business. By connecting assumptions to professional outputs, this section saves time and improves credibility for users preparing loan applications, investor materials, feasibility studies, or internal approval packages.
Revenue Breakdown
The revenue breakdown section provides a detailed view of how total car wash revenue is built from different revenue streams. Instead of showing only one total sales figure, the model separates income by service type, such as basic washes, deluxe washes, membership washes, detailing services, retail products, and other supplementary revenue. This helps users understand which parts of the business contribute the most to sales, margins, and growth. The section may use inputs such as service pricing, customer volume, sales mix percentages, membership adoption, detailing frequency, and retail income per visit to calculate the revenue contribution of each category. This is useful for planning because different car wash services can have different pricing, cost structures, customer behaviors, and margin profiles. A high-volume basic wash may generate steady traffic, while memberships may improve recurring revenue, and detailing or retail products may increase average revenue per customer. By reviewing the revenue breakdown, users can test different commercial strategies, refine pricing, prioritize marketing efforts, and identify the best opportunities to improve profitability. It also helps explain the business model clearly to lenders, investors, and partners.
KPI Dashboard
The KPI dashboard gives users a focused view of the operating and financial metrics that matter most for managing a car wash business. Key performance indicators may include daily visits, total annual visits, average revenue per vehicle, membership share, revenue growth, gross margin, EBITDA margin, cash balance, payback period, break-even timing, direct cost ratios, payroll as a percentage of revenue, and return metrics. This section helps users track whether the business is performing in line with expectations and whether the assumptions in the forecast are realistic. For a car wash, KPIs are especially valuable because profitability depends on a combination of traffic volume, pricing discipline, recurring customers, labor control, chemical usage, and equipment uptime. The KPI dashboard can also support benchmarking by allowing users to compare projected performance against industry norms or internal targets. This makes it useful not only for pre-launch planning but also for ongoing performance monitoring after the business opens. A clear KPI view helps owners and managers identify problems early, evaluate growth opportunities, and make decisions based on measurable financial and operational performance.
Startup Cost and CAPEX Planning
The startup cost and CAPEX planning section helps users estimate the initial investment required to launch or expand a car wash business. This component may include land acquisition, building construction, tunnel equipment, vacuum systems, water reclamation systems, payment terminals, signage, site preparation, permits, professional fees, opening inventory, pre-launch marketing, deposits, technology, and initial working capital. Because a car wash is often capital intensive, understanding the full startup budget is critical before seeking financing or committing to a location. The model helps users organize each cost category and calculate the total funding requirement before operations begin. It can also separate one-time capital expenditures from recurring operating expenses, which makes the forecast more accurate and easier to explain. This section is useful for entrepreneurs preparing a business plan, owners evaluating a new site, or investors reviewing project feasibility. By creating a detailed startup cost plan, users can reduce the risk of underfunding, identify the largest cost drivers, compare project alternatives, and determine how much debt, equity, or working capital support may be needed to reach launch and early operations.
Break-Even Analysis
The break-even analysis section helps users determine when the car wash business may begin covering its fixed and variable costs from operating revenue. This component may use inputs such as service pricing, customer volume, sales mix, direct costs, payroll, rent or property costs, utilities, insurance, maintenance, marketing, and other overhead expenses to estimate the revenue or vehicle volume required to break even. For a car wash, break-even analysis is highly practical because operators need to know how many vehicles per day are required to support the cost structure and how changes in pricing or membership mix affect that threshold. The section can help users evaluate whether projected traffic is realistic for the selected location and whether the business has enough margin to absorb lower-than-expected demand. It is also useful for setting sales targets, planning marketing campaigns, designing membership offers, and discussing financial feasibility with lenders or investors. By showing the path to profitability in a clear way, the break-even analysis helps users understand the operational milestones the business must reach and supports better decision-making around launch timing, funding needs, and growth strategy.
File types:
Excel – Single-User: .xlsx
Excel – Multi-User: .xlsx
Similar ProductsOther customers were also interested in...



 Giorgos
Car Wash Financial Model – Dynamic 10 Year B...
Financial Model providing a dynamic up to 10-year financial forecast for a startup or existing Car W... Read more

 Pushkar
Online Car Rental – 3 Statement Financial Mo...
Online Car Rental Platform Business Plan Model is a perfect tool for a feasibility study on launchin... Read more
 D'Errico Financial S...
Car Wash Development Model
The Car Wash Development model projects annual future cash flows from a car wash facility from the p... Read more

 Andreas
Start Up Car Park Excel Model and Valuation
This detailed, yet easy to use three statement financial model will allow you to calculate your busi... Read more

Car Dealership Financial Model – Dynamic 10 Year...
A car dealership, or car dealer, is a business that sells new or used cars, at the retail level, bas... Read more
Gas Station Financial Model – Dynamic 10 Year Fo...
Financial model presenting a business scenario of a Gas Station, which is either purchased or leased... Read more

 City Finance
EV Charging Station Finance Model
Provides a comprehensive analysis of the financial viability and potential returns on investment for... Read more

 Jair
Car Wash Financial Model and Budget Control Templa...
The financial model for a car wash business is a comprehensive tool that enables owners and investor... Read more
 HenrySheykin
Spa Financial Model Excel Template
The Spa Financial Model helps entrepreneurs, spa owners, consultants, analysts, and business planner... Read more
You must log in to submit a review.