
0 ITEMS

Sandwich Bar Financial Model Excel Template
The Sandwich Shop Financial Model is a ready-to-use financial model template designed to help entrepreneurs, founders, consultants, analysts, and small business owners build a clear financial forecast for a sandwich shop concept. It gives users a structured way to estimate revenue assumptions, startup costs, operating expenses, payroll needs, ingredient costs, cash flow, profitability, and funding requirements before launching or expanding. Instead of starting with a blank spreadsheet, users can work from a practical model built around the financial drivers that matter most in a food service business, including customer traffic, average order value, menu mix, cost of goods sold, staffing, and monthly operating performance. This template is especially useful for anyone preparing a business plan, loan application, investor presentation, internal budget, or feasibility analysis. It helps users explain how the sandwich shop may generate sales, how much capital may be required to open, what monthly costs need to be covered, and when the business may reach sustainable profitability. The model is fully editable, allowing users to replace the pre-filled assumptions with their own pricing, daily covers, weekend demand, menu categories, supplier costs, rent, payroll, marketing budget, equipment purchases, and financing structure. This makes it suitable for both first-time founders and experienced operators who want a faster, more organized planning process. The Sandwich Shop Financial Model also supports stronger decision-making by connecting operating assumptions to financial outcomes. Users can review projected profit and loss, cash flow, financial returns, scenario results, key performance indicators, and break-even analysis in one place. This makes it easier to test whether the business can handle slower sales periods, higher ingredient costs, additional staff, or expansion plans. For lenders and investors, the template provides a clean and professional way to present revenue forecasts, expense planning, profitability metrics, and cash flow projections without relying on disconnected estimates. Built for Microsoft Excel and Google Sheets, the model is flexible enough to support a new sandwich shop, a quick-service café, a food counter, or an existing location planning growth. It saves time, improves financial clarity, and helps users turn a food business idea into a structured financial plan that can be reviewed, updated, shared, and presented with confidence.
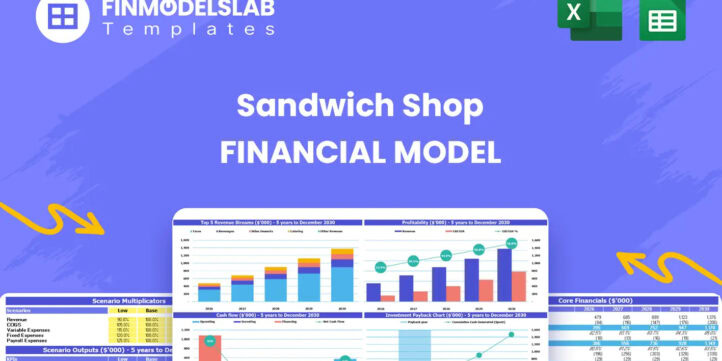


![Excel dashboard with scenario analysis: 5-year revenue, gross margin, and EBITDA charts for 2026–2030 (Scenario Analysis).] ,](https://www.efinancialmodels.com/wp-content/uploads/edd/2026/06/sandwich-shop-financial-model-scenarios-financialmodelslab_d3a0fbeb-3ffc-4e5b-b9fc-d5d9955747bf-scaled.jpg "sandwich-shop-financial-model-scenarios-financialmodelslab_d3a0fbeb-3ffc-4e5b-b9fc-d5d9955747bf | eFinancialModels")


Financial Model Overview
The Sandwich Shop Financial Model is a practical financial model template built to help users plan, test, and present the economics of a sandwich shop business. It brings together the core assumptions needed to estimate revenue, ingredient costs, payroll, operating expenses, startup investment, cash flow, profitability, and investor returns in one organized workbook. For a sandwich shop, financial performance depends on a mix of daily customer traffic, average order value, menu mix, supplier costs, staffing levels, rent, marketing, equipment needs, and repeat demand. This model helps connect those operating drivers to financial outputs so entrepreneurs, business owners, consultants, analysts, lenders, and investors can evaluate the business with greater clarity. The template is editable, structured, and suitable for business planning, funding preparation, budgeting, feasibility analysis, and internal decision-making, giving users a faster alternative to building a restaurant forecast from scratch.
All-in-One Dashboard
The all-in-one dashboard gives users a central view of the most important inputs and outputs in the Sandwich Shop Financial Model. Instead of moving through disconnected spreadsheet tabs to understand performance, the dashboard organizes key assumptions and summary results in one place. Users can review the main revenue drivers, cost assumptions, projected sales, margins, profit indicators, cash position, and other financial outputs that show how the sandwich shop is expected to perform. This is especially helpful for founders and managers who need to quickly understand whether the business plan is financially realistic. The dashboard can support meetings with lenders, investors, partners, or internal stakeholders by translating detailed calculations into a clear planning view. Because the template is editable, users can update assumptions such as customer traffic, average order value, menu categories, ingredient costs, payroll, and operating expenses, then use the dashboard to immediately see how those changes affect the overall financial outlook.
Low, Base, and High Scenario Analysis
The low, base, and high scenario analysis section helps users test how the sandwich shop may perform under different business conditions. A food service business can be affected by customer traffic, local competition, weather, seasonality, price sensitivity, delivery demand, supplier pricing, and staffing constraints, so relying on a single forecast can create planning risk. This component allows users to compare a conservative case, a realistic base case, and an upside case by adjusting core assumptions such as daily covers, weekday and weekend sales, average order value, catering demand, menu mix, cost of goods sold, and operating expenses. The outputs show how changes in these assumptions may affect revenue, profit margins, cash flow, and financial returns. This is useful for building a more resilient business plan because users can identify what happens if sales are slower than expected, if expenses rise, or if demand exceeds the original forecast. It also helps demonstrate to lenders and investors that the business has been stress-tested rather than planned around only the most optimistic outcome.
Professional Charts
The professional charts component turns the financial forecast into a more visual and presentation-ready planning tool. Financial statements and spreadsheet tables are useful for detailed analysis, but charts make it easier to communicate trends, performance patterns, and key metrics to stakeholders who need a quick understanding of the business. This section can display items such as revenue growth, profitability, expense composition, cash flow movement, margins, and financial performance over the forecast period. For a sandwich shop, visualizing these outputs helps users see whether sales are scaling as expected, whether costs are staying under control, and whether the business is moving toward sustainable profitability. The charts can be used in business plans, funding discussions, internal planning meetings, and strategy reviews. They also help simplify complex financial data for non-financial users by showing the relationship between assumptions and outcomes in a clear format. Because the model is editable, the visuals update as users refine assumptions, making the charts a practical tool for both planning and presentation.
ROE Components and DuPont Analysis
The ROE components section uses DuPont-style analysis to help users understand the drivers behind return on equity. For a sandwich shop, profitability is not only about generating sales; it is also about managing margins, using assets efficiently, and balancing financing decisions. This component breaks return performance into more detailed financial drivers, helping users see whether returns are supported by operating profitability, asset utilization, or leverage. Inputs may include net income, revenue, total assets, equity, debt, margins, and balance sheet assumptions, while outputs help show how efficiently the business converts invested capital into returns. This is valuable for investors, owners, and financial analysts who want a deeper view of performance beyond simple profit totals. It can also help identify areas for improvement, such as raising margins through better supplier pricing, improving asset productivity through higher customer volume, or adjusting the capital structure. By including this analysis, the Sandwich Shop Financial Model supports a more professional evaluation of business quality and shareholder return potential.
Revenue Inputs
The revenue inputs section is one of the most important parts of the Sandwich Shop Financial Model because it defines how the business is expected to generate sales. For a sandwich shop, revenue assumptions may include daily customer traffic, weekday and weekend covers, average order value, menu pricing, product mix, catering sales, beverages, desserts, delivery, takeaway, and growth over time. This component gives users a structured way to enter researched or customized assumptions instead of relying on a single top-line sales estimate. The model can then calculate projected revenue based on the actual drivers of the business, making the forecast more transparent and easier to defend. Users can adjust assumptions to reflect their location, foot traffic, seating capacity, menu strategy, opening hours, delivery channels, and expected marketing impact. This is useful for business planning because it shows exactly what must happen operationally to reach the projected revenue level. It also helps lenders and investors evaluate whether the sales forecast is realistic based on customer volume and spending behavior.
Bank-Ready Reports
The bank-ready reports component organizes financial outputs in a format that supports loan applications, funding discussions, and professional stakeholder review. Banks and lenders typically want to see startup costs, monthly projections, cash flow, profit estimates, repayment capacity, and the assumptions behind the forecast. This section helps users present that information in a clear and lender-friendly way, reducing the time spent reformatting spreadsheets or answering basic financial questions. Outputs may include projected profit and loss, cash flow, balance sheet summaries, funding needs, profitability metrics, debt service considerations, and key operating assumptions. For a sandwich shop seeking financing for build-out, equipment, inventory, working capital, or launch expenses, this component helps show how the business plans to use capital and how it may generate enough cash to operate and repay obligations. The reports are useful for founders preparing loan packages, consultants creating business plans for clients, and existing operators seeking expansion funding. A clean reporting structure can also improve credibility by making the financial plan easier to review.
Revenue Breakdown
The revenue breakdown section provides a detailed view of sales by revenue stream, helping users understand which parts of the sandwich shop business are expected to drive performance. Rather than treating all revenue as one category, the model can separate income from menu items such as sandwiches, beverages, desserts, baked goods, catering, delivery, or other add-on products depending on how the user customizes the template. This allows users to evaluate the contribution of each revenue stream to total sales and identify where growth or margin improvement may come from. Inputs may include sales mix percentages, pricing, customer counts, order frequency, and growth assumptions, while outputs show projected revenue by category across the forecast period. This is useful for menu planning, marketing strategy, inventory decisions, and profitability analysis because different products often have different margins and demand patterns. For example, high-margin drinks or catering orders may significantly improve overall profitability if they become a larger share of sales. The revenue breakdown helps users make informed decisions about pricing, promotions, and product focus.
KPI Dashboard and Performance Benchmarks
The KPI dashboard and performance benchmarks section helps users monitor the financial and operational metrics that matter most for a sandwich shop. Key performance indicators may include revenue growth, gross margin, EBITDA, net profit margin, cash balance, average order value, customer volume, labor cost as a percentage of revenue, cost of goods sold, break-even timing, and return metrics. The benchmark element gives users a way to compare planned performance against expected food service or restaurant finance standards, helping them assess whether assumptions are realistic. This component is useful because it focuses attention on the numbers that drive decision-making rather than only showing full financial statements. Owners can use it to track progress against goals, consultants can use it to validate a client forecast, and investors can use it to evaluate whether the business is operating within reasonable margin and efficiency ranges. By combining KPIs with benchmarks, the template helps users identify strengths, risks, and improvement opportunities in areas such as pricing, supplier costs, staffing, and revenue growth.
Startup Cost and Capital Expenditure Planning
The startup cost and capital expenditure planning section helps users estimate the initial investment required to open or expand a sandwich shop. A food service business often requires spending before revenue begins, including lease deposits, interior build-out, signage, kitchen equipment, refrigeration, smallwares, point-of-sale systems, initial inventory, permits, licensing, branding, launch marketing, professional fees, and working capital reserves. This component organizes those costs so users can understand the total funding requirement and avoid underestimating the capital needed to reach opening day. Inputs may include individual cost items, timing of purchases, useful life assumptions, depreciation treatment, and funding sources. Outputs can help show total startup capital, capital expenditures, pre-opening cash needs, and the amount of initial financing required. This is valuable for founders preparing a business plan, lenders reviewing a loan request, and operators comparing different launch strategies or locations. A clear startup cost plan also supports better negotiation with suppliers, landlords, contractors, and financing partners because users can see how each investment affects the overall budget.
Break-Even and Cash Flow Forecasting
The break-even and cash flow forecasting section helps users evaluate when the sandwich shop may begin covering its fixed and variable costs and whether it has enough liquidity to operate comfortably. Break-even analysis uses assumptions such as sales, gross margin, ingredient costs, labor, rent, utilities, marketing, insurance, and other operating expenses to estimate the level of revenue or customer volume needed to become profitable. Cash flow forecasting then shows how money moves through the business over time, including startup funding, monthly receipts, operating payments, payroll, tax obligations, capital spending, financing inflows, and debt service if applicable. This component is critical because a business can appear profitable on paper while still experiencing cash pressure due to timing, upfront expenses, or growth-related working capital needs. For a sandwich shop, cash flow planning helps users prepare for slow months, build a reserve, manage supplier payments, and avoid shortfalls. It also gives lenders and investors a practical view of financial sustainability by showing how the business may fund operations until it reaches stable profitability.
File types:
Excel – Single-User: .xlsx
Excel – Multi-User: .xlsx
Similar ProductsOther customers were also interested in...


 HenrySheykin
Cigar Lounge Financial Model Excel Template
The Cigar Lounge Financial Model helps entrepreneurs, business owners, consultants, analysts, and fo... Read more
Juice Bar Financial Model Excel Template
The Juice Bar Financial Model helps entrepreneurs, founders, consultants, analysts, and business own... Read more

Wine Bar Financial Model Excel Template
The Wine Bar Financial Model helps entrepreneurs, founders, consultants, analysts, and hospitality b... Read more

Tapas Bar Financial Model Excel Template
The Tapas Bar Financial Model helps entrepreneurs, restaurant founders, business owners, consultants... Read more

Snack Bar Financial Model Excel Template
The Snack Bar Financial Model helps entrepreneurs and planners turn a food service concept into a st... Read more

Beer Bar Financial Model Excel Template
The Craft Beer Bar Financial Model helps entrepreneurs, founders, bar owners, consultants, and analy... Read more

Sports Bar Financial Model Excel Template
The Sports Bar Financial Model Financial Model Template helps entrepreneurs, founders, business owne... Read more
Karaoke Bar Business Plan Financial Model Excel Te...
The Karaoke Bar Financial Model helps entrepreneurs, business owners, consultants, founders, and ana... Read more
All Day Bar & Restaurant Financial Model Excel...
The All-Day Restaurant Financial Model helps users turn a food and beverage concept into a structure... Read more
 Giorgos
All-day Restaurant and Bar – 5 Year Financial Mo...
Financial Model providing advanced financial planning & analysis for an All-day Restaurant &... Read more
You must log in to submit a review.