
0 ITEMS

BBQ Restaurant Financial Model Excel Template
The BBQ Restaurant Financial Model Financial Model Template helps entrepreneurs, restaurant owners, consultants, analysts, and business plan writers turn a BBQ concept into a structured financial forecast. Instead of relying on rough estimates, users can map out the main drivers of the business, including daily customer volume, average order value, menu mix, food costs, labor needs, startup costs, operating expenses, cash flow, profitability, and funding requirements. It is designed to support planning for a new BBQ restaurant, mobile BBQ concept, smokehouse, casual dining location, or expansion of an existing food service business. This template gives users a practical framework for building investor-ready and lender-friendly projections without starting from a blank spreadsheet. It connects revenue assumptions with cost of goods sold, payroll, overhead, capital investment, and financing so users can see how operational decisions affect the financial outcome. By adjusting assumptions such as weekday and weekend traffic, pricing, food cost percentages, staffing levels, rent, marketing, and supplier costs, buyers can test whether the restaurant can generate enough sales to cover expenses and reach sustainable profitability. The model is useful for preparing business plans, loan applications, investor presentations, internal budgets, and strategic decision-making. It helps users estimate how much capital may be needed before opening, how monthly cash flow may perform after launch, and when the business may reach break-even. It also supports ongoing planning by showing how changes in sales volume, margins, payroll, or fixed costs can affect profit and cash reserves over a multi-year forecast period. Built for both financial and non-financial users, the BBQ Restaurant Financial Model Financial Model Template is editable, organized, and ready to customize in Excel or Google Sheets. It helps users review the business from multiple angles, including revenue potential, expense control, return expectations, liquidity, and performance benchmarks. Whether you are validating a startup idea, comparing scenarios, seeking funding, or refining an operating plan, this template provides a clear financial planning structure for making better decisions before committing time, money, and resources.
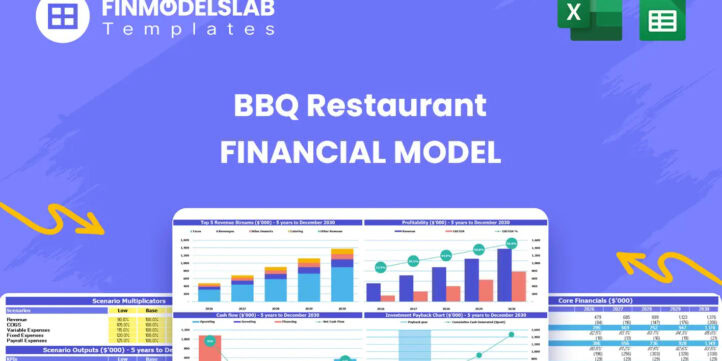


Financial Model Overview
The BBQ Restaurant Financial Model Financial Model Template gives entrepreneurs, restaurant operators, consultants, analysts, and business plan writers a structured way to evaluate the financial potential of a BBQ restaurant before launch, expansion, or funding discussions. A BBQ restaurant depends on many connected assumptions, including daily covers, average order value, food and beverage mix, meat and ingredient costs, kitchen labor, front-of-house staffing, rent, utilities, equipment, marketing, and working capital. This template brings those assumptions into one editable financial model so users can forecast revenue, costs, cash flow, profitability, investment needs, and financial performance over a multi-year period. It is designed to help replace guesswork with a clear planning process, making it easier to prepare investor-ready projections, review lender expectations, assess break-even timing, and understand whether the business can support its cost structure under realistic operating conditions.
All-in-One Dashboard
The all-in-one dashboard gives users a central place to review the most important inputs and outputs of the BBQ Restaurant Financial Model. This component is useful because restaurant planning often involves many moving parts, and the dashboard helps connect the commercial assumptions with the financial results in a single view. Users can review key inputs such as launch timing, revenue drivers, menu pricing, customer traffic, cost assumptions, staffing levels, and expense categories, then see how those assumptions flow into revenue, gross margin, EBITDA, net profit, cash flow, and return metrics. For a BBQ restaurant, this is especially valuable because changes in meat prices, labor scheduling, weekend demand, catering activity, and average check size can quickly affect profitability. The dashboard helps business owners, founders, and advisors monitor the overall model without getting lost in individual worksheets, making it easier to prepare for meetings, update assumptions, and communicate the financial story to investors, lenders, or internal stakeholders.
Low, Base, and High Scenario Analysis
The low, base, and high scenario analysis component helps users test how the BBQ restaurant may perform under different market and operating conditions. Instead of relying on one fixed forecast, users can compare a conservative case, a realistic base case, and an optimistic growth case. Inputs may include daily customer volume, average order value, food cost percentage, beverage sales, catering revenue, payroll levels, rent, marketing spend, supplier pricing, and operating efficiency. The outputs can show how each scenario affects revenue, margins, cash flow, profitability, break-even timing, and funding needs. This is particularly helpful for a BBQ restaurant because traffic patterns can vary by weekday, weekend, season, local events, delivery demand, and customer loyalty. A founder can use the low case to understand downside risk, the base case to support the main business plan, and the high case to evaluate expansion opportunities or additional hiring. For funding discussions, scenario analysis shows that the plan has been stress-tested and that management understands the financial impact of uncertainty.
Professional Charts
The professional charts component translates the financial model into visual outputs that are easier to review, explain, and present. Rather than forcing stakeholders to interpret rows of numbers, the charts can show trends in revenue, operating expenses, gross profit, EBITDA, net income, cash balance, and other key metrics over time. For a BBQ restaurant business plan, visual reporting is useful because investors and lenders often want to quickly understand whether sales are growing, costs are controlled, and cash flow remains stable. The charts may highlight monthly ramp-up after launch, annual revenue growth, cost composition, profit margin progression, and cash balance movement. Users can include these visuals in pitch decks, loan packages, board updates, management reviews, or internal planning documents. The value of this component is not only presentation quality, but also decision support, because visual trends can reveal whether the restaurant is becoming more efficient, whether margins are improving, or whether cash pressure is building before it becomes a serious operational problem.
ROE Components and DuPont Analysis
The ROE components and DuPont analysis section helps users understand return on equity by breaking it into underlying financial drivers. Rather than looking only at a single return figure, this component can show how profitability, asset efficiency, and leverage contribute to overall equity returns. In a BBQ restaurant financial model, this can be useful for investors, owners, and lenders who want to see whether returns are being generated by strong operating margins, efficient use of invested assets, or financing structure. Inputs may include net income, sales, total assets, equity investment, debt financing, and retained earnings. Outputs can include return on equity, profit margin, asset turnover, and leverage-related ratios. This section supports a more sophisticated investment analysis because it helps identify what is driving financial performance. For example, if ROE improves because margins are increasing due to better menu pricing and lower food waste, that is different from an improvement caused mainly by higher leverage. Understanding the components helps users make better decisions about pricing, capital investment, financing, and growth strategy.
Revenue Inputs
The revenue inputs section is where users define the assumptions that drive sales for the BBQ restaurant. This component may include weekday and weekend customer traffic, daily covers, average check size, menu categories, dine-in revenue, takeout orders, delivery sales, beverages, add-ons, catering, event sales, and seasonal patterns. Because BBQ restaurants often experience different demand levels across lunch, dinner, weekends, holidays, local events, and game days, the ability to adjust revenue assumptions in detail is essential. The model can convert these assumptions into monthly and annual revenue forecasts, helping users understand how many customers are needed to support payroll, rent, food costs, and other operating expenses. This section is useful for validating the commercial side of the plan, testing pricing strategies, estimating the impact of catering or delivery channels, and aligning the forecast with capacity. It also helps users explain their revenue logic in a business plan or funding document, showing stakeholders that sales projections are based on measurable drivers rather than unsupported top-line estimates.
Bank-Ready Reports
The bank-ready reports component organizes the financial outputs into a format that can support lender discussions, loan applications, and professional business planning. Lenders typically want to see whether the BBQ restaurant can generate enough revenue and cash flow to cover operating expenses, repay debt, and maintain adequate liquidity. This component may include projected profit and loss statements, cash flow forecasts, balance sheet outputs, debt schedules, financing assumptions, and summary metrics. Users can review revenue, cost of goods sold, payroll, overhead, EBITDA, net profit, cash balance, and debt service capacity in a lender-friendly structure. For a BBQ restaurant seeking funding for equipment, leasehold improvements, inventory, working capital, or expansion, these reports help demonstrate financial readiness. They also help business owners identify whether the requested funding amount is realistic and whether the repayment plan is supported by projected cash flow. Clean formatting and organized statements make the model easier to share with banks, credit unions, investors, partners, or advisors.
Revenue Breakdown
The revenue breakdown component provides a more detailed view of how total sales are generated across the restaurant’s revenue streams. For a BBQ restaurant, revenue may come from smoked meats, platters, sandwiches, sides, beverages, family meals, catering trays, sauces, merchandise, delivery orders, or special events. This section helps users see which categories contribute the most to sales and how changes in menu mix can affect total revenue and margins. Inputs may include pricing, unit volume, sales mix percentages, customer counts, order frequency, and channel assumptions. Outputs can show revenue by category, percentage contribution, monthly growth, and annual totals. This is useful because not all sales are equally profitable. A high-volume item with low margin may not support the business as well as a premium platter, catering order, or beverage sale with stronger contribution margin. By reviewing the revenue breakdown, users can refine menu strategy, adjust promotional focus, prioritize higher-margin products, and build a more defensible forecast for investors, lenders, or internal planning.
KPI Dashboard
The KPI dashboard component tracks the performance metrics that matter most for managing and evaluating a BBQ restaurant. These metrics may include revenue growth, gross margin, food cost percentage, labor cost percentage, EBITDA margin, net profit margin, average order value, customer volume, cash balance, break-even progress, payback period, and return metrics. A KPI dashboard is useful because it turns the financial model into a management tool, not just a forecast. Users can compare projected performance against industry benchmarks, internal targets, or updated actual results as the business develops. For a BBQ restaurant, key performance indicators are especially important because small changes in food cost, waste, portion control, labor scheduling, or average check size can materially affect profitability. This component helps users identify which drivers need attention and where operational improvements may have the greatest financial impact. It also provides a concise way to communicate progress to investors, lenders, partners, or management teams without requiring them to review the full financial model in detail.
Startup Cost Breakdown
The startup cost breakdown component helps users estimate the initial investment required to open or expand a BBQ restaurant. This section may include kitchen equipment, smokers, grills, refrigeration, prep tables, ventilation, furniture, point-of-sale systems, signage, licenses, permits, deposits, leasehold improvements, opening inventory, branding, pre-opening marketing, professional fees, technology, training, and working capital reserves. The outputs help users calculate the total funding needed before the restaurant begins generating consistent revenue. This is a critical planning area because underestimating startup costs can lead to cash shortages, delayed openings, or the need for emergency financing. By organizing launch expenses into clear categories, the model helps founders and business owners decide how much owner investment, debt, or investor funding may be required. It also supports better conversations with landlords, lenders, contractors, equipment suppliers, and partners. For a BBQ concept, where specialized cooking equipment and buildout costs can be significant, a structured startup cost schedule helps create a more realistic and reliable opening budget.
Break-Even Analysis
The break-even analysis component helps users understand when the BBQ restaurant may generate enough revenue to cover its fixed and variable costs. This section can use assumptions such as average order value, customer volume, gross margin, food cost percentage, labor costs, rent, utilities, insurance, marketing, and other operating expenses to estimate the sales level required to reach profitability. The outputs may show break-even revenue, break-even customer counts, break-even timing, and the relationship between sales volume and profit. This is especially useful for decision-making because it shows whether the restaurant needs modest, moderate, or aggressive customer traffic to become sustainable. A founder can use the break-even analysis to set sales targets, evaluate pricing, plan marketing campaigns, adjust staffing levels, or determine whether the cost structure is too heavy for the expected market. For investors and lenders, break-even timing is a key indicator of financial viability because it shows how quickly the business may move from startup losses to operating profit and whether the funding plan includes enough runway to reach that point.
File types:
Excel – Single-User: .xlsx
Excel – Multi-User: .xlsx
Similar ProductsOther customers were also interested in...

 HenrySheykin
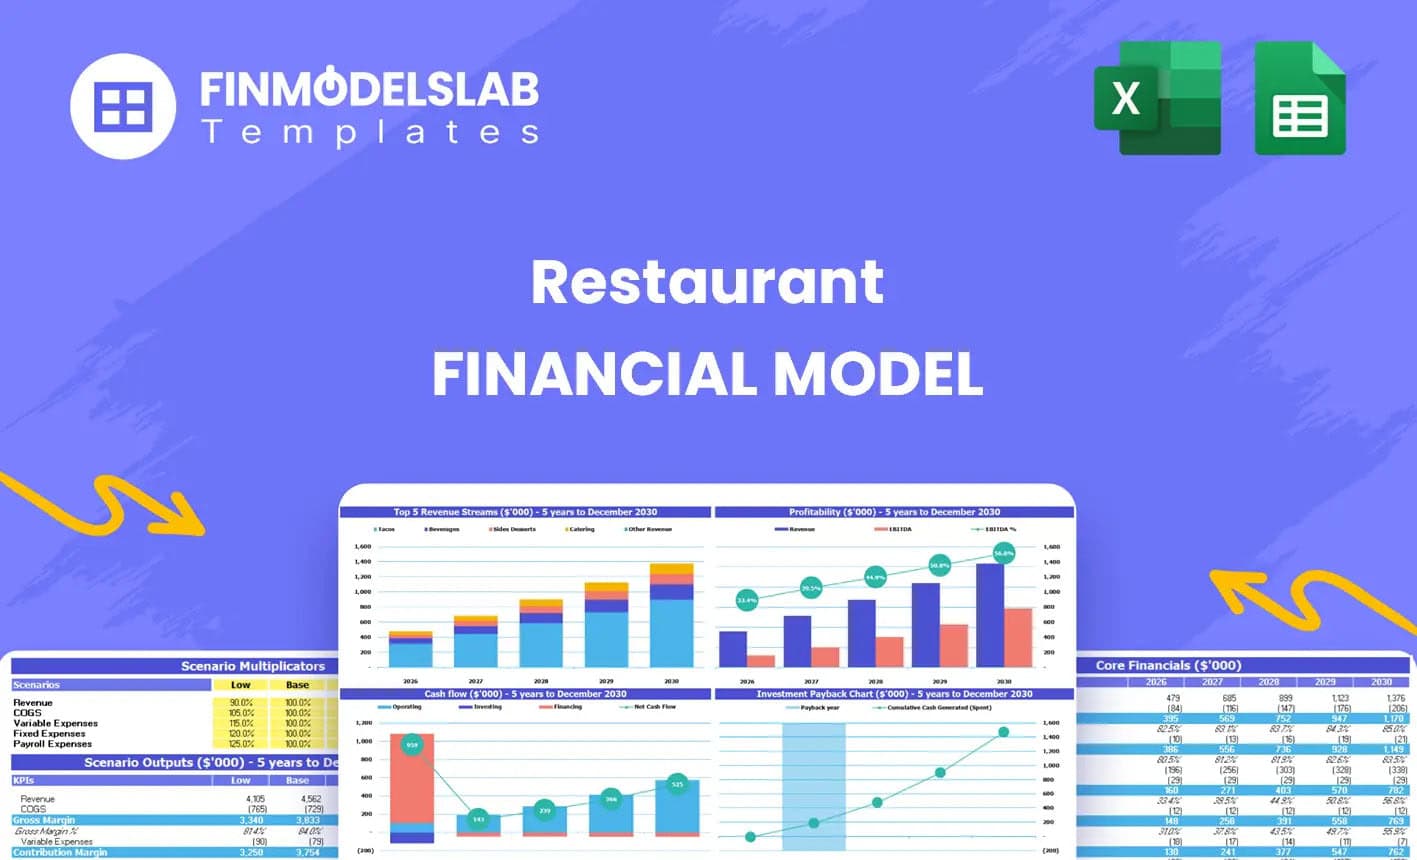
Restaurant Financial Model Excel Template
" The Restaurant Financial Model helps users turn a restaurant concept into a structured, editable f... Read more
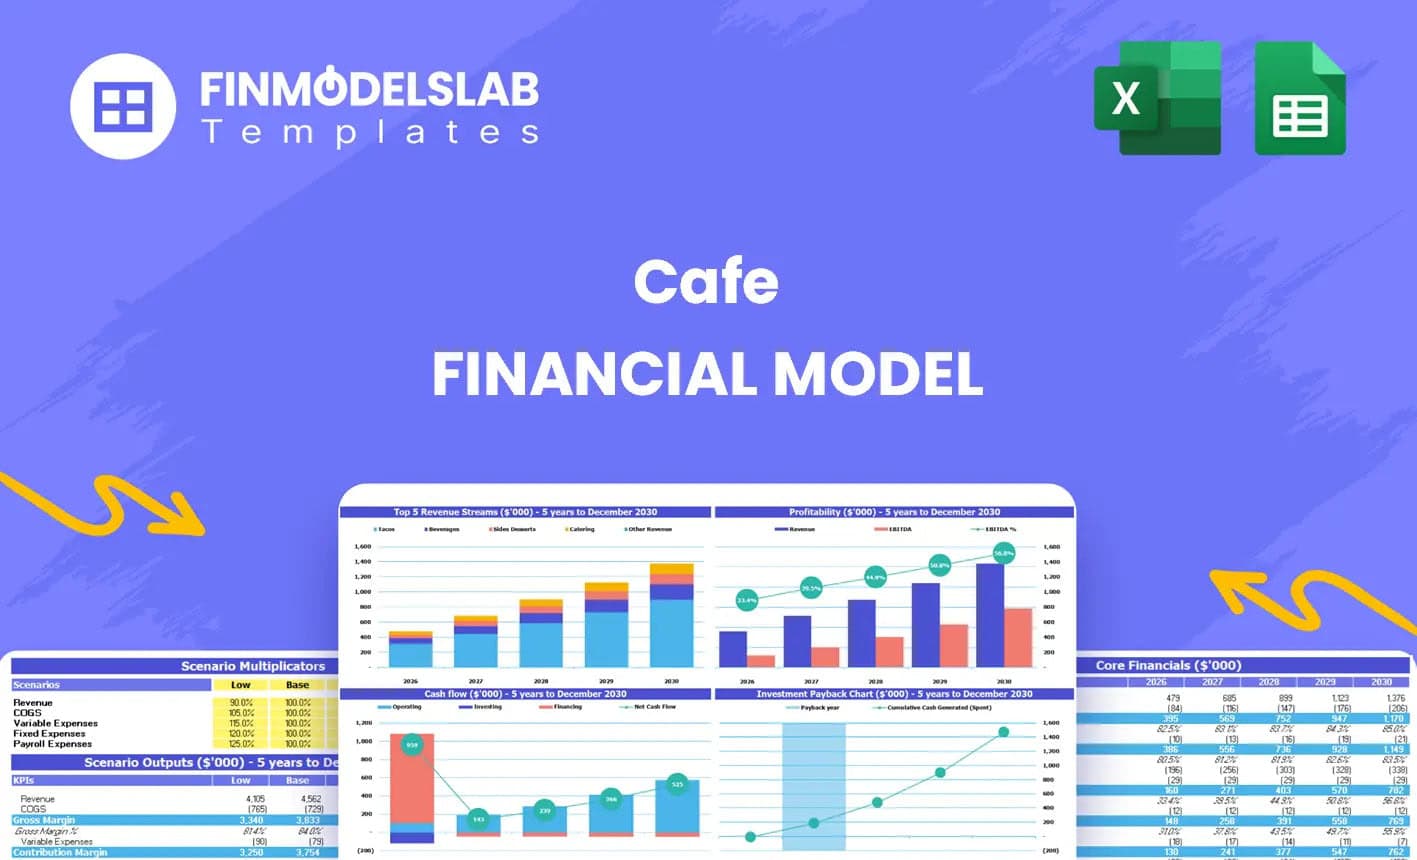
Cafe Financial Model Excel Template
The Cafe Financial Model is a ready-to-use financial model template designed to help entrepreneurs, ... Read more
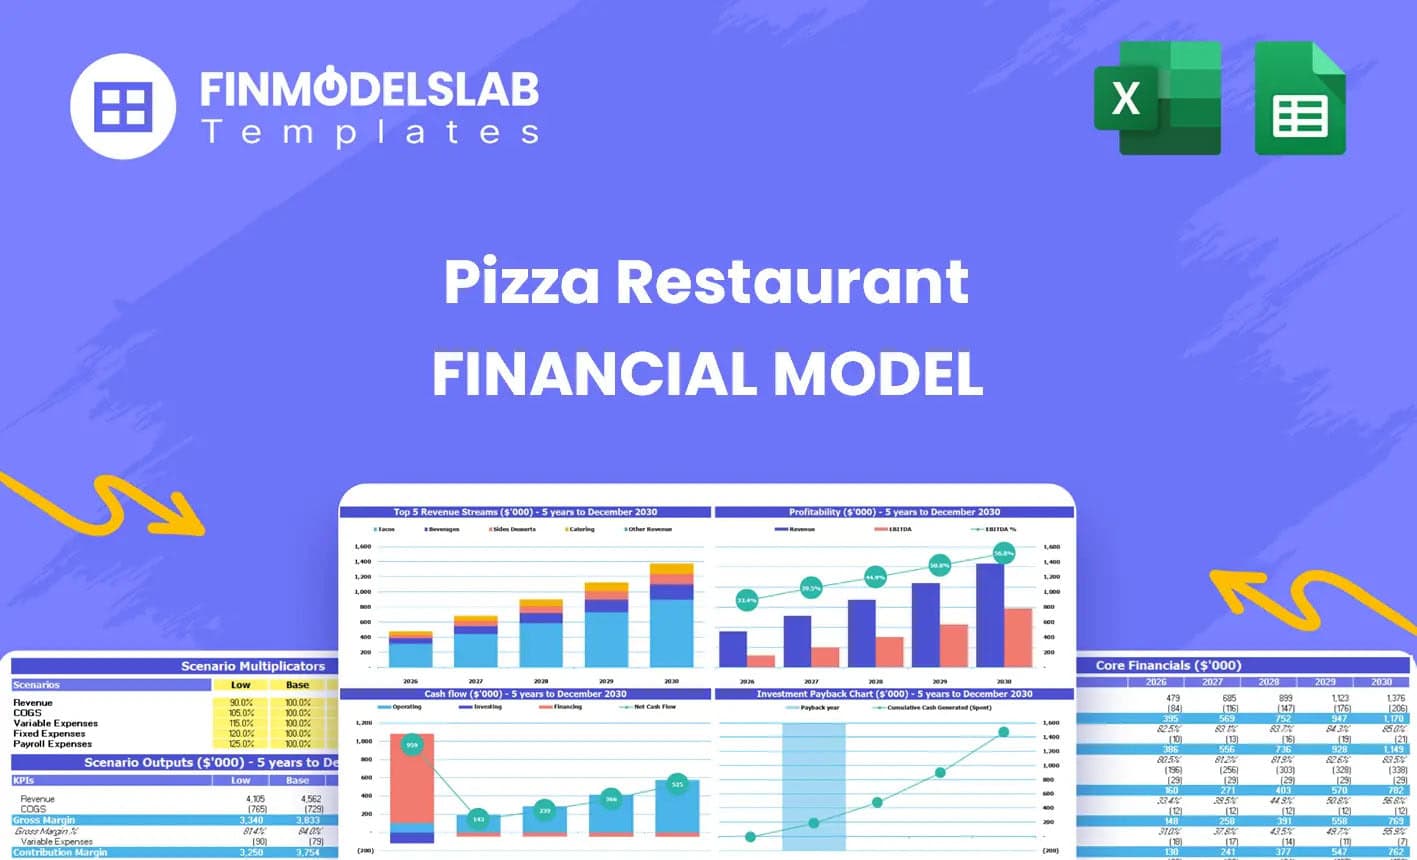
Pizzeria Financial Model Excel Template
The Pizza Restaurant Financial Model Template helps entrepreneurs, restaurant owners, consultants, a... Read more

Fast Casual Restaurant Financial Model Excel Templ...
The Fast Casual Restaurant Financial Model helps entrepreneurs, restaurant owners, consultants, anal... Read more

Pub Financial Model Excel Template
The Pub Financial Model helps entrepreneurs, pub owners, consultants, analysts, and business planner... Read more

Fine Dining Restaurant Financial Model Excel Templ...
The Fine Dining Restaurant Financial Model helps entrepreneurs, restaurant owners, consultants, anal... Read more

A La Carte Restaurant Financial Model Excel Templa...
The A La Carte Restaurant Financial Model Financial Model Template helps entrepreneurs, restaurant o... Read more
Catering Financial Model Excel Template
The Catering Service Financial Model helps users turn a catering business plan into a structured, ed... Read more
Gourmet Food Store Financial Model Excel Template
The Gourmet Food Store Financial Model helps entrepreneurs, founders, business owners, consultants, ... Read more
Banquet Hall Financial Model Excel Template
The Banquet Hall Financial Model helps entrepreneurs, venue owners, consultants, analysts, and busin... Read more
You must log in to submit a review.