
0 ITEMS

Rice Growing Financial Model Excel Template
The Rice Farming Financial Model helps turn a rice cultivation plan into a structured, investor-ready financial forecast. Instead of building a farm projection model from scratch, users can work from a ready-to-edit template designed around the economics of rice production, including land allocation, crop yield, harvest cycles, pricing, direct production costs, labor, capital expenditure, cash flow, and long-term profitability. It is built to support practical financial planning for both new rice farming ventures and existing operations evaluating expansion, land acquisition, equipment investment, or funding requirements. This template is useful for entrepreneurs, farm owners, agribusiness founders, consultants, analysts, and anyone preparing a rice farming business plan, investor presentation, loan application, or internal budget. It helps users document revenue assumptions by crop type, estimate startup costs, map operating expenses, plan payroll, and evaluate how production scale, yield improvements, pricing changes, and cost efficiencies affect profitability. By connecting operational assumptions with financial outputs, the model provides a clearer view of what the business may need before launch and how it may perform over time. The Rice Farming Financial Model is designed for decision-making, not just reporting. Users can test low, base, and high scenarios, review cash flow timing, assess break-even performance, evaluate payback expectations, and understand the impact of major decisions such as leasing versus purchasing land or investing in machinery. The model also includes visual dashboards, charts, financial statements, KPI tracking, and bank-ready outputs that make it easier to explain the economics of the farm to lenders, investors, partners, or management teams. With editable assumptions and compatibility with Excel and Google Sheets, the template gives users a flexible planning tool that can be customized for different farm sizes, regions, rice varieties, cost structures, and financing strategies. It helps replace guesswork with a transparent forecast, giving users a more disciplined way to assess revenue potential, operating risks, cash needs, profitability, and long-term sustainability before committing capital or presenting the opportunity to stakeholders.
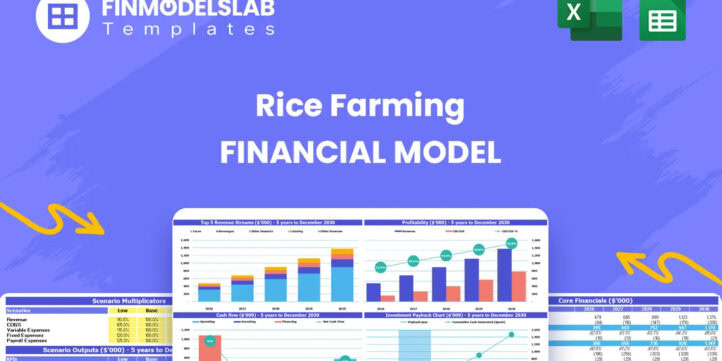


Financial Model Overview
The Rice Farming Financial Model is a ready-to-use financial model template built specifically for planning, evaluating, and presenting a rice farming business. It gives entrepreneurs, farm owners, agribusiness consultants, analysts, and business plan writers a structured way to forecast revenue, costs, profitability, cash flow, funding needs, and long-term returns for a rice cultivation operation. Because rice farming depends on land allocation, yield per hectare, crop type, harvest frequency, water and fuel costs, direct crop inputs, machinery investment, labor, and seasonal cash timing, a generic spreadsheet is rarely enough. This model brings those key drivers together in one editable framework so users can replace rough estimates with a clear financial forecast. It is suitable for startup planning, expansion analysis, investor presentations, bank loan applications, internal budgeting, and strategic decision-making. Users can adjust assumptions such as cultivated hectares, rice variety mix, yield, pricing, COGS, payroll, land ownership, leasing costs, CAPEX, and financing structure, then review how those inputs affect profit and cash flow over time. The result is a practical planning tool that helps explain the economics of the farm in a professional, lender-friendly, and investor-ready format.
All-in-One Dashboard
The all-in-one dashboard gives users a centralized view of the model’s most important inputs and outputs, making it easier to understand the financial position of the rice farming business without moving through every calculation tab. This component can bring together key assumptions such as cultivated land area, crop allocation, yield per hectare, harvest cycles, pricing per kilogram, production loss, operating cost margins, payroll, capital expenditures, and financing needs. It also summarizes core outputs such as revenue, EBITDA, net profit, cash balance, investment required, payback timing, and return metrics. For a rice farming operation, this is especially useful because the financial picture can change quickly when land size, yield, or crop pricing changes. A dashboard helps users see how operational assumptions translate into financial performance, allowing founders, owners, and advisors to quickly review whether the model is aligned with business goals. It is also valuable when presenting to stakeholders because it condenses complex farm economics into a clean, easy-to-read format. Instead of explaining dozens of spreadsheet rows, users can focus discussions on the numbers that matter most, including expected revenue growth, cash requirements, profitability trends, and the major levers that drive performance.
Low, Base, and High Scenario Analysis
The low, base, and high scenario analysis component helps users test how the rice farming business may perform under different operating and market conditions. A base case can represent the most realistic plan, while the low case may reflect weaker pricing, lower yield, delayed harvests, higher crop losses, increased fuel costs, or slower land expansion. The high case can represent stronger yields, improved pricing, better cost efficiency, faster scale-up, or higher productivity from machinery and agronomic practices. This section is important because rice farming is exposed to weather, commodity price changes, irrigation conditions, labor availability, fertilizer costs, and harvest timing risks. By changing a defined set of assumptions, users can compare revenue, gross margin, EBITDA, net income, cash flow, funding gaps, and returns across multiple outcomes. This supports more disciplined decision-making because it shows whether the project is only attractive under optimistic assumptions or whether it can remain viable under pressure. For investors and lenders, scenario analysis demonstrates that the business owner has considered downside risk and understands the sensitivity of the farm’s economics. For management, it helps identify which variables deserve the most attention, such as yield protection, cost control, crop mix, or financing strategy.
Professional Charts
The professional charts component turns the rice farming forecast into visual outputs that are easier to review, explain, and present. Charts may show revenue growth by year, revenue mix by rice variety, EBITDA trends, net profit development, cash balance movement, CAPEX deployment, margin improvement, payback progression, or key ratio changes over the forecast period. This is useful because financial statements alone can be difficult for stakeholders to interpret quickly, especially when a model includes multiple crop types, land expansion assumptions, seasonal cash flows, and capital investments. Visual charts help users communicate the financial story of the rice farming business in a concise and credible way. They can be used in investor meetings, lender discussions, board presentations, partner updates, and internal planning reviews. For example, a chart showing cultivated hectares expanding over time alongside rising EBITDA can help explain how scale drives profitability. A cash balance chart can highlight funding requirements before harvest revenue accumulates. A margin chart can show the impact of better input efficiency or reduced COGS as the farm matures. By presenting the most important financial movements visually, this component supports faster understanding and more confident decision-making.
ROE Components and DuPont Analysis
The ROE components and DuPont analysis section helps users understand what is driving return on equity within the rice farming business. Instead of viewing ROE as a single output, DuPont analysis breaks it into underlying performance drivers such as profitability, asset efficiency, and financial leverage. For a capital-intensive rice farm, this is particularly valuable because returns are shaped not only by operating profit but also by land ownership, machinery investment, working capital, debt funding, and the scale of equity invested. Inputs may include net income, revenue, total assets, equity, debt levels, asset turnover, and profit margins. The section helps generate a clearer explanation of whether returns are improving because the farm is becoming more profitable, using assets more efficiently, or relying more heavily on leverage. This matters for investors because a high return may look attractive, but the source of that return determines the quality and risk of the opportunity. For farm owners and analysts, the DuPont view helps identify whether strategic focus should be placed on increasing margin, improving land and equipment utilization, managing debt, or optimizing the balance between owned and leased assets. It adds a deeper layer of financial interpretation beyond basic profit and loss reporting.
Revenue Inputs
The revenue inputs section is where users define the assumptions that drive sales for the rice farming operation. These assumptions may include the number of hectares cultivated, the percentage of land allocated to each rice variety, yield per hectare, number of harvests per year, expected crop loss, saleable kilograms, market price per kilogram, and annual improvement or price change assumptions. Because rice farm revenue is directly linked to agronomic and commercial assumptions, this section is one of the most important parts of the template. Users can model different rice varieties, such as long-grain, short-grain, aromatic, specialty, or other product categories, and see how changes in allocation affect total revenue. It also helps users evaluate the impact of yield improvements, pricing changes, and harvest efficiency. For example, increasing yield per hectare or reducing post-harvest loss can materially improve revenue without requiring more land. The revenue inputs section supports business planning by making the link between farm operations and financial outcomes transparent. It helps users defend their assumptions in front of lenders or investors and provides a practical basis for sales forecasts, production planning, inventory expectations, and profitability analysis.
Bank-Ready Reports
The bank-ready reports component organizes the rice farming forecast into outputs that lenders, investors, and professional stakeholders expect to review. These reports may include the profit and loss statement, cash flow forecast, balance sheet, funding requirement summary, debt service assumptions, investment use of funds, profitability metrics, and key financial ratios. A rice farming project often requires substantial upfront investment for land, irrigation, machinery, storage, working capital, crop inputs, and labor before revenue fully materializes, so lenders need a clear view of how capital will be used and how repayment capacity develops. This section helps users present financial information in a structured and credible format instead of relying on informal spreadsheets or disconnected estimates. It also supports loan applications by showing projected revenue, direct costs, overheads, EBITDA, net income, cash available, and balance sheet strength over time. For investors, the reports help explain capital needs, expected returns, payback potential, and the operational assumptions behind the forecast. For business owners, bank-ready reporting improves internal discipline because it highlights whether the operation can support its debt, maintain liquidity, and reach sustainable profitability under realistic assumptions.
Revenue Breakdown
The revenue breakdown section provides a detailed view of how total farm income is generated across different rice varieties, land allocations, yields, harvests, and pricing assumptions. Rather than showing revenue as one single number, this component separates the drivers behind the forecast so users can see which crop types contribute the most sales, which varieties are most sensitive to price or yield changes, and how the revenue mix evolves as the farm expands. Inputs may include hectares by crop type, yield per hectare, harvest cycles, production loss percentage, saleable output, selling price, and growth assumptions. Outputs can include revenue by variety, total kilograms sold, average realized price, annual revenue growth, and percentage contribution by stream. This is useful for deciding whether to focus on higher-volume varieties, premium-priced rice, diversified production, or a more concentrated crop strategy. It also supports discussions with partners, buyers, and lenders because the user can explain exactly where projected sales come from. For a rice farming business plan, a detailed revenue breakdown adds credibility by showing that income assumptions are grounded in production logic rather than broad top-down estimates.
KPI Dashboard
The KPI dashboard helps users monitor the operational and financial performance indicators that matter most for a rice farming business. It may track metrics such as revenue per hectare, yield per hectare, gross margin, EBITDA margin, net profit margin, COGS as a percentage of revenue, cash balance, payback period, IRR, ROE, debt ratios, working capital needs, and land utilization. This section is valuable because rice farming performance depends on both agricultural productivity and financial discipline. A farm may generate strong production volumes but still face weak profitability if input costs, water costs, fuel, payroll, rent, or financing expenses are too high. The KPI dashboard gives users a concise way to identify trends, compare performance against targets, and spot potential issues early. It can support monthly management reviews, investor updates, lender reporting, and operational planning. For example, if revenue per hectare is rising but EBITDA margin is falling, the user can investigate whether cost inflation is offsetting production gains. If cash flow remains tight despite positive accounting profit, the dashboard can point attention toward working capital or CAPEX timing. By combining financial and operating metrics, this component helps users manage the rice farming business with greater clarity.
Startup Cost and CAPEX Planning
The startup cost and CAPEX planning section helps users estimate the initial investment required to launch or expand the rice farming operation. This may include land acquisition, land preparation, irrigation infrastructure, tractors, harvesters, planting equipment, drying and storage facilities, vehicles, technology systems, permits, pre-opening professional services, initial crop inputs, and working capital reserves. Rice farming can be capital-intensive, and underestimating startup costs can create cash pressure before the business reaches stable production. This component helps users itemize one-time investments, separate them from recurring operating expenses, and understand how major purchases affect the cash flow forecast and balance sheet. It can also support decisions around whether to buy or lease machinery, purchase land immediately or gradually, invest heavily upfront or phase expansion over time, and how much financing may be required before harvest revenue is available. Outputs may include total launch cost, annual CAPEX schedule, depreciation assumptions, funding gap, and investment timing. This section is especially useful for funding documents because banks and investors want to see a clear use of funds. It also helps owners make more practical decisions about project phasing, capital allocation, and risk management.
Break-Even and Payback Analysis
The break-even and payback analysis section helps users understand when the rice farming business may begin covering its operating costs and when the initial investment may be recovered. Break-even analysis can use assumptions such as revenue, gross margin, fixed operating expenses, variable production costs, payroll, rent, and overhead to estimate the sales or production level needed to avoid operating losses. Payback analysis then looks beyond monthly profitability and considers how long it may take for cumulative cash flow to recover upfront CAPEX, land investment, machinery purchases, and working capital needs. This distinction is important for rice farming because a farm may reach operating break-even relatively quickly after harvest revenue starts, while still requiring several years to recover the capital invested in land, equipment, and infrastructure. Outputs may include break-even month, break-even revenue, cumulative cash position, payback period, and investment recovery profile. This component is useful for founders evaluating whether the business is financially feasible, for lenders assessing repayment timing, and for investors comparing the opportunity with alternative uses of capital. It also supports decision-making by showing how changes in yield, crop pricing, COGS, payroll, CAPEX, or land strategy can shorten or lengthen the path to profitability.
File types:
Excel – Single-User: .xlsx
Excel – Multi-User: .xlsx
Similar ProductsOther customers were also interested in...


 Giorgos
Crop Farm Financial Model – Dynamic 10 Year Fore...
If you want to start a crop farm from scratch or you need a sample crop farm business plan template,... Read more

 eFinancialModels
Agriculture Financial Model Templates Bundle
This is a collection of financial model templates for businesses in the Agriculture Industry and its... Read more
 HenrySheykin
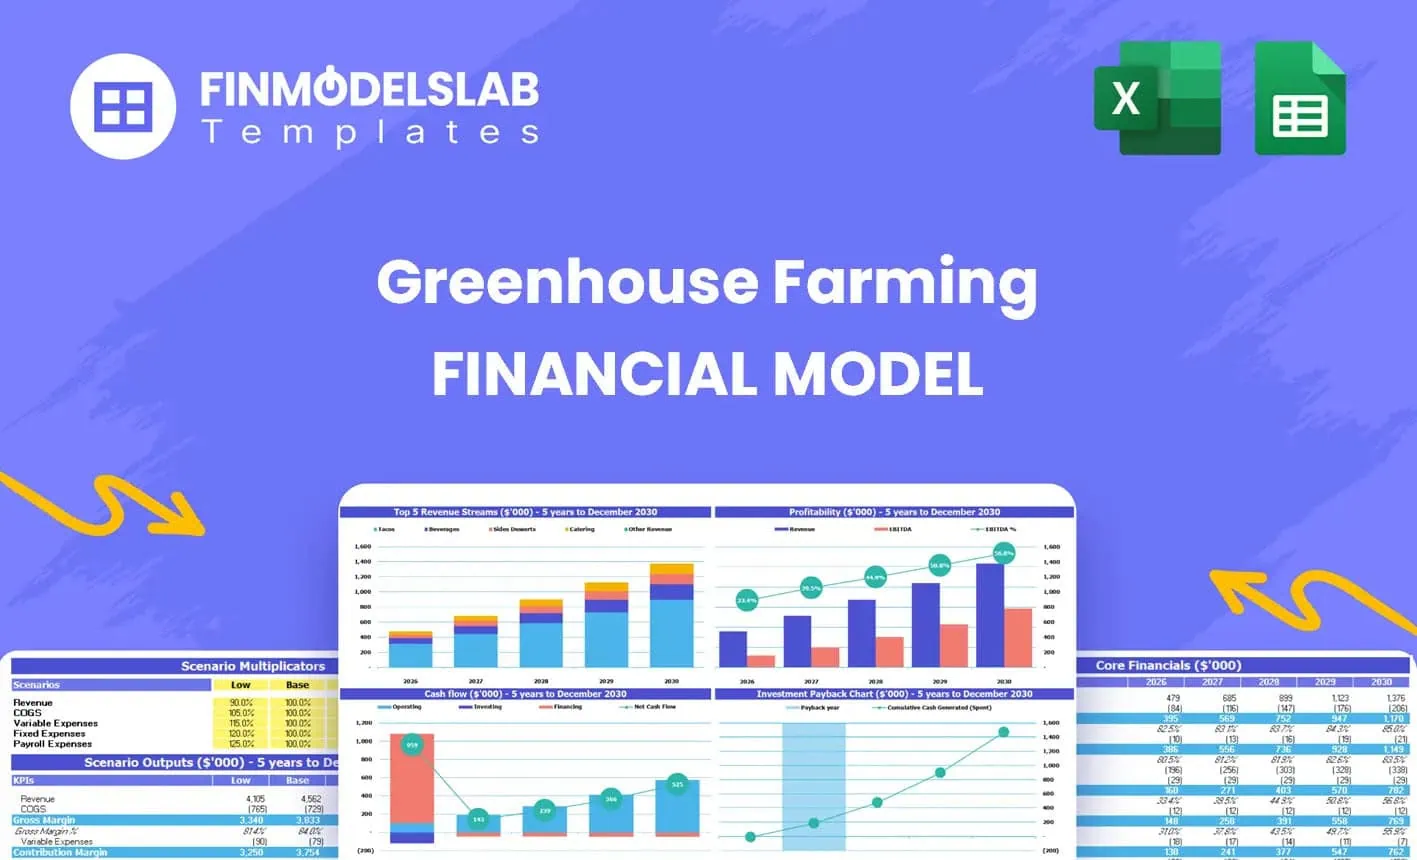
Greenhouse Farming Financial Model Excel Template
The Greenhouse Farming Financial Model helps users evaluate the economics of a controlled environmen... Read more
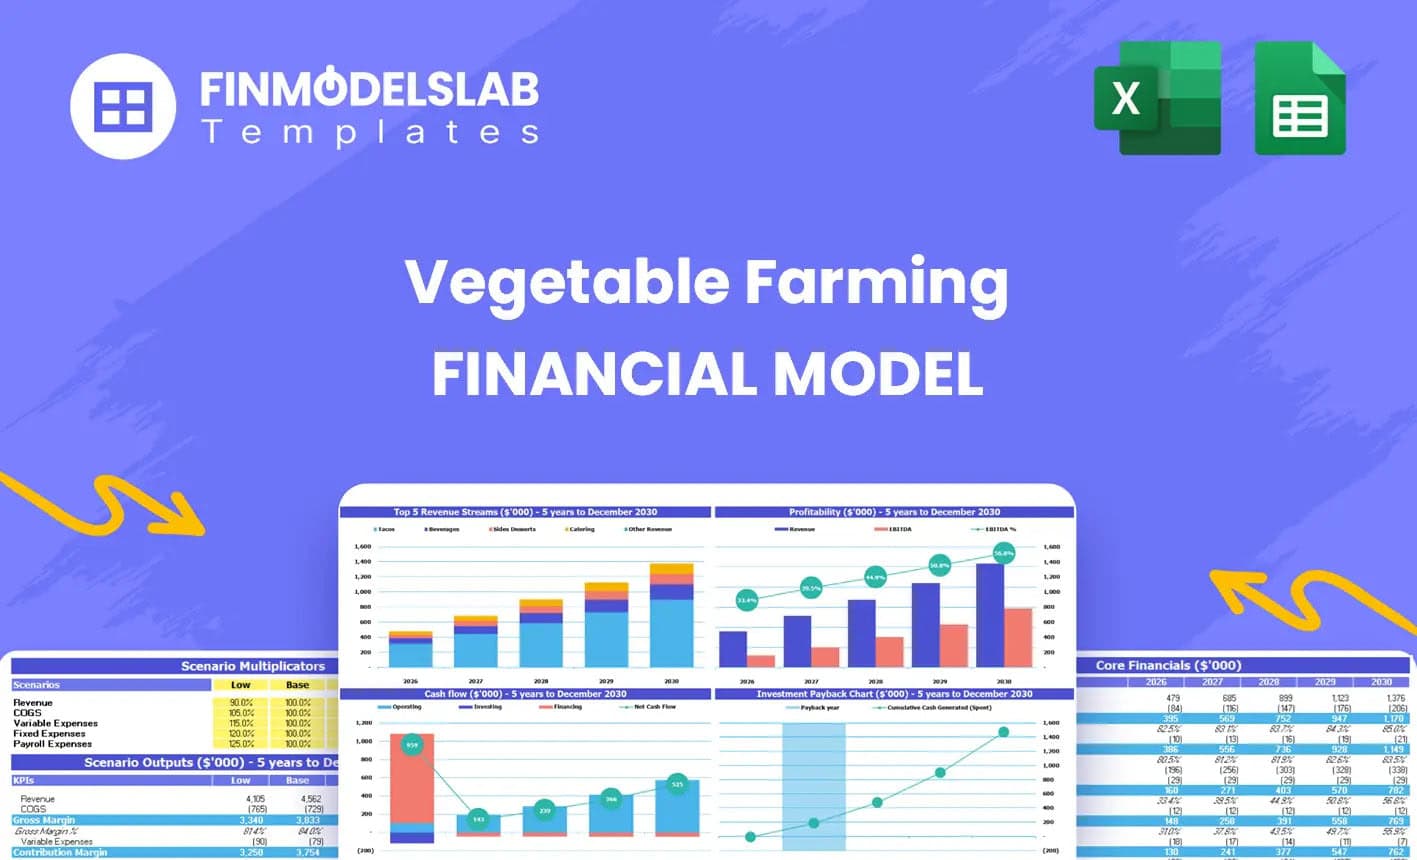
Vegetable Farming Financial Model Excel Template
The Vegetable Farming Financial Model helps users turn a farming concept, expansion plan, or funding... Read more

Organic Gardening Financial Model Excel Template
The Gardening Service Financial Model helps users turn a lawn care, garden maintenance, or horticult... Read more
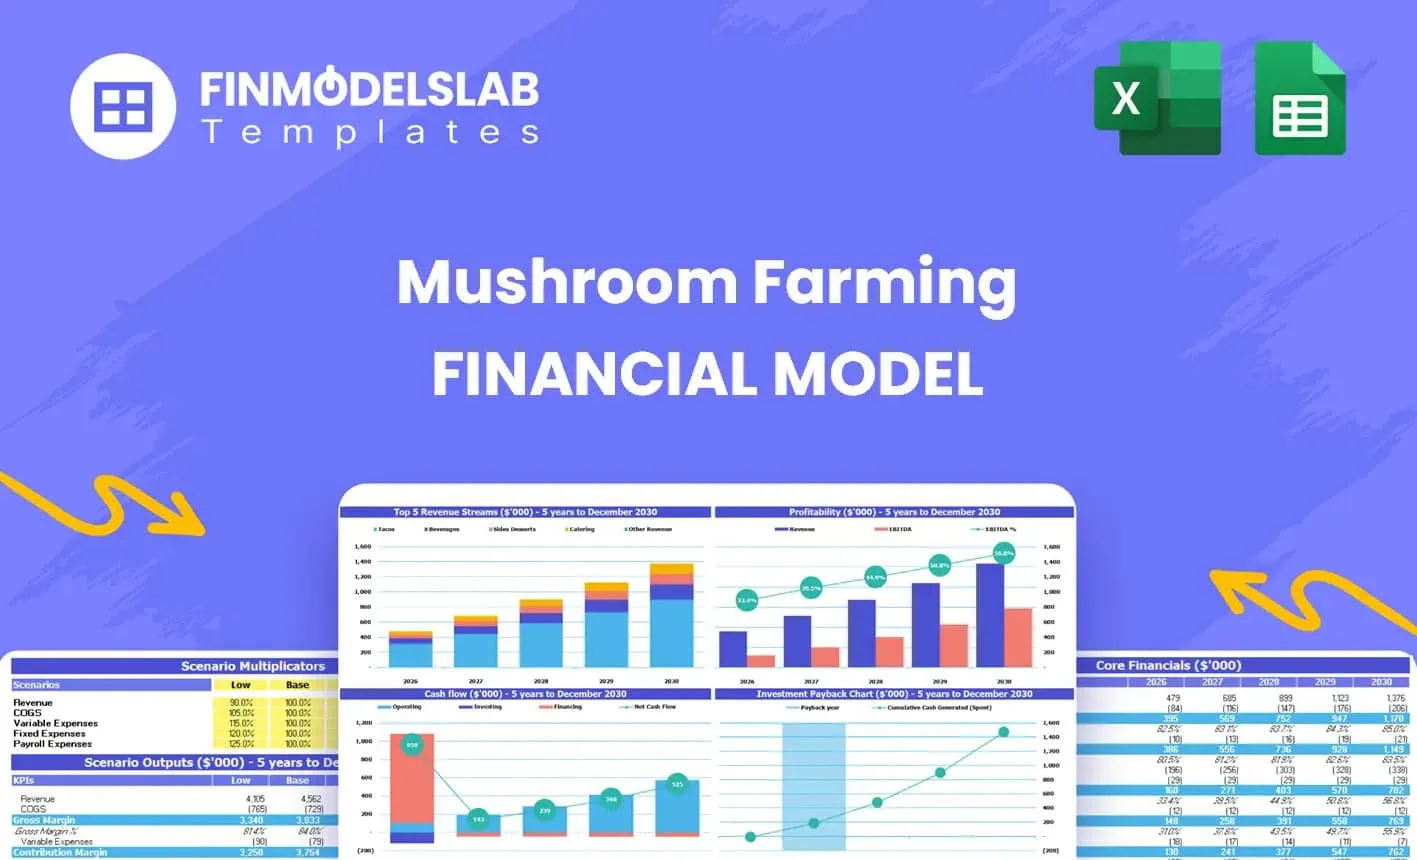
Mushrooms Farming Financial Model Excel Template
The Mushroom Farming Financial Model helps entrepreneurs, growers, business owners, consultants, and... Read more
Poultry Farm Financial Model Excel Template
The Poultry Farming Financial Model helps users turn a poultry farm concept into a structured, lende... Read more
Cannabis Financial Model Excel Template
The Cannabis Business Financial Model is a ready-to-use financial model template designed to help en... Read more
Fish Farm Financial Model Excel Template
The Fish Farming Financial Model template helps entrepreneurs, aquaculture founders, business owners... Read more
Shrimp Farm Financial Model Excel Template
The Shrimp Farming Financial Model helps entrepreneurs, aquaculture operators, consultants, analysts... Read more
You must log in to submit a review.